Ad hoc procedure for optimising agreement between observational records
Javier Arana1, Daniel Lapresa2*, M. Teresa Anguera3, y Belén Garzón21 Universidad Internacional de La Rioja (UNIR) (España). 2 Universidad de La Rioja (España). 3 Universidad de Barcelona (España).
Título: Procedimiento ad hoc para optimizar el acuerdo entre registros
ob-servacionales.
Resumen: Habitualmente, los estudios observacionales desarrollados en el
ámbito deportivo, se encuentran con la dificultad añadida que supone la elevada complejidad de las diferentes conductas que constituyen el registro, así como de la velocidad a la que éstas se suceden. El presente trabajo pre-tende satisfacer tres objetivos en relación con la fiabilidad de los datos ob-servacionales. El primero consiste en implementar de forma conjunta en un mismo estudio, para facilitar así su comparación, formas de concordan-cia cuantitativa (coeficiente kappa de Cohen) y cualitativa (concordanconcordan-cia por consenso). El segundo persigue detallar el proceso de obtención del coeficiente kappa de Cohen, bajo el parámetro orden -mediante el software SDIS-GSEQ, versión 5.1.- con paquetes de datos constituidos por un nú-mero diferente de secuencias, incidiéndose en la forma en la que se garan-tiza su alineación. En el tercer objetivo, que persigue superar la confusión generada por dos registros diferentes, se presenta un procedimiento de me-jora de la fiabilidad del dato. El procedimiento ha sido denominado “con-sultivo”, al ser un nuevo observador el que determina qué conducta de las registradas es la que verdaderamente ha tenido lugar y, por lo tanto, proce-de incluir en el registro proce-definitivo.
Palabras clave: Metodología observacional; fiabilidad; concordancia;
kap-pa de Cohen; procedimiento consultivo.
Abstract: Observational studies in the field of sport are complicated by the added difficulty of having to analyse multiple, complex events or be-haviours that may last just a fraction of a second. In this study, we analyse three aspects related to the reliability of data collected in such a study. The first aim was to analyse and compare the reliability of data sets assessed quantitatively (calculation of kappa statistic) and qualitatively (consensus agreement method). The second aim was to describe how, by ensuring the alignment of events, we calculated the kappa statistic for the order param-eter using SDIS-GSEQ software (version 5.1) for data sets containing dif-ferent numbers of sequences. The third objective was to describe a new consultative procedure designed to remove the confusion generated by discordant data sets and improve the reliability of the data. The procedure is called “consultative” because it involves the participation of a new ob-server who is responsible for consulting the existing observations and de-ciding on the definitive result.
Key words: Observational methodology, reliability, agreement, Cohen’s
kappa, consultative procedure.
1*
Introduction
The extraordinary diversity of situations that can be system-atically observed in sports and physical activity (Lapresa, Anguera, Alsasua, Arana & Garzón, 2013) requires the de-sign of ad hoc observation tools suited to each behaviour of interest (Anguera, Blanco-Villaseñor, Losada & Hernández-Mendo, 2000). Garganta (2007) highlighted the difficulty of designing observation tools capable of capturing behaviours or events that are considered relevant yet may last only frac-tions of a second, and it is only logical that the reliability of data resulting from the observation of such fleeting events, which are common in the field of sport, has been questioned (O’Donoghue, 2007). In this article we address three issues related to the reliability of observational data.
First, as highlighted by Anguera and Hernández-Mendo (2013), the reliability of observational data can be estimated using agreement coefficients -proportion of concordant re-sults- or correlation coefficients -measure of covariation- (Bland & Altman, 1986, 1990; Nevill & Atkinson, 1997). Re-liability however, can also be measured qualitatively using the increasingly popular consensus agreement method (Anguera, 1990), designed to achieve agreement between observers based on the discussion of each code before it is recorded.
* Dirección para correspondencia [Correspondence address]:
Daniel Lapresa Ajamil. Universidad de la Rioja. Departamento de Cien-cias de la Educación. Edificio Vives, C/ Luis de Ulloa s/n. 26004. Lo-groño, La Rioja (España). E-mail: [email protected]
The first aim of our study was to assess the reliability of sets of observational data both qualitatively and quantitatively, thereby facilitating the comparison of the two methods. For the quantitative analysis, we calculated Cohen’s chance-corrected kappa statistic (1960) using SDIS-GSEG software, version 5.1 (Bakeman & Quera, 1992), while for the qualita-tive analysis, we used the consensus agreement method de-scribed by Anguera (1990).
Second, when a set of sequences of different units of be-havior -for which there is no clear beginning or end- is inde-pendently coded by various observers or by the same ob-server at two different moments, the resulting number of se-quences in each data block can vary, which is problematic as pairs of event sequences need to be aligned in order to calcu-late kappa (Quera, Bakeman, & Gnisci, 2007). While special alignment software programs exist for event sequences (Bakeman, 1978), such as Global Sequence Alignment (GSA) and Event Alignment (ELign) developed by Quera et al. (2007), they are not applicable to multievent data (Bakeman & Quera, 1995). The second aim of this study thus was to describe how we overcame the problem of misaligned data (soccer play sequences in our case) to calculate the kappa sta-tistic using order as the primary parameter (Bakeman, McAr-thur & Quera, 1996).
Third, when researchers are faced with two different ob-servations of the same event (from example, the area from which a shot was taken), they have no way of knowing with certainty which observation is correct. All they can be sure of on comparing the results is what each observer recorded.
Thus, the third objective of this study was to describe a new method of qualitative agreement that removes the confusion generated by two different interpretations. We call this new procedure “consultative”, as it involves having a third expert observer analyse the event or behaviour in question, consult the conflicting observations, and produce what will be con-sidered the definitive observation.
We addressed our three objectives in a study that ana-lysed the movement of a football around a soccer field. We chose this setting as, according to Robinson and O’Donoghue (2007), events that occur within a playing area are commonly used as performance indicators in observa-tional studies.
Method
We used an observational methodology (Anguera, 1979). The observational design (Anguera, Blanco-Villaseñor, Her-nández-Mendo & Losada, 2011; Anguera, Blanco-Villaseñor & Losada, 2001) was point (three matches) with intrassesion-al follow-up (continuous monitoring of events throughout each observation session, or match) (Anguera & Hernández-Mendo, 2013); nomothetic (three teams of players aged 11-12); and multidimensional (different observation tool crite-ria). Observation was non-participatory and active, and the level of perceptibility was complete -direct observation- (Anguera et al., 2000).
Participants
The first three teams classified in the competition orga-nized by a territorial soccer federation were intentionally se-lected. The players which comprise the teams are boys who turn 12 years old during this year. The study complied with the American Psychological Association’s code of ethics and informed consent was obtained from all participants. A tri-angular tournament (Team A, Team B, Team C), in 7-a-side soccer discipline, was organised to perform the study. Each match lasted for 30 minutes and each minute of each match was analysed (90 minutes of play in total). Within-session consistency was guaranteed by establishing a list of minimum criteria to satisfy for all sessions observed.
Observation tool
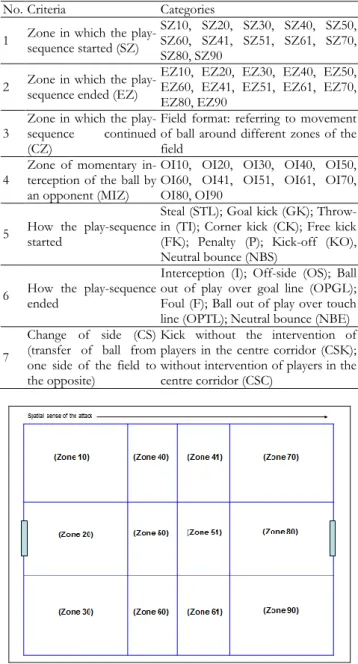
We designed an observation tool to analyse the move-ment of the football around the playing field. It is a combi-nation of field format and system of categories (Anguera, Magnusson & Jonsson, 2007; Herrero, 1992). Table 1 shows the criteria and categories used, and Figure 1 shows the zones into which the playing field was divided.
Recording and coding
The software SDIS-GSEQ was used to record and code the data with a purpose-designed template adapted to the
syntax rules and conventions of SDIS -Sequential Data In-terchange Standard- (Bakeman & Quera, 2007); the template included all the observational criteria contemplated in the tool.
Table 1. Structure of observation tool
No. Criteria Categories
1 Zone in which the play-sequence started (SZ)
SZ10, SZ20, SZ30, SZ40, SZ50, SZ60, SZ41, SZ51, SZ61, SZ70, SZ80, SZ90
2 Zone in which the play-sequence ended (EZ) EZ10, EZ20, EZ30, EZ40, EZ50, EZ60, EZ41, EZ51, EZ61, EZ70, EZ80, EZ90
3 Zone in which the play-sequence continued (CZ)
Field format: referring to movement of ball around different zones of the field
4
Zone of momentary in-terception of the ball by an opponent (MIZ)
OI10, OI20, OI30, OI40, OI50, OI60, OI41, OI51, OI61, OI70, OI80, OI90
5 How the play-sequence started
Steal (STL); Goal kick (GK); Throw-in (TI); Corner kick (CK); Free kick (FK); Penalty (P); Kick-off (KO), Neutral bounce (NBS)
6 How the play-sequence ended
Interception (I); Off-side (OS); Ball out of play over goal line (OPGL); Foul (F); Ball out of play over touch line (OPTL); Neutral bounce (NBE) 7
Change of side (CS) (transfer of ball from one side of the field to the opposite)
Kick without the intervention of players in the centre corridor (CSK); without intervention of players in the centre corridor (CSC)
Figure 1. Playing field zones.
Based on Bakeman’s (1978) definitions, the data were event-based and concurrent (type II). They were also multi-event (Bakeman & Quera, 1995), as the study design was multidimensional and the observation tool included field-format and category-based criteria.
Each team was observed separately, giving rise to two da-ta blocks for each match analysed. A play sequence was con-sidered to start or end when signaled by the referee or when
the team being analysed touched the ball at least twice in a row. A single touch by the team not being observed was in-terpreted as a momentary interception of the ball by an op-ponent (criterion 4) and therefore did not indicate the begin-ning or end of a play-sequence.
Procedure
Four observers were used. They were trained in three progressive stages using the approach described by Anguera (2003), which involves theoretical training followed by theo-retical-practical training and practical training. The four ob-servers were divided into three observation blocks, described below.
Data block 1
Three observers (none of whom are authors of this arti-cle) were used for data block 1 (B-1), which was used to ana-lyse qualitative consensus agreement: different observers coming to an agreement on which observation to record (Anguera, 1990). The observers were informed that “agree-ment” referred to a decision taken on a given observation without strong objection from any of the observers. The ob-servation group was provided with a set of guidelines de-signed to help them to resolve inevitable disagreements and overcome obstacles such as confrontation or submission that typically arise when different observers must agree on a re-sult. The advice given was as follows: “Use logic”, “Do not change your mind simply to avoid conflict”, “Support ideas you partly agree with”, “Consider differences in opinion to be positive (don’t think in terms of win-lose)”, “Argue your opinions", “Avoid strategies like: this time you, next time me”, “Listen actively (i.e. listen and be heard)”, “Do not crit-icize”, “Make suggestions”, “Remember that you are all equally responsible for the success of the process”.
Data block 2
Data block 2 (B-2) was analysed by one of three observ-ers from the first group. The observer was asked to re-analyse all the data from B-1 (the whole sample) and to rec-ord/code each action again. This step was designed to inves-tigate quantitative agreement between the observations for B-1 and B-2.
Data block 3
A fourth observer (one of the authors of this article) was used for the third, and definitive, data block (B-3). This ob-server did not record all the data, just actions for which there were discrepancies between B-1 and B-2. Another of the au-thors of this article (who was responsible for training the servers as previously described) had provided this fourth ob-server with the video files and data sets containing the play sequences for which there were discrepancies. The
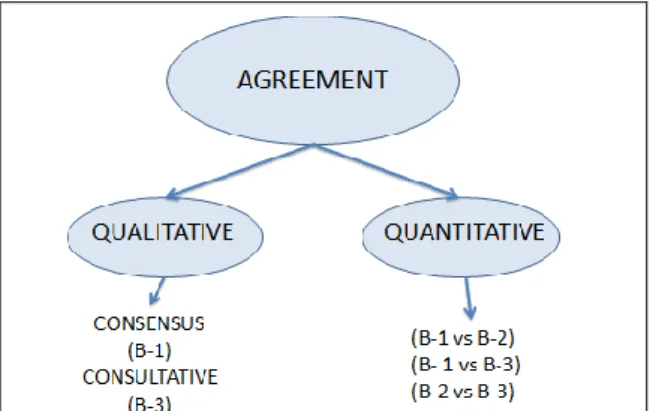
agree-ment procedure used is termed “consultative”, as before generating the definitive data block, the observer consults the data produced by the other two observers and either choses one of these blocks or creates a new block of his own. The aim of this third step was to achieve qualitative consultative agreement on observations for which there were discrepancies. It also allowed us to obtain two quantitative coefficients of agreement: B1 vs B3 and B2 vs B3 (Figure 2).
Figure 2. Structure of observation procedure showing data blocks
Analysis of agreement between data blocks
Reliability, in the form of agreement, was calculated quantitatively using Cohen’s kappa statistic, which is widely used because of its satisfactory metric properties (Benavente, Ato & López, 2006). The kappa statistic is a measure of agreement for nominal classifications, with no ordering of data among the different categories. It is used to quantify in-ter-rater agreement and corrects for chance. It is expressed mathematically as [
k e e o p p p 1 (1 ) ) ( ], where po is the
ob-served proportion of agreement, pe the expected (chance)
proportion of agreement, and k the different categories. Kappa was calculated using version 5.1 of the SDIS-GSEQ software program following the recommendations of Bake-man & Quera (1995, 2001, 2011).
The procedure designed to optimize the quality of data obtained using the observation tool built for the current study was divided into three phases, described in detail be-low.
a) Initial phase
In the initial phase, we compared observations from B-1 and B-2. All observations from each match/team observed were processed as a block of data. To calculate the kappa statistic for the whole block, we computed a weighted meas-ure, taking into account the number of multi-events and the number of agreements.
b) Adjustment phase
The second stage was designed to reduce the effects that inter-sequence disagreements have on the calculation of kappa by match/team observed. These disagreements reduce the likelihood of a favorable agreement index, particularly when they involve sequences at the beginning of the data block. To reduce these effects, when a sequence was not rat-ed by a particular observer, the data block was split at this point, allowing us to estimate agreement based on the same sequences (1 with 1, 2 with 2, etc.).
Next, we calculated a kappa statistic for each data block generated for each match/team observed, and then calculat-ed a weightcalculat-ed measure to produce a single value for the whole block.
c) Modification phase
In the third phase, the modification phase, we searched for discrepancies affecting a particular action (intra-sequence disagreement) between B-1 and B-2. These were given to the fourth observer, whose job it was to choose the definitive observation for each case. This definitive data block (B-3) was used for the data analysis. To reduce observer-expectancy bias (Anguera, 1990), the fourth observer was unaware of which data belonged to B-1 and which belonged to B-2. He was additionally able to introduce changes in the definitive data block as he saw fit.
Results
Initial phaseTable 2 shows the kappa values for inter-block agree-ment (B-1 vs B-2) on the events for each match/team ob-served.
Table 2. Kappa statistics for the matches observed in the initial phase
Initial Phase Match/Team Kappa
Team A_Team B .5847 Team A_Team C .3523 Team B_Team A .9013 Team B_Team C .7037 Team C_Team A .4075 Team C_Team B .2983
To calculate the kappa statistic for the whole data block, we calculated the ratio between agreements and multi-events (no. of agreements / no. of multi-events) and the total ratio (Σ) (Table 3).
We then calculated the weight of each ratio (ratio / Σ ra-tios) and the weight of the kappa statistic for each data block (weight × kappa) (Table 4). We finally calculated the kappa statistic for the whole data block by adding the weighted val-ues. The weighted kappa statistic for agreement between B-1 and B-2 in the initial phase was 0.5601.
Table 3. No. Agreements / No. Events or Multi-events and Total Ratio
(Σ)
Match/Team Multi-events Nº Agreements Nº Nº Agreements / Nº Multi-Events
Team A_Team B 324 277 .8549 Team A_Team C 346 275 .7948 Team B_Team A 310 305 .9839 Team B_Team C 388 361 .9304 Team C_Team A 361 291 .8061 Team C_Team B 342 264 .7719 Σ = 5.1420 Table 4. Weight x Kappa
Match/Team Weight (Ratio / Σ Ratios) Kappa (Weight x Kappa)
Team A_Team B .1663 .5847 .0972 Team A_Team C .1546 .3523 .0545 Team B_Team A .1913 .9013 .1725 Team B_Team C .1809 .7037 .1273 Team C_Team A .1568 .4075 .0639 Team C_Team B .1501 . 2983 .0448 .5601 Adjustment phase
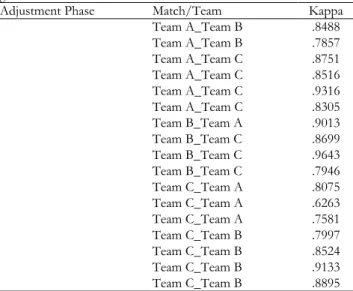
We calculated a kappa statistic for each of the blocks of data generated in the adjustment phase to ensure matching of comparable sequences in each of the matches/teams ob-served (Table 5).
Table 5. Kappa statistics for agreement between B-1 and B-2 by data block
generated
Adjustment Phase Match/Team Kappa
Team A_Team B .8488 Team A_Team B .7857 Team A_Team C .8751 Team A_Team C .8516 Team A_Team C .9316 Team A_Team C .8305 Team B_Team A .9013 Team B_Team C .8699 Team B_Team C .9643 Team B_Team C .7946 Team C_Team A .8075 Team C_Team A .6263 Team C_Team A .7581 Team C_Team B .7997 Team C_Team B .8524 Team C_Team B .9133 Team C_Team B .8895
Using the same method as that described in the initial phase, we obtained a single weighted kappa value of 0.8420 for agreement between B-1 and B-2 in the adjustment phase.
Modification phase
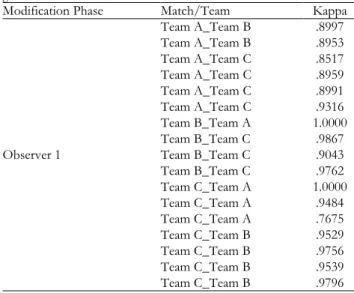
Tables 6 and 7, respectively, show the results obtained on comparing B-3 (the definitive set of observations produced
by the fourth observer) with B-1 and with B-2 for each of the data blocks generated.
Table 6. Kappa statistics for agreement between B-1 and B-3 by data block
generated
Modification Phase Match/Team Kappa
Observer 1 Team A_Team B .8997 Team A_Team B .8953 Team A_Team C .8517 Team A_Team C .8959 Team A_Team C .8991 Team A_Team C .9316 Team B_Team A 1.0000 Team B_Team C .9867 Team B_Team C .9043 Team B_Team C .9762 Team C_Team A 1.0000 Team C_Team A .9484 Team C_Team A .7675 Team C_Team B .9529 Team C_Team B .9756 Team C_Team B .9539 Team C_Team B .9796
Table 7. Kappa statistics for agreement between B-2 and B-3 by data block
generated.
Modification Phase Match/Team Kappa
Observer 2 Team A_Team B .8953 Team A_Team B .9356 Team A_Team C .9800 Team A_Team C .9533 Team A_Team C .9316 Team A_Team C 1.0000 Team B_Team A .9115 Team B_Team C .9659 Team B_Team C .9886 Team B_Team C .7956 Team C_Team A .8395 Team C_Team A .8605 Team C_Team A .8098 Team C_Team B .8246 Team C_Team B .9006 Team C_Team B .9350 Team C_Team B .8618
The resulting kappa statistics were 0.9309 for B-1 vs B-3 and 0.9056 for B-2 vs B-3, indicating very good agreement according to the criteria of Landis and Koch (1977) and Altman (1991). Table 8 shows the kappa statistics calculated for whole data block by phase and modality.
Table 8. Kappa statistics by phase and modality.
Initial Phase Adjustment Phase Modification Phase B-1 and B-2 B-1 and B-2 B-1 and B-3 B-2 and B-3
.5601 .8420 .9309 .9056
Discussion and Conclusions
As highlighted by Anguera and Hernández-Mendo (2013), once a set of data has been gathered, the observer needs to be confident of its quality (Anguera, 2003). Reliability is one of the most important indicators of the quality of a set of observational data. We will discuss the results of our study in the light of the three objectives established, each of which addressed a different aspect of data reliability.
We showed a high level of agreement between the data recorded by different observers in both our quantitative and qualitative assessment of reliability. For the quantitative anal-ysis, we calculated the kappa statistic using SDIS-GSEQ, a program that has been widely used in the scientific literature for this purpose (Castellano, Hernández-Mendo, Morales & Anguera, 2007; Hernández-Mendo & Anguera, 2002; Lapre-sa, Arana, Anguera & Garzón, 2013; LapreLapre-sa, Ibañez, Arana, Garzón & Amatria, 2011). For the qualitative assessment, we analysed consensus agreement (Anguera, 1990), a measure that is gaining increasing acceptance in observational meth-odology. The consensus agreement approach has several ad-vantages: not only does it produce a single observation but it also uses a strong observation tool to which clear definitions and additional information can be added as needed. It does, however, have some drawbacks, including the risk of con-frontation during the consensus-building phase or compliant attitudes triggered by the presence of an “expert” in the group. It is noteworthy that in the modification phase, the kappa statistic obtained for B-1 vs B-3 was higher than that obtained for B-2 vs B-3, providing further evidence that the qualitative consensus agreement approach introduced by Anguera (1990) is an effective tool for improving the quality of data.
Our second objective was to describe how to calculate kappa, focusing on the order parameter (Anguera, 1989), for data sets containing a different number of sequences. As can be seen, the kappa values obtained in the initial phase (before alignment) indicated very poor agreement between the data sets. The application of our adjustment procedure, however, ensured alignment of sequences (Bakeman et al., 1996; Quera et al., 2007) and the kappa value for agreement be-tween data packages B-1 and B-2 increased from 0.5601 in the initial phase to 0.8420 in the adjustment phase.
With regards to our third objective, our ad hoc consulta-tive procedure achieved its goal: to guarantee high-quality data from an observation exercise. The consultative phase designed to improve the reliability of the data by producing a definitive set of observations (B-3) has three clear ad-vantages:
1) It acts as an additional filter and therefore contributes to improving the quality of the data.
2) The definitive block can be used to assess inter-block agreement at additional levels (in our case, B-1 vs B-3 and B-2 vs B-3).
3) It saves time and effort as the observer responsible for producing the definitive set of observations only has to
analyse events on which there was disagreement. The cost of implementing a consultative procedure is not ex-cessive considering the serious challenges that face re-searchers analysing multievent data sets (Bakeman & Quera, 1995) containing discordant or misaligned units. We consider that our procedure therefore has not only a positive cost-benefit ratio but also a positive cost-utility ratio, as it is likely to improve researchers’ satisfaction considerably by providing a rigorous solution to the problem of discordant data sets.
The limitations of this study concern the first objective, i.e. they are related to the difficulty associated with generaliz-ing the coefficients of agreement obtained in the modifica-tion phase. In brief, there was greater agreement between the
data block generated using the consensus agreement method (B-1) and the definitive data block (B-3) than between the data block generated by a single observer (B-2) and the de-finitive block. The procedure described in relation to the other two objectives of our study is easy to implement and provides a viable solution to an unresolved problem facing many researchers: the lack of agreement between data sets.
Acknowledgements.- We gratefully acknowledge the support of
the Spanish government within the project Observación de la interacción
en deporte y actividad física: Avances técnicos y metodológicos en registros auto-matizados cualitativos-cuantitativos (Secretaría de Estado de
Investiga-ción, Desarrollo e Innovación del Ministerio de Economía y Com-petitividad) during the period 2012-2015 [Grant DEP2012-32124].
References
Altman, D.G. (1991). Practical statistics for medical research. London: Chapman and Hall.
Anguera, M.T. (1979). Observational Typology. Quality & Quantity.
European-American Journal of Methodology, 13(6), 449-484.
Anguera, M.T. (1988). Observación en la escuela. Barcelona: Grao. Anguera, M.T. (1989). Innovaciones en la metodología de
evalua-ción de programas. Anales de Psicología, 5, 13-42.
Anguera, M.T. (1990). Metodología observacional. En J. Arnau, M.T. Anguera y J. Gómez (Eds.), Metodología de la investigación en
Ciencias del Comportamiento (pp. 125-238). Murcia: Universidad de
Murcia.
Anguera, M.T. (2003). La observación. En C. Moreno (Ed.),
Evalua-ción psicológica. Concepto, proceso y aplicaEvalua-ción en las áreas del desarrollo y de la inteligencia (pp. 271-308). Madrid: Sanz y Torres.
Anguera, M.T., Blanco-Villaseñor, A., Hernández-Mendo, A. & Lo-sada, J.L. (2011). Diseños observacionales: Ajuste y aplicación en psicología del deporte. Cuadernos de Psicología del Deporte,
11(2), 63-76.
Anguera, M.T., Blanco-Villaseñor, A. & Losada, J.L. (2001). Dise-ños observacionales, cuestión clave en el proceso de la metodo-logía observacional. Metodometodo-logía de las Ciencias del Comportamiento,
3(2), 135-160.
Anguera, M.T., Blanco-Villaseñor, A., Losada, J. & Hernández-Mendo, A. (2000). La metodología observacional en el deporte: Conceptos básicos. Lecturas: Educación Física y Deportes, 5(24). Retrieved from http://www.efdeportes.com/efd24b/obs.htm Anguera, M.T. & Hernández-Mendo, A. (2013). Observational
methodology in sport sciences. E-balonmano.com: Journal of Sport
Science, 9(3), 135-160.
Anguera, M.T., Magnusson, M.S. & Jonsson, G.K. (2007).
Instrumen-tos no estándar. Avances en medición, 5(1), 63-82.
Bakeman, R. (1978). Untangling streams of behavior: Sequential analysis of observation data. In G.P. Sackett (Ed.), Observing
Be-havior, Vol. 2: Data collection and analysis methods (pp. 63-78).
Bal-timore: University of Park Press.
Bakeman, R., McArthur, D. & Quera, V. (1996). Detecting group differences in sequential association using sampled permuta-tions: Log odds, kappa, and phi compared. Behavior Research
Methods, Instruments, and Computers, 28(3), 446-457. Doi:
10.3758/BF03200524
Bakeman, R. & Quera, V. (1992) SDIS: A sequential data inter-change standard. Behavior Research Methods, Instruments &
Comput-ers, 24(4), 554-559. Doi: 10.3758/BF03203604
Bakeman, R. & Quera, V. (1995). Analyzing interaction: Sequential
anal-ysis with SDIS and GSEQ. Cambridge: Cambridge University
Press.
Bakeman, R. & Quera, V. (2001). Using GSEQ with SPSS.
Metodo-logía de las Ciencias del Comportamiento, 3(2), 195-214.
Bakeman, R. & Quera, V. (2007). Reference manual GSEQ: 4.1.3. Re-trieved from http://www.ub.es/comporta/sg.htm
Bakeman, R. & Quera, V. (2011). Sequential analysis and observational
methods for the behavioral sciences. Cambridge: Cambridge
Universi-ty Press.
Benavente, A., Ato, M. & López, J.J. (2006). Procedimientos para detectar y medir el sesgo entre observadores. Anales de Psicología,
22(1), 161-167.
Blanco-Villaseñor, A. (1993). Fiabilidad, precisión, validez y genera-lizabilidad de los diseños observacionales. En M.T. Anguera (Ed.), Metodología observacional en la investigación psicológica, Vol. 2:
Fundamentación (pp. 151-261). Barcelona: PPU.
Bland, J.M. & Altman, D.G. (1986). Statistical methods for as-sessing agreement between two methods of clinical measure-ment. The Lancet, i, 307-310.
Bland, J.M. & Altman, D.G. (1990). A note on the use of the intra-class correlation coefficient in the evaluation of agreement be-tween two methods of measurement. Computers in Biology and
Medicine, 20, 337-340.
Castellano, J., Hernández-Mendo, A., Morales, V. & Anguera, M.T. (2007). Optimizing a probabilistic model of the development of play in soccer. Quality & Quantity. International Journal of
Methodol-ogy, 41(1), 93-104. Doi: 10.1007/s11135-005-3148-0
Cohen, J. (1960). A coefficient of agreement for nominal scales.
Educational and Psychological Measurement, 20, 37-46.
Garganta, J. (2007). Modelaçao táctica em jugos desportivos: A desejável cumplicidade entre pesquisa, treino e competiçao.
Re-vista Portuguesa de Ciências do Desporto, 7(1), 13.
Hernández-Mendo, A. & Anguera, M.T. (2002). Behavioral struc-ture in sociomotor sports: Roller-Hockey. Quality & Quantity.
International Journal of Methodology, 36(4), 347-378. Doi:
10.1023/A:1020905411739
Herrero, M.L. (1992). Posibilidades de la metodología observacional en el estudio analítico de conductas en el aula: Aplicación en
es-colares con problemas de comportamiento. Anales de Psicología,
8(1-2), 149-155.
Lapresa, D., Anguera, M.T., Alsasua, R., Arana, J. & Garzón, B. (2013). Comparative analysis of T-patterns using real time data and simulated data by assignment of conventional durations: The construction of efficacy in children's basketball. International
Journal of Performance Analysis in Sport, 13(2), 321-339.
Lapresa, D., Arana, J., Anguera, M.T. & Garzón, B. (2013). Com-parative analysis of the sequentiality using SDIS-GSEQ and THEME: A concrete example in soccer. Journal of Sport Sciences,
31(15), 1687-1695. Doi: 10.1080/02640414.2013.796061
Lapresa, D., Ibañez, R., Arana, J., Garzón, B. & Amatria, M. (2011). Spatial and temporal analysis of karate kumite moves: compara-tive study of the senior and 12-13 year old groups. International
Journal of Performance Analysis in Sport, 11(1), 57-70.
Nevill, A.M. & Atkinson, G. (1997). Assessing agreement between measurements recorded on a ratio scale in sports medicine and sports science. British Journal of Sports Medicine, 31(4), 314-318. Doi: 10.1136/bjsm.31.4.314
O´Donoghue, P. (2007). Reliability issues in performance analysis.
International Journal of Performance Analysis in Sport, 7(1), 35-48.
Quera, V., Bakeman, R. & Gnisci, A. (2007). Observer agreement for event sequences: Methods and software for sequence alignment and reliability estimates. Behavior Research Methods,
39(1), 39-49. Doi: 10.3758/BF03192842
Robinson, G. & O´Donoghue, P. (2007). A weighted kappa statistic for reliability testing in performance analysis of sport.
Interna-tional Journal of Performance Analysis in Sport, 7(1), 12-19.