LA COLLANA DELLA SCUOLA DI ALTA FORMAZIONE DOTTORALE ACCOGLIE LE MIGLIORI TESI DI DOTTORATO DELL’UNIVERSITÀ DEGLI STUDI DI BERGAMO, INSIGNITE DELLA DIGNITÀ DI STAMPA E SOTTOPOSTE A PROCEDURA DI BLIND PEER REVIEW.
The present publication aspires to be a comprehensive research on the main aspects of open-wheeled racing car aerodynamics. Starting from the comprehension of ground effect principles, the work moves towards the simulation of a modern F1 car. The vehicle aerodynamics is numerically investigated from many points of view: different setups and operating conditions are taken into account in order to fully characterize the behaviour of the vehicle and evidence any possible critical aspects. The considered 2017 F1 car, as expression of current FIA Technical Regulations, has proved to be poorly suited to working in slipstream: as a result, both the approach to a vehicle ahead and the overtaking manoeuvre are difficult and unsafe. In light of this, the core of the research is directed towards the aerodynamic development of the original car, with the aim of improving its performance both in freestream and, above all, in wake flows.
UMBERTO RAVELLI graduated in Automotive Engineering in 2013
from the University of Modena and Reggio Emilia with full marks and honours. After a brief working experience in motorsport industry, he moved to the University of Bergamo, where he received the Ph. D. in Engineering and Applied Sciences (2019 - XXXI cycle): the focus of the research activity was on designing aero components and investigating new solutions for improving the performance of a F1 car, both in freestream and wake flows. He is currently teaching Flight Mechanics in a technical college.
ISBN: 978-88-97413-38-7 DOI: 10.6092/978-88-97413-38-7 Um b e rt o R avelli AER O DY NAMIC S O F A 2 0 17 FO R MULA 1 C AR 21
-Umberto Ravelli
AERODYNAMICS OF A 2017 FORMULA 1 CAR
Design Improvements in Freestream
and Wake Flows
2021
21
Diretta da Paolo Cesaretti
Ogni volume è sottoposto a blind peer review. ISSN: 2611-9927
Umberto Ravelli
AERODYNAMICS OF A 2017 FORMULA 1 CAR
Design Improvements in Freestream
and Wake Flows
______________________________________________________
Università degli Studi di Bergamo
UmbertoRavelli. – Bergamo :
Università degli Studi di Bergamo, 2021.
(Collana della Scuola di Alta Formazione Dottorale; 21) ISBN: 978-88-97413-38-7
DOI: 10.6092/978-88-97413-38-7
Questo volume è rilasciato sotto licenza Creative Commons Attribuzione - Non commerciale - Non opere derivate 4.0
© 2021 UmbertoRavelli
Progetto grafico: Servizi Editoriali – Università degli Studi di Bergamo © 2018 Università degli Studi di Bergamo
via Salvecchio, 19 24129 Bergamo
Cod. Fiscale 80004350163 P. IVA 01612800167
Acknowledgements
The first thanks are addressed to my academic supervisor, Prof. Marco Savini, who gave me the freedom to work on unusual research topics, such as ground effect aerodynamics and racing cars. We acknowledge the CINECA award under the LISA initiative, for the availability of high-performance computing resources and support.
Special thanks to Nicolas Perrin and his team for sharing their F1 project.
I am grateful to ©OptimumG for providing the lap-time simulation software OptimumLap.
I also would like to thank the F1 aerodynamicist Willem Toet, with whom I exchanged ideas in the last part of my research.
“Beh, se ce lo consiglia Varzi, prendiamolo pure questo Tazio Nuvolari. E che Dio ce la mandi buona.” Vittorio Jano, Alfa Romeo designer
Table of contents
Introduction ... 1
Chapter 1. State of the Art and Overall Plan ... 3
1.1 State of the Art ... 4
1.1.1 Ground Effect Aerodynamics ... 4
1.1.2 Experiments on Blunt Bodies ... 5
1.1.3 Experiments on Slender Bodies ... 6
1.1.4 Experiments on Scale Models and Real Vehicles ... 8
1.1.5 The Role of CFD in Vehicle Aerodynamics ... 8
1.2 Overall Plan ... 9
Chapter 2. Understanding the Basics of Racing Car Aerodynamics ... 15
2.1 Geometrical Features... 15
2.2 Simulation Tools ... 17
2.3 Diffuser-Equipped Blunt Body ... 17
2.3.1 Mesh and Simulation Setup ... 17
2.3.2 Aerodynamic Performance ... 20
2.4 Front Wing ... 29
2.4.1 Mesh and Simulation Setup ... 29
2.4.2 Aerodynamic Performance ... 32
2.5 Conclusions ... 40
Chapter 3. Aerodynamic Simulation of a 2017 F1 Car ... 43
3.1 Geometrical Features and CAD Pre-Processing... 43
3.2 Simulation Tools ... 45
3.3 Mesh and Simulation Setup ... 45
3.4 Results and Discussion ... 47
3.5 Conclusions ... 52
4.1 Definition of Front and Rear Ride Height ... 53
4.2 Mesh and Simulation Setup ... 54
4.3 Results and Discussion ... 54
4.4 Conclusions ... 57
Chapter 5. Slipstream Effects on Aerodynamic Performance ... 59
5.1 Mesh and Simulation Setup ... 60
5.2 Results and Discussion ... 60
5.3 Conclusions ... 73
Chapter 6. Aerodynamic Development of the Baseline Vehicle ... 77
6.1 Description of the New Components ... 77
6.1.1 Front Wing ... 77
6.1.2 Nosecone and Front Bodywork ... 78
6.1.3 Front and Rear Suspension ... 80
6.1.4 Sidepod and Engine Cover ... 80
6.1.5 Underbody ... 81
6.1.6 Rear Wing ... 81
6.2 Results and Discussion ... 83
6.3 Conclusions ... 96
Chapter 7. Low, Medium and High-Downforce Layouts in Wake Flows ... 99
7.1 Results and Discussion ... 99
7.1.1 Comparison Between the Baseline and the New Aerodynamic Configurations ... 99
7.1.2 Focus on High-Downforce Vehicle ... 110
7.2 Conclusions ... 115
Chapter 8. Sideslip Angle Sensitivity ... 119
8.1 Mesh and Simulation Setup ... 119
8.2 Results and Discussion ... 119
8.3 Conclusions ... 125
9.1 Simulation Tools ... 127
9.2 Simulation Setup ... 127
9.3 Results and Discussion ... 133
9.3.1 Lap-Time Comparison ... 133
9.3.2 Post-Processing of the Results ... 138
9.4 Conclusions ... 143
References ... 145
List of figures... 151
1
Introduction
In this publication an extensive numerical analysis of open-wheeled racing car aerodynamics is presented. The whole CFD workflow, from meshing to calculation, was carried out by the open-source software OpenFOAM®, in the steady RANS framework. After investigating the mechanisms behind ground effect by means of simple test cases, including a diffuser-equipped blunt body and a single element wing, attention was focused on the 2017 Formula 1 car designed by the British constructor ©PERRINN. The validation of the numerical results in terms of drag, downforce, efficiency and front balance was accompanied by a qualitative study of the flow around the car. Axial vorticity plays a key role in the generation of downforce and the use of ground effect improves the efficiency of the overall vehicle. In the second step of the research, it was found that front and rear ride height have a strong influence on the dynamic behaviour of the car. Since racing implies a close interaction with other vehicles, the core of the research was devoted to evaluation and subsequent improvement of aerodynamic performance in wake flows. Tandem-running simulations at different distances between lead and following cars put in evidence that running in slipstream results in a strong worsening of downforce and a dramatic change in front balance. To overcome these limitations, the baseline vehicle was subjected to a targeted aerodynamic development. Among the tested aero packages, one in particular provided encouraging results: it ensures higher downforce and efficiency than the baseline configuration while fulfilling, at the same time, the goal of reducing the above-mentioned performance worsening in slipstream. The concepts behind the effectiveness of the new design deal with a better management of the chaotic flow underneath the car; moreover, underbody and rear wing adjustments contribute to generation of a shorter and narrower wake. Overall, an easier approach to the lead car and a safer overtaking could be achieved through small modifications to 2017 F1 Technical Regulations, without disrupting the current F1 car layout. As a further check of the robustness of the new design proposals, all the developed aerodynamic configurations have been tested in yawed flow. Finally, the last section of the research aimed at quantifying the lap-time performance of the vehicles equipped with the new aero packages, since each track requires specific levels of downforce and efficiency. Results in terms of aerodynamic specifications are in line with those typically encountered in current F1 grand prix races.
3
Chapter 1. State of the Art and Overall Plan
The present publication aspires to be a comprehensive research on the main aspects of open-wheeled racing car aerodynamics. Starting from the comprehension of ground effect principles, the work moves towards the simulation of a modern F1 car. The vehicle aerodynamics is numerically investigated from many points of view: different setups and operating conditions are taken into account in order to fully characterize the behaviour of the vehicle and evidence any possible critical aspects.
The considered 2017 F1 car, as expression of current FIA Technical Regulations, has proved to be poorly suited to working in slipstream: as a result, both the approach to a vehicle ahead and the overtaking manoeuvre are difficult and unsafe. In light of this, the core of the research is directed towards the aerodynamic development of the original car, with the aim of improving its performance both in freestream and, above all, in wake flows. Further indications about driveability and safety of the new aerodynamic configurations have been attained by means of sideslip angle analysis.
The entire numerical analysis has been conducted through steady RANS calculations, carried out by the open-source software OpenFOAM®. The meshing procedure for complex and realistic geometries was found to suffer from some criticalities, such as the layer addition algorithm, but it allows for high-level automation in creating meshes for different test cases; concerning the fluid dynamic simulation, it can be said that a high degree of freedom in the numerical setup goes hand in hand with greater difficulties in interpreting the final results. Nevertheless, OpenFOAM® was chosen for facilitating the repeatability of the simulations and filling the gap between academic and industrial research, which usually deals with commercial codes.
The original contribution of this research, compared to published literature, lies in the analysis of a complex industrial topic by means of research approaches typical of the academic world: consolidated theoretical know-how and empirical evidences were used to develop, test and integrate new aero devices, for the purpose of improving F1 car aerodynamics in slipstream, both in terms of safety and pure performance.
Nevertheless, for further development, it would be desirable to have access to experimentally measured performance for validation purposes, in order to reach definitive conclusions on the behaviour of complex aero devices in different operative conditions, within the strict limits imposed by the protection of industrial secrets.
4
1.1 State of the Art
1.1.1 Ground Effect Aerodynamics
Investigation of ground effect aerodynamics is crucial in automotive industry, in order to improve performance of road vehicles and racing cars. Over the past 50 years, this branch of aerodynamics has considerably grown, thanks to wind tunnel testing first and then to computational fluid dynamics (CFD), involving both automotive industry and universities.
In the ‘80s, the benefits of using ground effect to improve downforce were already known by F1 engineers. Wright (1982), director of Team Lotus International, summarized the features of the ground effect Formula 1 cars of that era: special attention had been given to the relationship between ground clearance and lift coefficient. As a result, development of the car underbody focused on achieving the highest possible negative lift at the highest possible lift/drag ratio [Wright, (1982), p.389]. The progress made from the late ‘70s to the early 2000’s in aerodynamics of open-wheel race cars is well described by Zhang et al. (2006): despite numerous changes in technical regulations (Figure 1), the ground effect components of the vehicle, such as step plane and diffuser, still play a crucial role in generating downforce and they are much more efficient than other aerodynamic devices (for instance the rear wing).
Owing to geometry complexity, interaction between different components and variability of the operating conditions, race cars are characterized by tricky flow physics: the analysis of individual components, such as diffuser and front wing, is a prerequisite towards a better insight into the overall flow field and the entire vehicle design (Zhang et al., 2006).
5 1.1.2 Experiments on Blunt Bodies
Ground effect aerodynamics of road-vehicle-related blunt bodies was investigated experimentally by George (1981). Detailed data about lift, drag, pitching moment were measured in different conditions: with and without simulated wheels, underbody roughness, proximity to a stationary or moving ground. The results showed that these variables have a strong influence on the aerodynamic performance of the vehicle, so they should be carefully kept into account during the design process. Three types of flows are typical of this kind of bodies: fully attached flow, reversed delta wing-type vortices and separation with presence of recirculation zones.
Two years later, the same author focused on the flow field under Venturi-type bodies, which was found to be highly three-dimensional: the longitudinal vortices under the body help to prevent two-dimensional separation. The optimum ground clearance for generating downforce should be that required to take advantage of both the Venturi effect and the longitudinal vortices in order to keep the diffuser flow attached. This optimum height is larger for larger angle of the diffuser, because more lateral inflow is needed to generate stronger vortices (George and Donis, 1983).
In recent years, research into blunt body aerodynamics has accelerated owing to the need to improve aerodynamic performance of modern vehicles in terms of stability and fuel consumption. A lot of researchers from Southampton University put their efforts into the understanding of vortex structures underneath the diffuser (Mahon et al., 2004) and behind the bluff body (Zhang et al., 2004). In the former paper, it was concluded that edge vortices enhance the downforce as the ride height is reduced until a maximum value of downforce is achieved (Figure 2a). The latter paper contains a detailed investigation about the variation of downforce as function of the diffuser-equipped blunt body ride height: four regions can be identified, as shown in Figure 2b. In the force enhancement region (a), a pair of contra-rotating vortices exists in the cross-plane between the upswept surface and the ground. In the force plateau region (b) the vortices increase in size, but their strength is weakened. The force reduction region (c) is characterised by vortex breakdown whereas the diffuser is starved of mass flow in the loss of downforce region (d). These experimental studies put in evidence that similar blunt bodies in ground effect can show very different downforce trends depending on the amplitude of the diffuser angle and the presence or absence of endplates: one of the major differences consists in the presence of an hysteresis in the force reduction region, mainly caused by a combination of flow separation and vortex breakdown (Figure 2b).
Jowsey and Passmore (2013) carried out an extensive research on diffuser equipped blunt bodies in ground effect. Particular attention was given to the link between the diffuser angle and the lift coefficient: the optimum value for the downforce lies between 13° and 16°, where a local flow separation can be observed at the diffuser inlet. The downforce starts decreasing above 16° and the
6
diffuser is stalled over 25°. Improvement of downforce with minimal increase in drag can be observed with multiple channel diffusers, especially in the range 16°-19°. Cogotti (1998) carried out a detailed examination on a full-scale simplified car model: different wheels, various ground clearances and four wind tunnel configurations were tested (moving ground and rotating wheels, moving ground only, rotating wheels only, all static).
Figure 2: Lift coefficient of the body as function of dimensionless ride height: a) Mahon et al., 2004, b) Zhang et al., 2004
The influence of the floor on wind tunnel simulations has been investigated by several researchers. Carr (1988) came to the conclusion that vehicle models with low ground clearance and a smooth diffuser-equipped underbody develop higher downforce when tested with a moving ground instead of with a stationary wind-tunnel floor. In the paper by Howell and Hickman (1997) it was established that the fixed floor is inadequate, especially when accuracy in drag measurement is needed. An estimation of the difference between moving ground and fixed ground measurement was provided by Bearman et al. (1988): floor movement increases downforce by about 30% and reduces drag by 8% on one-third scale passenger car models.
1.1.3 Experiments on Slender Bodies
In recent years, several experiments on downforce-generating wings in ground effect were carried out at Southampton University. At first, performance characteristics and flowfield phenomena of a single element wing were investigated (Zerihan and Zhang, 2000): the collected data showed that a reduction of the wing ride height leads to higher level of downforce. This trend continues until the ground clearance is less than 20% of the chord. Closer to the ground (less than 10% of the chord) the wing stalls and the downforce drops. In two subsequent papers, the effects of Gurney flaps (Zerihan and Zhang, 2001) and tip vortices (Zhang et al., 2002) on downforce were studied by
7
means of different experimental methods, including particle image velocimetry (PIV), laser Doppler anemometry (LDA), pressure and force balance measurements as well as surface flow visualization. Afterwards the attention was focused on multi element wings. The interaction between the main element and the flap is crucial in determining the performance of the entire wing. As shown in Figure 3, three regions can be identified on the downforce-vs-height curve (Zhang and Zerihan, 2003): as the wing is moved from the freestream toward the ground, the downforce rapidly increases (region a) and the flow is characterized by the tip vortex off the edge of the side plate; the increase in downforce continues, until the edge vortex breaks down at a critical height (region b); below the ride height where the maximum downforce is reached, the flow massively separates and the downforce is reduced (region c).
Figure 3: Lift coefficient of the double element wing as function of dimensionless ride height (Zhang and Zerihan, 2003)
Another paper from Southampton University (Kuya et al., 2009) investigated the implementation of vortex generators for separation control on the suction side of the wing in ground effect. Counter-rotating and co-Counter-rotating configurations of vortex generators were tested: the former suppresses flow
8
separation at the centre of each device pair whereas the latter induces horseshoe vortices between each device, where the flow is separated.
In recent years, aerodynamics of wings in ground effect has been investigated in realistic on-track conditions, including roll, yaw and immersion in the wake of a leading car. It was found that small roll angles (< 3°) can increase downforce and small yaw angles (< 5°) cause a small decrease in downforce and increase in drag; on the contrary, a wing operating in wake flow suffers from a significant reduction in downforce (Correia, 2016).
1.1.4 Experiments on Scale Models and Real Vehicles
The overall features of vehicle aerodynamics are often measured and analysed by means of scale-model testing, to limit fan power requirements and running costs. These savings allow car manufacturers to invest in advanced testing techniques, such as “adaptive wall technology”: the shape of the test section automatically changes in response to the pressure measured along the tunnel walls, in order to reduce the so-called “blockage effect” (McBeath, 2006).
However, experimental research on vehicle aerodynamics does not confine itself to studying simplified scale models: the very first example of full-scale wind tunnel dedicated to real vehicle investigations was built in 1939, near Stuttgart, under the direction of W. Kamm. Low-blockage test section and high velocity flow are advantageous for the development of fast vehicles, for instance race cars, even when Reynolds number effects are no longer expected (Hucho et al., 1998).
1.1.5 The Role of CFD in Vehicle Aerodynamics
While the advent and progress of the computer industry, computational fluid dynamics (CFD) began to support wind tunnel testing. The increasing success of CFD is prompted by some of its interesting peculiarities. CFD solution of the physical-mathematical model is almost always faster and cheaper than experimental testing; moreover, in CFD, all non-dimensional quantities can be exactly matched, while experiments generally try to match the Reynolds Number regime (Linfield and Mudry, 2008).
One of the areas where CFD has reached its highest peak is motorsport: on the one hand, aerodynamic simulations are crucial for designing and developing increasingly fast vehicles; on the other hand, the extreme research of performance in motor racing is the catalyst behind the development of sophisticated and reliable numerical procedures and innovative Computer Aided Design (CAE) tools. Looking at the Formula 1 experience during the period from 1990 to 2010, simulations evolved from the inviscid panel method to 1 billion cell calculations of entire cars, including analysis of transient behaviour and overtaking (Hanna, 2012). Nowadays CFD and wind
9
tunnels are used together in a synergic iterative process where one technique fills the gaps left by the other: in fact, in certain areas, computed and measured results may differ and it is not clear which provides the best real-world results (Linfield and Mudry, 2008). As witnessed by the Swiss Formula 1 team Sauber Motorsport AG, the CFD technology is applied in many stages of the car development: early concept phase, engine and brake cooling, single component design and complete system design and interactions (Larsson et al., 2005).
From the point of view of the required computational resources, the complexity of the geometry and the resulting numerical issues, the simulation of realistic open-wheeled cars is really challenging. For this reason, F1 teams, car manufacturers and researchers often rely on commercial software that provide user-friendliness, flexibility and reliability: the longer you spend time on pre-processing and debugging, the lesser you can focus on design and physics comprehension. Examples of these studies can be found in the following papers by Perry and Marshall (2008), Larsson (2009) and Chandra et al. (2011): in the first two works, ANSYS software package is used to investigate the impact of 2009 FIA technical regulations on the aerodynamic performance of F1 cars, while the last work puts in evidence the capability of StarCCM+ tools in the managing of complex surfaces, including overlapping edges, non-manifold surfaces, holes, and gaps. The use of commercial packages is worthwhile in the case of complicated procedures, such as aerodynamic optimization, which require reliable algorithms (Zaya, 2013) and interaction between different softwares (Lombardi et al., 2009).
In addition to CFD commercial solutions, there are open-source codes able to execute both the meshing phase and the fluid dynamic calculation: one of the most popular is OpenFOAM®. This free-license tool is successfully used and developed by academic researchers (Nebenführ, 2010) and automotive industries (Islam et al., 2009) in order to predict the aerodynamic performance of road cars. However, due to some criticalities connected to meshing accuracy and numerical stability, it is not widespread in high level motorsport applications.
1.2 Overall Plan
The preliminary stage of the work consists in understanding the basics of diffuser-equipped blunt bodies and inverted wings in ground effect: both were tested at different ride heights and diffuser angles/angles of attack. In this respect, experimental data from Loughborough and Southampton University were taken into account, in order to validate drag and lift coefficients provided by incompressible RANS-type simulations. Some important conclusions were obtained: the k-ωSST turbulence model provides better predictions of blunt body flow fields; conversely, the Spalart-Allmaras (S-A) model produces more accurate results when applied to slender bodies. From a
10
numerical point of view, the coupled solver was found to be faster and more reliable than the segregated one, at the expense of greater computational effort. From a physical point of view, the qualitative results of the simulations put in evidence typical three-dimensional vortical structures characterizing the behaviour of downforce generating devices and other fluid-dynamic phenomena such as separation in adverse pressure gradient and viscous effects.
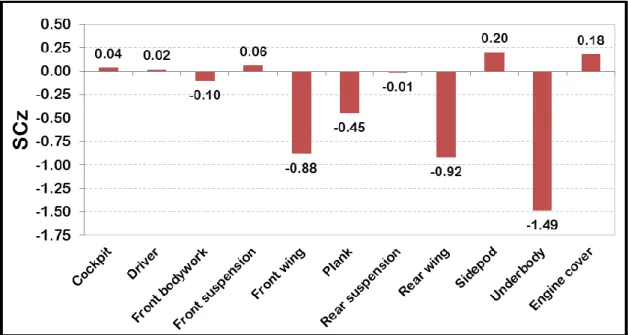
The next step of the research is devoted to applying the above described learnings on numerical modelling to a realistic open-wheeled racing car: the 2017 F1 vehicle designed by ©PERRINN was designated for this purpose. Despite some geometrical simplifications related to internal flows, the 3D model maintained all the features and the details characterizing its external aerodynamics. The complexity of the geometry made it necessary to develop a complex and reliable CFD procedure, including CAD cleaning, surface and volume mesh automatization, simulation setup and post-processing. The S-A turbulence model provided the best matching with the reference performance coefficients provided by ©PERRINN: drag, downforce, front balance and efficiency predictions were calculated with less than 10% margin of error. The study of the single components showed that front and rear wing contribute more or less to a quarter of total downforce each; the remaining percentage is attributable in large part to the underfloor. The latter component, consisting of step plane, plank and diffuser, was found to be very efficient, due to the use of Venturi and ground effects. The tyres are the mains source of pressure drag, whilst the rear wing is the main responsible for induced drag. The post-processing activity showed that production of axial vorticity is one of the most important mechanisms for generation of downforce: in this respect, the front wing plays a key role in controlling the downstream flow.
The second step of the PERRINN F1 car analysis was to investigate the influence of front and rear ride height on aerodynamic performance. The simulation outputs demonstrated that small setup modifications (within a range of 15 mm on the front and 10 mm on the rear), lead to substantial downforce improvements and increase in front balance (> 5%) at the cost of negligible extra-drag. Lower front ride height allows the front wing to better exploit the benefits of ground effect, whilst a parallel increase in rear ride height leads to a greater area ratio of the underfloor. To sum up, increase in rake angle results in higher values of downforce and front balance, so long as the flow underneath the car does not separate because of the adverse pressure gradient.
After analysing the ©PERRINN F1 car under ideal operating conditions, the focus was shifted to its aerodynamic behaviour in slipstream. This particular off-design circumstance is really common during a race and heavily influences driveability and safety. Two vehicles were tested at four different distances in order to evaluate the performance losses affecting the following car. The results of the tandem-running simulations testified that 2017 Technical Regulations did not resolve
11
the controversial issue of overtaking. In proximity to the leader, the following car loses more than half of the overall downforce and is subjected to a serious increase in front balance, undermining braking effectiveness and vehicle stability in high-speed corners. Also, the approach to the leader is difficult, because running in wake flow weakens the performance of the following cars over long distances (> 20 m). Unfortunately, the benefits resulting from drag reduction on long straights are not able to counterbalance the above described criticalities. Looking deeper into the performance results, it can be noted that the front wing suffers much less than other aerodynamic devices from working in slipstream: rear wing performance constantly deteriorate during the approach phase, while the underfloor evidences an abrupt downforce loss in close proximity to the lead vehicle. The qualitative analysis of the results confirmed that the following car is fed by low-energy, rotational flow, whose streamlines diverted from the original direction: therefore, most of the axial vortical structures responsible for the generation of downforce are heavily weakened.
At this point, the research moved to a higher level: efforts focused on aerodynamic development of the baseline vehicle, for the purpose of improving aerodynamic performance both in freestream and wake flows by means of cheap, targeted and readily applicable changes. Different devices were designed, tested and integrated on the car: in light of the previous results, the front wing was modified in accordance with the 2017 Technical Regulations, whilst underfloor, rear wing and other bodywork components underwent several adjustments: some of them are inspired by the past, while others are completely original, thus constituting the most relevant contribution to the current state-of-the-art. Three different aerodynamic configurations were obtained, in order to meet the performance requirements of low, medium and high-downforce tracks. All three new aerodynamic packages simultaneously improved efficiency and downforce of the original car: the low-downforce vehicle (F1UR4LD) is characterized by the highest efficiency (+13% compared to the baseline), while the high-downforce layout (F1UR4HD) enhanced the level of available downforce by 48%; the medium-downforce vehicle (F1UR4MD) is instead a compromise solution between the above described configurations.
The analysis of the conceived vehicles in freestream was followed by a detailed performance evaluation in wake flow. In fact, the main goal of the new aerodynamic configurations was to make current F1 cars safer and more performing in slipstream. All the considered advanced layouts proved to be more robust than the baseline in terms of downforce loss; nevertheless, low and medium downforce vehicles, as well as the first version of the car, suffer from unacceptable front balance variations. The high-downforce vehicle, instead, showed much better performance than the original one: when the distance from the lead car is about 2.5 m, the front balance increase goes from +20% to +14%, the downforce loss from 53% to 39% and the efficiency loss from 30% to
-12
22%. The results are even better for greater distances, making the approaching phase much easier: when the distance between the two vehicles is about 5.5 m, the downforce loss goes from 44% to -25%, the front balance increase from +34% to +12% and the efficiency loss from -30% to -13%. At a distance of about 11 m, the downforce loss goes from -25% to -12%, the front balance increase from +20% to +5% and the efficiency loss from -13% to -6%.
These encouraging results can be attributed to specific features of the design. The entire bodywork was equipped with several aerodynamic add-ons, in order to achieve a more uniform distribution of the downforce sources. The underbody was made more suitable for working with low-energy and chaotic flow, by means of specific devices restoring the low-pressure cores on the bottom of the car (vortex generators at the step plane inlet and a convergent guide vane in correspondence of the diffuser). In addition, the above described devices have the important function of narrowing the underbody wake in span direction. The interaction between the new three-element rear wing and the supplementary beam wing enhances the diffuser extraction, preventing flow separation; apart from that, the new rear wing assembly, in cooperation with tyre ramps and T-wings, shields the following car against the underbody low-energy flow by means of a strong upward deflection: as a consequence, the resulting wake is very short. To summarize, a narrow and short wake ensures that clean and high-energy flow is able to fill the gap between the two vehicles and reach the following car more easily.
Besides the slipstream off-design condition, racing cars are continually exposed to direction changes. During cornering the flow is not perfectly aligned with the car, generating the so-called sideslip angle: in racing applications its value is similar to the tyre slip angle (5°÷8°). The baseline vehicle and the three new configurations were tested in the above described conditions so as to evaluate their capability of providing adequate aerodynamic performance and measure the newly generated side force. To stress the vehicles in critical circumstances, high values of sideslip angle (10° and 20°) were set up in the numerical simulations. At worst, the downforce decrease related to the new aerodynamic configurations is about 10%, whereas the original car is subject to a 15% loss in vertical load. Most importantly, the cornering stability of the new vehicles can benefit from a constant or decreasing front balance. The monitoring of the side force indicated that its magnitude increases in parallel with the sideslip angle and the downforce level of the vehicle, up to 24% of the total drag. A deeper analysis of the results put in evidence the asymmetrical behaviour of the vehicle: the left and the right sides of the car are characterized by different values of front balance, provided that the respective centres of pressure tend to align with the freestream flow.
The last part of the research is not CFD-oriented but aims at evaluating the track performance of the new developed vehicles. OptimumLap, a free-software developed by the American company
13
©OptimumG, was used to perform lap-time simulations on different circuits of the F1 World Championship: making use of a quasi-steady-state point mass vehicle model, it was possible to match every track with the most suitable aerodynamic configuration. The model setup includes general vehicle data, aerodynamic coefficients, engine map, gear ratios and tyre parameters. With a few exceptions, it was found that performance of current F1 cars are “grip limited” rather than “power limited”: as a consequence, the best aerodynamic setup usually requires high levels of downforce in most of the considered tracks. At last, some of the most characteristic circuits were analysed in detail to evidence the influence of downforce on braking performance, lateral and longitudinal acceleration, cornering speed and top speed.
15
Chapter 2. Understanding the Basics of Racing Car Aerodynamics
The main purpose of this preliminary research is to assess the capability of OpenFOAM in predicting aerodynamic performance of blunt and slender devices for automotive and motorsport applications such as a diffuser-equipped blunt body and a F1 single element front wing in ground effect. Reynolds Averaged Navier-Stokes (RANS) simulations were carried out at different values of ride height and diffuser angle (α)/angle of attack (AOA): predictions of integral quantities such as drag (CD) and lift (CL) coefficients were validated against the available set of experimental data from Loughborough and Southampton Universities.
Pressure and velocity equations arising from the incompressible flow assumption were solved both with segregated and coupled approach, in order to achieve the best possible matching with experimental results in almost all cases of ground clearance (h) and diffuser angle.
The k-ωSST turbulence model was chosen for simulating the blunt body aerodynamics, owing to its documented capabilities in predicting this type of fluid flow. Concerning the front wing simulations, both k-ωSST and S-A turbulence models were employed and compared with each other.
2.1 Geometrical Features
The first step of the procedure consists in the virtual modelling of both the diffuser-equipped blunt body and the front wing. These CAD models are replicas of the wind tunnel bodies used for the experiments at Loughborough and Southampton University, respectively. Shape and dimension of the models under consideration are depicted in Figures 4 and 5.
The blunt body looks like a rectangular hexahedron: it is 0.8 m long, 0.4 m wide and its height is 0.31 m. The frontal area is characterized by bevels, whose radius is 0.064 m, in order to avoid massive premature flow separation. The diffuser region covers 25% of the body length, and it is bounded by 0.0125 m thick endplates (Jowsey and Passmore, 2010).
The wing is a component from the Tyrrell 026, the car with which the Tyrrell Formula One team competed in the 1998 Formula One season (Zerihan and Zhang, 2000). Chord and spanwise length are 0.2234 m and 1.1 m respectively, thus leading to an aspect ratio of about 4.9.
16
Figure 4: Blunt body model: a) technical drawing (Jowsey and Passmore, 2010) and b) 3D CAD model of the blunt body
Figure 5: Wing model: a) 3D CAD model and b) drawing of the front wing (readjustment of image from Kuya et al., 2009)
17
2.2 Simulation Tools
The 3D CAD models need to be converted in STereoLithography format, in order to be processed by the OpenFoam meshing tool. The meshing utility, called SnappyHexMesh, allows for a non-graphical, fast and flexible procedure for every kind of geometry, especially in external aerodynamics applications. On the other hand, an untrained user might experience some difficulties in controlling layer addition and complex surface edges, due to serious issues of cell skewness and non-orthogonality. Thus, for a CFD beginner, grid generation by means of commercial software products might be easier to handle.
The fluid dynamic calculation was performed by means of OpenFOAM®: the choice fell on the most popular open-source CFD code, in order to facilitate the repeatability of the simulations and fill the gap between academic and industrial research, which often relies on commercial softwares. The software package is composed by a series of C++ libraries divided in two families: solvers and utilities (Nebenführ, 2010). Many degrees of freedom are available in the case setup: the user can decide time and space discretization schemes of the Navier-Stokes equation terms as well as the choice of the solver for each variable.
Both meshing and calculations were carried out using Galileo, the Italian Tier-1 cluster for industrial and public research, available at CINECA SCAI. The meshing processes were executed by means of 1 computational node, which is composed by 16 cores (8GB/core); the calculations were instead performed using 2 nodes.
2.3 Diffuser-Equipped Blunt Body
2.3.1 Mesh and Simulation SetupThe entire domain is about 6.5 times the length of the body. Height and width of the mesh comply with the size of the working section of the Loughborough University wind tunnel (1.92 x 1.32 m2), in order to replicate the experimental conditions. The distance between the inlet and the frontal face of the body is about 1.5 times the body length (L). The outlet of the virtual wind tunnel was located well downstream the body (about 4 times the body length), so that atmospheric pressure could be reasonably imposed (Figure 6a). A few tests at the lowest ride height (28 mm) and the highest diffuser angle (13°) have been carried out to study the influence of side wall boundary condition on final results: the use of slip rather than wall condition did not alter the predictions of drag and lift coefficients. Therefore, the slip condition was chosen for the entire simulation set because allows us to save memory and CPU time in comparison to a boundary layer discretization. Moreover, since the ground of the wind tunnel was fixed, a boundary layer profile was imposed at the inlet section
18
matching the published experimental values (Figure 6b). Table 1 summarizes the experimental conditions required to properly define the numerical setup (Jowsey and Passmore, 2010).
Figure 6: Mesh and inlet setup: a) midspan slice of the blunt body mesh and b) inlet boundary layer profile
The first mesh contained about 16 million cells. The height of the first cell at solid surfaces and the expansion ratio of the adjacent layers were 0.5 mm and 1.2, respectively, so as to obtain an average y+ value in the first cell of about 30. In stagnation regions, such as the frontal area of the body, and in fully separated region, e.g. the rear base area, y+ falls well below the average value. On streamlined surfaces, such as the underbody and the upper bodywork, the first cell is placed in the boundary layer log-law region (y+ > 30). This mesh was refined around the body and behind it, to grasp the features of the wake flow and the ground boundary layer. Particular attention was given to the underbody and diffuser exit regions. The total CPU time for mesh creation, calculated as the product of the real-time and the number of required processors, was about 7.5 hours.
The chosen turbulence model was the k-ωSST (Menter, 1994) with high-Reynolds number wall treatment. Two turbulence variables are introduced: the turbulent kinetic energy (k) and the specific dissipation rate (ω). In short, this turbulence model is intended to offer the best of k-ω and k-ε models: it behaves like the k-ω model in the inner part of the boundary layer, and like the k-ε in the outer part close to the freestream. The performance of the low-Re option was also assessed: the increase in the computational effort due to mesh refining at the wall was not counterbalanced by
19
any accuracy improvement, since CD and CL predictions were very similar to those obtained from the high-Re approach. Thanks to the data reported in Table 1, it was possible to set the inlet turbulence variables according to the formulas written in Table 2. The turbulence length scale (lt) was assumed to be the diameter of the largest vortex in the flow, namely the height of the blunt body. Use of shorter inlet turbulence length scales, and hence higher values of ω, showed negligible differences in the results.
Symbol Parameter Value
Air density 1.165 kg/m3
L Characteristic length (body length) 0.8 m
U∞ Freestream velocity 40 m/s
Re(L) Reynolds number 2.27 x 10⁶
Turbulence intensity 0.15%
Boundary layer thickness 0.06 m
Displacement thickness 0.0094 m
Momentum thickness 0.0055 m
Table 1: Experimental data necessary to setup the numerical simulation of the blunt body - data from Loughborough University (Jowsey and Passmore, 2010)
Symbol Turbulent Variable Formula Value
k Turbulent kinetic energy 3 2(Iu∞)
2 ≈ 0.005 m2 /s2
Specific dissipation rate 2.35√k
lt ≈ 0.5 1/s
Table 2: Inlet turbulence variables of the k-ωSST model – blunt body case
The simple algorithm (Semi-Implicit Method for Pressure-Linked Equations) available in OpenFOAM® was chosen, because it is suitable for incompressible, steady, turbulent flows (https://openfoamwiki.net). The GAMG (Geometric Algebraic Multi Grid) solver was employed for the pressure equation, whilst smoothSolver was used with velocity and turbulence variables. Approximately, the initial 500 iterations were executed with 1st order discretization whereas the remaining iterations were executed with 2nd order schemes. Gradient, divergence and Laplacian terms of the Navier-Stokes equations (written in differential form) were discretized by means of the Gauss scheme; at cell interfaces, the chosen interpolation scheme was linear (centred or upwind). Depending on the quality of the mesh, it is possible to select enhanced versions of the
above-20
mentioned schemes both for scalars and vectors. The chosen convergence criteria were the following: the scaled pressure residual had to be lower than 10-5 and aerodynamic coefficients had to remain reasonably stable (± 1% in the last 200 iterations).
A 3x3 simulation pattern was carried out: each of the three diffuser angles (7°, 10°, 13°) was tested in three different ride heights (28 mm, 36 mm, 44 mm). Experimental and numerical data were compared in terms of drag and lift coefficients. Moreover, the same simulation pattern was replicated both with segregated and coupled solver, keeping the same turbulence model. On average, the CPU times required by segregated and coupled methods to reach convergence were 13.5 and 11 hours, respectively: every pseudo time-step executed by the coupled solver required more computational effort, but a smaller number of iterations were needed to complete the simulation. Mesh sensitivity was performed on the following cases: 13° - 44 mm and 13° - 28 mm. Two meshes with similar structure were tested, but with different levels of refinement (24.6 vs 16.5 million cells). Since drag and lift coefficients did not substantially change, the coarsest mesh was used for running the simulations.
2.3.2 Aerodynamic Performance
Once the most appropriate mesh has been established, every k-ωSST RANS simulation, performed with the segregated solver (seg.), was replicated with the coupled solver (cou.) and numerical outputs (num.) were compared to the experimental results (exp.). As shown in Tables 3, 4 and 5, the accuracy of predictions consistently improved, in particular in the most critical cases, i.e. low ground clearance and large diffuser angle: coupled calculations had average percentage error (e%) well below 5%, except for the 10° - 28 mm case.
28 mm
exp. num. e %
seg. cou. seg. cou.
7° CD 0.36 0.33 0.37 8.7 2.7 CL -0.69 -0.72 -0.72 4.3 4.3 10° CD 0.38 0.36 0.40 5.4 5.1 CL -0.87 -0.97 -0.95 10.9 8.8 13° CD 0.39 0.37 0.41 5.3 5.0 CL -0.99 -1.14 -1.00 14.1 1.0
21
36 mm
exp. num. e %
seg. cou. seg. cou.
7° CD 0.36 0.31 0.36 14.9 0 CL -0.64 -0.64 -0.64 0 0 10° CD 0.37 0.34 0.38 8.5 2.7 CL -0.80 -0.86 -0.84 7.2 4.9 13° CD 0.38 0.35 0.39 8.2 2.6 CL -0.95 -1.05 -0.94 10.0 1.1
Table 4: Results of the blunt body simulations, h = 36 mm
44 mm
exp. num. e %
seg. cou. seg. cou.
7° CD 0.35 0.31 0.35 12.1 0 CL -0.58 -0.58 -0.57 0 1.7 10° CD 0.36 0.32 0.36 11.8 0 CL -0.73 -0.76 -0.75 4.0 2.7 13° CD 0.37 0.34 0.38 8.5 2.7 CL -0.88 -0.94 -0.89 6.6 1.1
Table 5: Results of the blunt body simulations, h = 44 mm
Looking at the lift coefficient results of the 13° cases, the accuracy of the segregated method got worse as the ground clearance got smaller; on the contrary, the coupled method was found to be reliable at every ride height.
In Figure 7 the centre line pressure coefficient (CP) distribution is plotted versus the non-dimensional body length (x/L), varying the ride height at fixed angle. In all cases the matching between numerical results and experimental data underneath the body is very good. Two peaks of negative relative pressure can be seen. The first minimum, which is located at x/L ≈ 0.05, is due to the acceleration of the freestream flow at the entrance of the gap between the ground and the body; the second one, located at x/L = 0.75, is caused by suction around the diffuser.
22
Figure 7: CP as a function of x/L: a) α = 13°, h = 28 mm; b) α = 13°, h = 36 mm; c) α = 13°, h = 44 mm
23
The value of the second minimum of pressure is the main difference among the three cases: despite the diffuser angle is the same (13°), a smaller ground clearance determines a higher diffuser area ratio and, consequently, higher downforce, as long as there is no massive separation inside the diffuser.
In all three cases, slight discrepancy can be observed between experimental and numerical data at the diffuser exit (x/L=1): the k-ωSST RANS simulations overestimate the diffuser pressure recovery and, as a consequence, the base pressure of the blunt body at mid-span. In spite of this, the numerical predictions of CD and CL are really close to experimental measurements.
Figure 8 illustrates the streamwise velocity field at midspan. Some typical zones can be identified. The wake is in the same order of magnitude as the body height and occupies the base region: the value of the base pressure is the main cause of blunt body drag. At the leading edge the flow separates and generates a recirculation bubble on the body roof, leaving an enlarged boundary layer downstream. Right below the wake, there is the flow region identified by the diffuser extraction. If the associated boundary layer has enough kinetic energy to overcome the adverse pressure gradient, the flow remains attached to the diffuser surface; otherwise it separates and affects the performances of the underbody in terms of both drag and downforce.
Ahead of the stagnation area, a horseshoe vortex starts to envelop the body, as can be seen in Figures 9a, 10 and 11. Comparing the cases with same ground clearance and different diffuser angle, one can see how, increasing diffuser angle, the anticipated near-ground separation forces upward the flow coming from the diffuser, thereby shrinking the wake in the base region. Comparing the cases with same diffuser angle and different ground clearance, it can be observed that, for bigger ride heights, the extent of the rear wake is larger where the diffuser extraction is weaker. These two observations put in evidence that the fluid dynamic structures connected with downforce (flow coming from the underbody) interact with those linked with drag (wake in the base region).
More details about the wake can be observed in Figure 9b: the pressure contours show two cores of low-pressure behind the body. The streamlines confirm that the wake consists of two recirculation bubbles: the clockwise one comes from the upper side of the body whereas the counter-clockwise one derives from the upswept flow at the diffuser outlet. Moreover, the displacement induced by the diffuser flow can be noticed when looking at the upper streamline.
24
Figure 8: Streamwise velocity field at midspan: a) 7°, 28 mm; b) 7°, 44 mm; c) 13°, 28 mm; d) 13°, 44 mm
25
The rear views of the body show noteworthy axial vortices: Venturi vortices, strictly connected with the generation of downforce, and the horseshoe vortices, linked with the ground proximity of the body. Both axial vorticity (Figure 10) and Q-criterion (Figure 11) are useful for visualizing these structures. The iso-surfaces of the variable Q [1/s2], the second invariant of the velocity gradient tensor, are good indicators of turbulent flow structures.
Figure 9: Pressure contours and streamlines at midspan (13°, 28 mm): a) Underbody inlet detail, b) Base region
The Venturi vortices begin to develop at the diffuser inlet because of the pressure difference between the underbody and the region at the side of the diffuser itself. They increase their energy along the diffuser sidewall and survive downstream of the diffuser. Close to every main vortex there is a secondary counter rotating structure due to the interaction with the ground boundary layer. As shown by the streamwise vorticity contours, a bigger diffuser angle translates into a larger diameter of the Venturi vortices. The horseshoe vortices start from the stagnation area and envelop the body. The smaller the ground clearance, the more persistent the horseshoe vortices: in the 28 mm cases, these material tubes continue to exist beyond the rear of the body, whereas in the 44 mm cases they breakup near the entrance.
After describing the global features of the flow, attention was focused on the diffuser region affected by the Venturi vortices: for a better understanding of this physical phenomenon, the case at lowest ride height and larger diffuser angle (13° - 28 mm) was used as an example. Figure 12 (pressure coefficient versus non-dimensional body length) and Figure 13 (plots of streamwise and spanwise velocity) refer to a longitudinal slice at 80% of the half width of the body.
26
Figure 10: Axial vorticity in three cross sections (x/L=0.6, 0.95, 1.3): a) 7°, 28 mm; b) 7°, 44 mm; c) 13°, 28 mm; d) 13°, 44 mm
27
Figure 12 shows that the pressure profile on the diffuser surface (x/L > 0.75) is bumpy and irregular as a symptom of unsteadiness. Looking at the two peaks of negative relative pressure, it can be noted that the one located at x/L = 0.05 is weaker than its counterpart at midspan (-1.5 versus -1.85 in Figure 7a), whilst the other minimum at the beginning of the diffuser (x/L = 0.75) maintains more or less the same value of its counterpart at midspan (about -1.6) thanks to the Venturi vortex that keeps the underbody flow confined.
As highlighted in Figure 13, this vortex starts at the beginning of the diffuser and develops while converting streamwise velocity into spanwise velocity. The coloured streamlines of Figure 14 illustrate the above mentioned three-dimensional vortical flow field.
Figure 11: Iso-contours of Q coloured with streamwise velocity: a) 7°, 28 mm; b) 7°, 44 mm; c) 13°, 28 mm; d) 13°, 44 mm
28
Figure 12: CP as a function of x/L - slice at 80% of the half width of the body
Figure 13: Slice at 80% of the half width of the body: a) streamwise velocity field; b) spanwise velocity field
29
Figure 14: Streamlines coloured with streamwise velocity (case: α = 13°, h = 28 mm) in different views: a) front-bottom view, b) rear-bottom view, c) rear-side view, d) side-bottom view
2.4 Front Wing
2.4.1 Mesh and Simulation Setup
The mesh in streamwise direction is 2.4 m long. The leading edge of the wing lies 0.65 m from the inlet (about 3 times the wing chord, c). The distance between the trailing edge and the outlet patch is about 1.5 m (about 7 times the wing chord). As in the previous case, width and height of the volume mesh comply with the size of the working section of the Southampton University wind tunnel (2.1 x 1.5 m2), where experiments had been performed. See Figure 15 for more details.
30
Figure 15: Mesh of the wing: a) external boundaries and b) midspan slice of the volume mesh
Five refinement regions were defined: special care was taken to the volume between the suction side of the wing and the ground. The first cell height on the wing surface was 0.6 mm (about 2.5 x 10⁻³ times the wing chord): this value led to an average y+ value of about 30. As in the previous case, the leading and trailing edge regions are characterized by lower values of y+. The total amount of cells was about 11 million. The total CPU time for mesh creation was about 5 hours. The experimental wind tunnel had a moving ground: as a result, there was no boundary layer imposed at the inlet section. Basically, the boundary conditions of the front wing case were the same as previously described: the only differences concerned the uniform inlet velocity and the moving ground. In light of previous tests, slip condition was imposed on the side walls of the virtual wind tunnel. All the data necessary to model the wing and fix the boundary conditions are summarized in Table 6. As confirmed by many papers in the published literature, the k-ωSST model is suited for predicting blunt body aerodynamic features. This might not be always true dealing with slender body aerodynamics. Another turbulence model, i.e. S-A, was considered for comparison. The S-A model is based on an additional equation including the turbulent eddy viscosity. It was developed for aerospace applications and aerodynamic flows (Spalart and Allmaras, 1992). It usually shows a good behaviour for boundary layer in adverse pressure gradient, even though it is not calibrated for general industrial flows.
Table 7 summarizes the inlet turbulent variables, both for the k-ωSST and S-A model. The turbulence length was assumed to be of the same order of magnitude of the wing chord. Algorithms, equation solvers and the entire numerical setup were the same as those used in the blunt body simulations.
A 2x4 simulation pattern was carried out: each of angle of attack (1°, 5°) was tested in four different ride heights (40, 50, 70, 100 mm). Experimental and numerical data were compared in terms of CD and CL. This group of simulations was aimed at comparing the results of k-ωSST to the ones from
31
the S-A model. On average, S-A simulations reduced the CPU time by about 40% as compared to the k-ωSST ones (5.5 vs 9 hours), because S-A model has one less equation to solve and requires less iterations to get convergence.
A mesh sensitivity analysis was carried out with 5° - 40 mm case and S-A model. Two mesh sizes were tested, focusing on the refinement box between the body and the ground and the region downstream of the trailing edge.
Symbol Parameter Value
Air density 1.209 kg/m3
c Chord 0.2234
U∞ Freestream velocity 30 m/s
Re(c) Reynolds number 0.45 x 10⁶
I Turbulence intensity < 0.2%
Table 6: Experimental data necessary to setup the numerical simulation of the wing - data from Southampton University (Zerihan and Zhang, 2000)
Symbol Turbulent Variable Formula Value
k Turbulent kinetic energy 3 2(𝐼𝑢∞)
2 ≈ 0.003 m2 /s2
Specific dissipation rate 2.35√𝑘
𝑙𝑡 ≈ 0.5 1/s 𝑣̃ Turbulent viscosity (S-A) √3
2 𝐼𝑢∞𝑙𝑡 ≈ 0.012 m 2
/s
Table 7: Inlet turbulence variables of the k-ωSST and S-A model – wing case
Experiments were performed in conditions of fixed (fi.) and free (fr.) transition. In the former case, the switchover from laminar to turbulent boundary layer was induced by a strip located at 10% of the chord on both surfaces of the wing; in the latter case, the boundary layer became turbulent without any external forcing. Since the CAD model of the wing had no strips and, to the authors’ knowledge, OpenFOAM® does not easily allow the transition point to be fixed on the wing, the numerical results had to be compared with the free transition experimental outputs (Zerihan and Zhang, 2001).
32 2.4.2 Aerodynamic Performance
The wing was tested at four different ride heights (40, 50, 70, 100 mm) and two values of AOA (1° and 5°). Tables 8 and 9 summarize the results in terms of drag and lift coefficients.
1° CL fi exp CL fr exp CL num k-SST CL num S-A CD num k-SST CD num S-A e% fr k-SST e% fr S-A 40 mm -1.12 -1.42 -1.30 -1.36 0.068 0.082 8.82 4.32 50 mm -1.08 -1.25 -1.25 -1.26 0.064 0.078 0.00 0.80 70 mm -0.98 -1.08 -1.13 -1.11 0.058 0.072 4.52 2.74 100 mm -0.88 -0.95 -1.00 -0.98 0.054 0.067 5.13 3.11
Table 8: Results of the wing simulations, AOA = 1°
5° CL fi exp CL fr exp CL num k-SST CL num S-A CD num k-SST CD num S-A e% fr k-SST e% fr S-A 40 mm -1.36 -1.84 -1.58 -1.62 0.116 0.132 15.20 12.72 50 mm -1.38 -1.73 -1.64 -1.59 0.105 0.123 7.19 8.43 70 mm -1.34 -1.54 -1.48 -1.47 0.093 0.113 3.97 4.65 100 mm -1.27 -1.38 -1.36 -1.33 0.087 0.105 1.46 3.69
Table 9: Results of the wing simulations, AOA = 5°
In six out of eight cases (ride heights from 50 to 100 mm), the S-A and k-ωSST are essentially equivalent in terms of drag and lift coefficients. The S-A model works better than k-ωSST when the ground clearance is very small (40 mm) and, as a consequence, both the adverse pressure gradient on the suction side of the wing and the acceleration of the flow between the wing and the ground are very high: this feature could probably make the S-A model better than the k-ωSST model in typical cases of motorsport applications, such as high cambered wings. Other benefits of the S-A model are related to its numerical features: it is very stable and typically requires a smaller number of iterations than the k-ωSST model to reach convergence.
Figure 16 shows the longitudinal velocity field at midspan for four combinations of angle of attack (1°, 5°) and ground clearance (40, 100 mm). Predictions from S-A are shown on the left whereas results from k-ωSST are depicted on the right. The wing in ground effect behaves almost like a
33
converging-diverging nozzle, in which the walls are made up of the suction side of the wing and the ground itself. The variations of ride height and angle of attack contribute to change the area ratio of this “nozzle” and therefore the features of the flow: when the angle of attack increases and the ground clearance gets smaller, the area ratio of the nozzle becomes larger.
Reduction in ground clearance causes higher flow acceleration and, consequently, lower pressure. This results in more downforce and more drag, because of the reduced pressure insisting on the rear suction side of the airfoil. Moving from 1° to 5° angle of attack, the effects are similar to those just described here. When the ride height is very low and the angle of attack is high, separation and recirculation of the flow on the suction side of the wing occur (see negative longitudinal velocity in 5° - 40 mm case). When angle of attack increases but the ground clearance is high, the separation of the flow is much less pronounced.
The differences between the two models in terms of drag and lift coefficients are confirmed by qualitative results: k-ωSST underestimates lift coefficient because is less resistant to flow separation than S-A in extreme conditions (5° - 40 mm). This might be the reason why the drag coefficient calculated by k-ωSST is smaller than the one calculated by S-A model. Looking at the velocity contours, it can also be noted that an earlier separation does not allow the flow to reach high speed on the suction side of the wing, compromising the generation of downforce.
Figures 17 and 18 refer to the wake generated by the wing in the following operating conditions: 1° - 50 mm, 1° - 100 mm. These combinations of AOA and ride heights are particularly interesting because numerical outputs can be compared with experimental results (Zhang and Zerihan, 2002). While moving along the X-axis, and thus away from the trailing edge, the wake is getting shorter in chord-wise direction and thicker in Y-direction, because of the viscous dissipation of the wake structures. Lower ride height leads to deeper wakes in X-direction, because the flow on the suction side of the wing is subjected to a stronger adverse pressure gradient. S-A and k-ωSST turbulence models predicted comparable velocity profiles, consistently with the fact that also the global performance coefficients are similar in these combinations of AOA and ride height (see Table 8). Both the turbulence models slightly overestimate the size of the wake both in X and Y-directions.
34
Figure 16: Streamwise velocity field at midspan: a) S-A, 1°, 40 mm; b) k-ωSST, 1°, 40 mm; c) S-A, 1°, 100 mm; d) ωSST, 1°, 100 mm; e) S-A, 5°, 40 mm; f) ωSST, 5°, 40 mm; g) S-A, 5°, 100 mm; h)
35
Figure 17:Mean flow wake profiles at midspan (1° - 50 mm) at different distances from the wing leading edge: a) x/c = 1.5; b) x/c = 2; x/c = 3
36
Figure 18:Mean flow wake profiles at midspan (1° - 100 mm) at different distances from the wing leading edge: a) x/c = 1.5; b) x/c = 2; x/c = 3
37
Both the longitudinal vorticity contours (Figure 19) and the iso-surfaces of Q-criterion (Figure 20), have been computed using the S-A model. Figure 19 shows two axial vortices detaching from the wing side plate: both depend on the difference of pressure between the region outside the plate and the wing itself. The biggest vortex is located on the suction side of the wing, the smallest one on the pressure side. When the ride height is lower, a secondary counter rotating vortex can be identified between the suction side vortex and the ground. Figure 20 supports the previous observations and shows two-dimensional flow separation on the suction side of the wing in 5° - 40 mm case.
Figure 19: Axial vorticity in two cross sections at trailing edge and at half chord from trailing edge – S-A model: a) 1°, 40 mm; b) 1°, 100 mm; c) 5°, 40 mm; d) 5°, 100 mm
38
Figure 20: Iso-contours of Q coloured with streamwise velocity (S-A model): a) 5°, 40 mm; b) 5°, 100 mm
As in the blunt body investigation, the attention focused on the region near the endplates, where the flow is highly three-dimensional and characterised by tip vortices. The 5° - 40 mm case was chosen for this purpose. Figure 21 shows the comparison between two pressure coefficient profiles: the former calculated at midspan (Z/Zmax = 0), the latter at 80% of the half span (Z/Zmax = 0.8). Looking at the minima of relative pressure at x/cax = 0.2, where cax is the axial chord, one can see that the wing generates less downforce near the endplates, due to the presence of the tip vortices that equalize the pressure on both the sides of the wing. On the other hand, as indicated by Cp values at the trailing edge, it seems that the tip vortex on the suction side helps to prevent flow separation in adverse pressure gradient.
The streamwise velocity contours in Figure 22 confirm that the wing section at midspan is characterized by higher acceleration and earlier separation of the flow than the section near the endplate.
39
Figure 21: CP versus x/cax: comparison between midspan (Z/Zmax = 0) and slice at 80% of the half
span (Z/Zmax = 0.8)