APUSS APUSS
Università degli studi di Roma
“Tor Vergata”
Facoltà di Ingegneria
Tesi di Dottorato in Ingegneria Ambientale
XVII° CICLO
“Analysis and Application of Novel Method for Quantifying
Infiltration and Exfiltration in Urban Sewer Systems”
INDEX
CHAPTER 1 THE PROBLEM... 11
1.1 WHY SHOULD WE MEASURE THE INFILTRATIONS? ... 11
1.2 WHY SHOULD WE MEASURE THE EXFILTRATIONS? ... 12
1.3 SEWER PIPE DETERIORATION... 15
1.3.1FACTORS AFFECTING THE STRUCTURAL STATE OF SEWER SYSTEM... 16
1.3.2SEWER DETERIORATION MODELLING... 20
1.4 DIAGNOSTIC TECHNIQUES ... 24
1.5 REFERENCES... 31
CHAPTER 2 NOVEL METHODS FOR QUANTIFYING THE INFILTRATION AND THE EXFILTRATION IN URBAN SEWER SYSTEMS ... 35
2.1 INTRODUCTION... 35
2.2 METHODS FOR QUANTIFYING THE EXFILTRATIONS... 36
2.2.1QUEST ... 36
2.2.2QUEST-C ... 38
2.2.3HYDRODYNAMIC BACKGROUND OF QUEST AND QUEST-C... 40
2.2.3.1 Tracer Transport ... 40
Near-Field and Vertical Mixing ...45
Mid-Field and Transverse Mixing ...50
Far-Field and Longitudinal Mixing...56
2.2.3.2 Confluences ... 63
2.2.4APPLICATION ADVECTION-DISPERSION (AD) MODEL TO QUEST AND QUEST-C ... 68
2.2.5SAMPLING AND MEASUREMENTS... 70
2.2.5.1 Choice of the tracer ... 70
2.2.5.2 Mass of tracer to be dosed... 70
2.3 METHODS FOR QUANTIFYING THE INFILTRATIONS ... 72
2.3.1ISOTOPIC METHOD... 72
2.3.2POLLUTOGRAPH METHOD... 73
2.3.2.1 Isotopic method ... 75
Environmental stable isotopes ...75
Physical, chemical and biological fractionations ...77
Hydrograph separation...87
2.4 REFERENCE... 90
CHAPTER 3 EXPERIMENTAL DESIGN AND FIELD APPLICATION... 94
3.2 EXPERIMENTAL DESIGN... 94
3.3 QUEST... 100
3.3.1DETAILED UNCERTAINTY ANALYSIS... 103
3.3.1.1 Preparation ... 104 3.3.1.2 Field application ... 105 Dosage ...105 Adsorption ...105 Transport...105 Conductivity measurements...106 Data reduction...107
Error propagation for the detailed uncertainty analysis...107
3.3.2RESULTS OF DETAILED UNCERTAINTY ANALYSIS... 109
3.4 QUEST-C... 126
3.5 ISOTOPIC METHOD... 127
3.6 POLLUTOGRAPH METHOD... 128
3.6.1PRELIMINARY CAMPAIGNS... 128
3.6.2CALIBRATION AND INFILTRATION ASSESSMENT... 130
3.7 REFERENCES... 133
ANNEX 1 - GIULIANELLI, M.; PRIGIOBBE, V. (2004). INFILTRAZIONE DI ACQUE DI FALDA NELLE FOGNATURE. L’ACQUA, 6, PP. 41-50. ... 134
ANNEX 2 - CARDOSO, A.; PRIGIOBBE, V.; GIULIANELLI, M.; BAER, E.; COELHO, S.T. (2005). ASSESSING THE IMPACT OF INFILTRATION AND EXFILTRATION IN SEWER SYSTEMS USING PERFORMANCE INDICATORS: CASE STUDIES OF THE APUSS PROJECT. 10TH INTERNATIONAL CONFERNCE ON URBAN DRAINAGE, COPENHAGEN, DENMARK, 21-26 AUGUST 2005... 135
ANNEX 3 - GIULIANELLI, M.; MAZZA, M.; PRIGIOBBE, V.; RUSSO, F. (2003). ASSESSING EXFILTRATION IN A URBAN SEWER BY SLUG DOSING OF CHEMICAL TRACER (NACL). PROCEEDING OF A WORKSHOP ORGANIZED BY NATO ARW ON ENHANCING URBAN ENVIRONMENT, ROME, ITALY, NOV. 5-9, 2003... 136
ANNEX 4 - PRIGIOBBE, V.; GIULIANELLI, M. (2004). EXPERIMENT DESIGN OF A NOVEL METHOD TO ASSESS EXFILTRATION IN SEWER. CONFERENCE ON URBAN DRAINAGE MODELLING, DRESDEN, 15TH-17TH SEPTEMBER 2004. ... 137
ANNEX 5 - RIECKERMANN, J.; BAREŠ, V.; BRAUN, D.; KRACHT, O.; PRIGIOBBE, V.; GUJER, W. (2004). ASSESSING EXFILTRATION FROM SEWERS WITH DYNAMIC ANALYSIS OF TRACER EXPERIMENTS. 19TH EUROPEAN JUNIOR SCIENTIST WORKSHOP “PROCESS DATA AND INTEGRATED URBAN WATER MODELLING” FRANCE 11-14 MARCH 2004. ... 138
ANNEX 6 - PRIGIOBBE, V.; GIULIANELLI, M. (2005). APPLICATION OF A NOVEL METHOD FOR ASSESSING THE INFILTRATION IN AN URBAN SEWER SYSTEM: CASE OF STUDY IN APUSS PROJECT. PROPOSED FOR WATER SCIENCE AND TECHNOLOGIES. ... 139 ANNEX 7 - FURTHER ENCLOSED ARTICLES ... 140
TABLE INDEX
TAB. 1.3-1:FACTORS AFFECTING THE STRUCTURAL STATE OF SEWER PIPE... 17
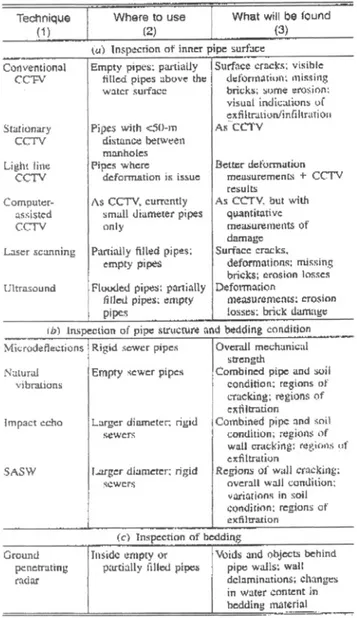
TAB. 1.4-1: HOW TO USE DIAGNOSTIC TECHNIQUES BY (MAKAR,1999)... 30
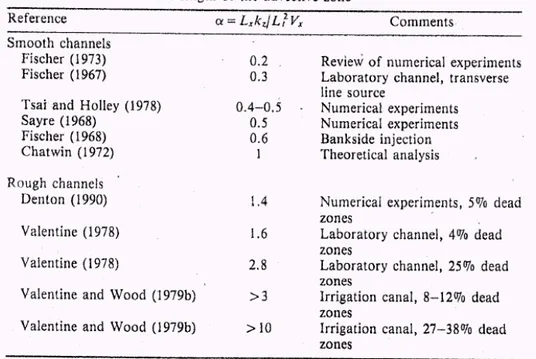
TAB. 2.2-1: ESTIMATES OF THE LENGTH OF THE ADVECTIVE ZONE (RUTHERFORD,1994). ... 59
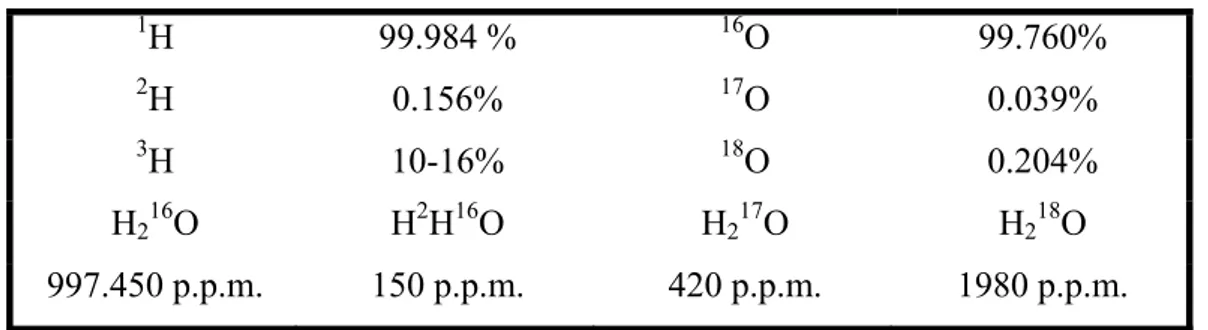
TAB. 2.3-1: ISOTOPIC ABUNDANCE OF HYDROGEN, OXYGEN AND WATER. ... 76
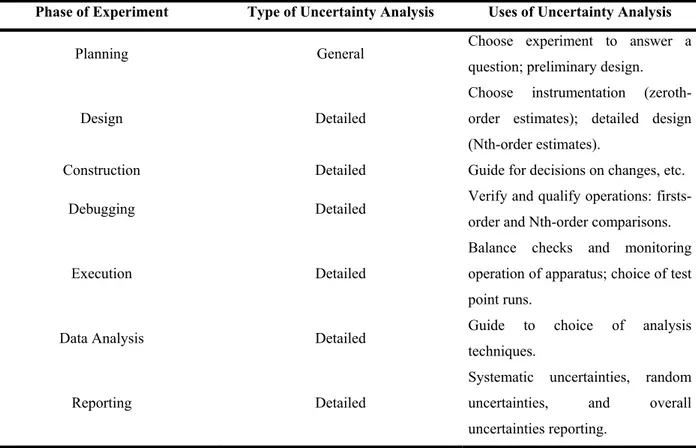
TAB. 3.2-1:UNCERTAINTY ANALYSIS IN EXPERIMENTATION (MODIFIED FROM COLEMAN AND STEELE,1999) ... 98
TAB. 3.3-1: SOURCES OF UNCERTAINTY FOR EACH VARIABLE IN EQUATION EQ. 3.3-1.R: RANDOM ERROR;S: SYSTEMATIC ERROR... 104
TAB. 3.3-2:VALUES OF THE ERRORS OCCURRING DURING THE QUEST METHOD APPLICATION... 110
TAB. 3.3-3:CHARACTERISTIC OF THE QUEST EXPERIMENTS. ... 110
TAB. 3.6-1INFILTRATION RATIO [-] AND RATE [L S-1] CALCULATED AFTER CALIBRATION OF THE MEASURED COD DATA WITH CALIBRATION CURVE 1. ... 132
FIGURE INDEX
FIG. 1.3.1:PPIS FOR INFILTRATION (LNEC,2003)... 23
FIG. 1.3.2:PPIS FOR INFILTRATION (LNEC,2003)... 24
FIG. 1.4.1:IMAGE BY GRC THAT ALLOWED TO SEE AN ILLICIT CONNECTION (HTTP://WWW.NODIG.IT)... 26
FIG. 1.4.2:SCHEME OF OPERATION AND RESULTS BY FELL-41(WWW.METROTECH.COM). ... 26
FIG. 1.4.3:IMAGES RECOVERED THAT HIGHLIGHT DAMAGES OR ILLICIT DISCHARGES THIS WAS CARRIED OUT BY A SONIC DISTANCE MEASUREMENT, IT IS EVIDENT THE REDUCTION OF WALL THICKNESS BECAUSE OF CORROSION (PRICE,1995). ... 27
FIG. 1.4.4:THE IMAGE REPORTS A COLLAPSED SEWER (WRC,1983). ... 28
FIG. 1.4.5:IMAGES RECOVERED THAT HIGHLIGHT DAMAGES OR ILLICIT DISCHARGES.C. THIS WAS CARRIED OUT BY SSET, THE INFILTRATION AT JOIN AND THE DAMAGES WERE DETECTED (ABRAHAM ET AL.,1997). ... 29
FIG. 2.2.1:CONCEPTUAL SCHEME OF THE QUEST METHOD (MODIFIED AFTER RIECKERMANN AND GUYER,2002) ... 37
FIG. 2.2.2:GRAPH OF CONDUCTIVITY AND FLOW RATE VS. TIME.THE PEAKS NUMBER 1,2,4 AND 5 ARE THE REFERENCE SIGNALS; THE PEAKS NUMBER 3 AND 6 ARE THE INDICATOR SIGNALS. ... 37
FIG. 2.2.3:SCHEME OF TRACER DOSAGE AND SAMPLING OF QUEST-C METHOD (MODIFIED FROM RIECKERMANN ET AL., 2003B). ... 39
FIG. 2.2.4:CONCENTRATION PROFILE DOWNSTREAM FROM A STEADY POINT SOURCE (FROM RUTHERFORD,1994). .. 48
FIG. 2.2.5:CONCENTRATION PROFILES DOWNSTREAM FROM A STEADY TRANSVERSE SOURCES (FROM RUTHERFORD, 1994)... 49
FIG. 2.2.6:CONCENTRATION PROFILES DOWNSTREAM FROM A STEADY TRANSVERSE SOURCES (FROM RUTHERFORD, 1994)... 54
FIG. 2.2.7:COMPARISON OF RATE OF MIXING FOR DIFFERENT VELOCITY AND DISCHARGE RATIO FOR:(A) CONCORDANT BED CONFLUENCE AND (B) DISCORDANT BED CONFLUENCE (FROM BIRON ET AL.,2004). ... 65
FIG. 2.2.8:RATE OF MIXING FOR CONCORDANT AND DISCORDANT BED CONFLUENCES FOR JUNTION ANGLE OF 30,60 AND 90°(FROM BIRON ET AL.,2004)... 65
FIG. 2.2.9:MIXING OF FLUID FROM EACH TRIBUTARY AT BAYONNE-BERTHIER CONFLUENCE INDICATED BY CONTOURS OF ELECTRICAL CONDUCTIVITY VALUES FOR:(A) LOW FLOW CONDITION AND (B) HIGH FLOW CONDITION; LETTERS CORRESPOND TO POSITION INDICATED IN INSET; VERTICAL EXAGGERATION 7.0(FROM BIRON ET AL.,2004)... 66
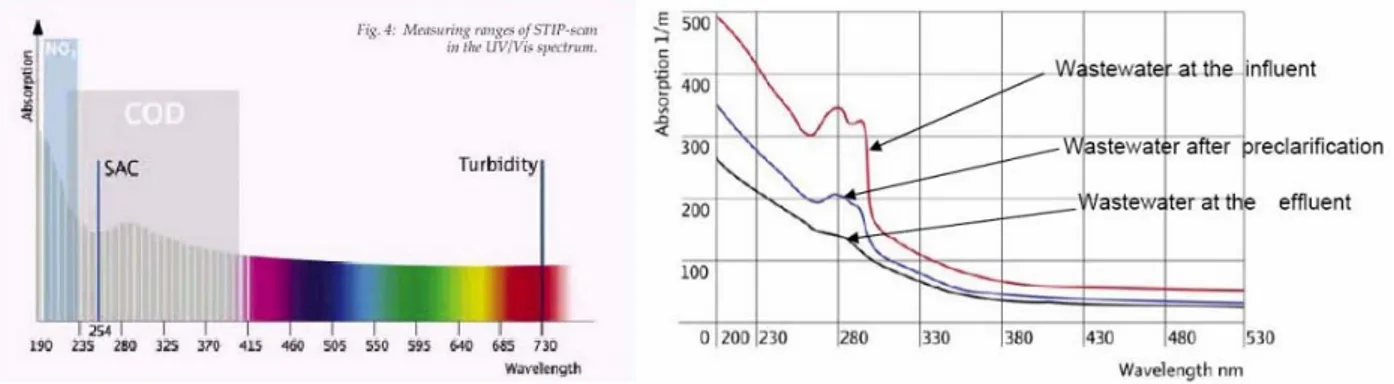
FIG. 2.3.1:ABSORPTION SPECTRA IN THE RANGE UV-VIS OF WASTEWATER. ... 75
FIG. 2.3.2:SPECTROMETER USED DURING THE EXPERIMENTS IN ROME (TRADE: S::CAN).IT IS 506 MM HIGH AND ITS DIAMETER IS 44 MM... 75
FIG. 2.3.3:RELAZIONE TRA L’ENERGIA POTENZIALE E LA DISTANZA INTER-ATOMICA PER ISOTOPI PESANTI E LEGGERI DI UNA MOLECOLA.L’ENERGIA DI DISSOCIAZIONE DIFFERISCE PER I DUE ISOTOPI, E INFLUISCE SULLE VELOCITÀ DI REAZIONE, QUINDI SUL FRAZIONAMENTO ISOTOPICO (FROM CLARK &FRITZ,1997). ... 79
FIG. 2.3.4FRACTIONATION FACTORS Α VS. TEMPERATURE (FROM CLARK &FRITZ,1997) ... 80
FIG. 2.3.5(FROM KENDALL AND MCDONNELL,1998) ... 83
FIG. 2.3.6(FROM KENDALL AND MCDONNELL,1998) ... 84
FIG. 2.3.8 SCHEMATIC ATTENUATION OF SEASONAL ISOTOPE VARIATIONS IN RECHARGE WATERS DURING
INFILTRATION THROUGH THE UNSATURATED ZONE AND MOVEMENT WITHIN THE SATURATED ZONE AND THE
CRITICAL DEPTH (FROM CLARK &FRITZ,1997) ... 86
FIG. 3.3.1:CORRELATION BETWEEN THE MEASURED FLOW RATE AND THE AREA OF THE REFERENCE PEAKS... 101
FIG. 3.3.2:CALIBRATION CURVE.THE CONDUCTIVITY VALUES WERE CORRECTED WITH THE INITIAL CONDUCTIVITY OF THE WASTEWATER SAMPLE.THE CALCULATED CALIBRATION COEFFICIENT IS 0.0006[GR NACL*L-1/µS*CM -1]. ... 102
FIG. 3.3.3: SYSTEM USED FOR DOSING THE TRACER SOLUTION. ... 105
FIG. 3.3.4:RIGHT: EGG-SHAPED CROSS SECTION OF THE INVESTIGATED REACH.LEFT: MIXING LENGTH VS. WATER DEPTH... 106
FIG. 3.3.5:LINEAR REGRESSION OF THE BASELINE FOR NON-OVERLAPPING PEAK QUEST METHOD (RED LINE) AND DEFINITION OF THE START AND END OF THE PEAK (PINK DOT LINE). ... 108
FIG. 3.3.6:ARCHITECTURE OF THE ROUTINES FOR ERROR PROPAGATION WRITTEN IN R-SCRIPT ENVIRONMENT. ... 108
FIG. 3.3.7:CONDUCTIVITY PEAKS IN GREEN LINE THE REFERENCE ONES AND THE INDICATOR ONE IN RED LINE. ... 110
FIG. 3.3.8:CONDUCTIVITY AND FLOW RATE DATA OF THE EXPERIMENT 030710T AND THE EXFILTRATION HISTOGRAM AFTER THE ERROR PROPAGATION.REFERENCE PEAKS (GREEN LINES),INDICATOR PEAKS (RED LINES), FLOWRATE (BLUE LINES);EXFILTRATION HISTOGRAM FOR A SAMPLE SIZE OF 10,000... 111
FIG. 3.6.1: S::CAN COVERING... 129
FIG. 3.6.2:PRELIMINARY COD MEASUREMENTS. ... 129
FIG. 3.6.3:COD MEASUREMENTS AFTER CHANGING SAMPLING MANHOLE AND CLEANING PROCEDURE... 130
FIG. 3.6.4:COD TIME SERIES FOR CALIBRATION OF THE SPECTROMETER... 131
FIG. 3.6.5:COD FROM LABORATORY VS.COD FROM SPECTROMETER AND CALIBRATION CURVES. ... 131
FIG. 3.6.6HYDROGRAPH SEPARATION OF THE FLOWS IN INFERNETTO.IN RED THE WASTEWATER FLOW RATE AND IN GREEN THE INFILTRATION FLOW RATE... 132
MOTIVATION
This dissertation presents the results of an experimental research carried out in collaboration with the Water Research Institute of the National Research Council (IRSA-CNR) and the University of Rome “Tor Vergata”. That research has been developed within the framework of the European research project APUSS (Assessing Infiltration and Exfiltration on the Performance of Urban Sewer Systems) which partners were INSA de LYON (FR), EAWAG of Zurich (CH), Technological University of Dresden (DE), Faculty of Civil Engineering at University of Prague (CZ), DHI Hydroinform company in Prague (CZ), Hydroprojekt company in Prague (CZ), Middlesex University of London (UK), LNEC in Lisbon (PT), Emschergenossenschaft in Essen (DE) and IRSA-CNR in Rome (IT). That European project was supported by the European Commission under the 5th Framework Programme and it aimed at contributing to the implementation of the Key Action “Sustainable Management and Quality of Water” within the Energy, Environment and Sustainable Development Contract n° EVK1-CT-2000-00072.
APUSS project was also part of CityNet, a network of European research projects on integrated urban water management.
The scientific aim of the research project was to develop new methods for quantifying infiltration and exfiltration in urban sewer networks (i.e., pipes and house connections) and new models for forecasting the sewer reaches likely affected by infiltration and exfiltration. The infiltrations (parasitical waters infiltrated into a sewer) and the exfiltrations (wastewater leakages from a sewer) occur when the sewer pipes are not watertight anymore because of their structural damages. Both infiltration and exfiltration can seriously threat the surface and depth water bodies in an urban area. Although the problem is quite known and several methodologies already exist for quantifying I/E (Infiltration/Exfiltration), such methodologies are often time consuming, expensive and affected by high uncertainty. Thus, the motivation of the APUSS project was to develop speedy and more accurate methods as well as models for planning strategically the sewer rehabilitation. In particular, IRSA-CNR had to apply the methods developed by EAWAG in Rome in order to assess the applicability in urban areas and reliability of the results.
The entire study is summarized in this thesis. It started with a literature review about the causes of infiltration and exfiltration (I/E) in urban sewer systems, the several factors found out to be responsible of sewer deterioration could help in listing the criteria for individuating the urban areas where applying the new methods. Before applying the proposed methods, an experimental design has been done identifying the main sources of errors. Then application was
carried out in two urban areas in Rome and the collected data were analyzing with error propagation techniques.
Finally, considerations about the speediness and the uncertainty could be done.
Acknowledges
Since the beginning of this research, several people and institutions have been collaborating and I want to thank them individually:
• Technicians of IRSA-CNR: Salvatore Tatti and Maurizio Ronda;
• Diploma students of University “Tor Vergata”: Umberto Cascetti, Michela Mazza, Giuseppe Di Giulio, Tiziano Cingolani, Silvia Grappone and Agnese Ricci;
• ACEAATO2 S.p.A;
• Municipality of Rome with Dipartimento alle Politiche della Programmazione e Pianificazione del Territorio, Ufficio Pianificazione e Progettazione Generale: dott. Claudio Succhiarelli;
• IGAC-CNR;
INTRODUCTION
The thesis is divided into three chapters.
The first one deals with the theoretical aspects of the subject: what the infiltration and exfiltration mean and, as they threaten the urban water environment; the causes of structural sewer deterioration and the traditional sewer diagnostic techniques.
The second chapter deals with the new methods developed in APUSS project and, an accurate analysis of the theoretical aspects behind them is presented. In particular, tracer transport models in surface water bodies are discussed for the exfiltration methods and, hydrograph separation approach in hydrology as well as water isotopes are discussed for the infiltration methods.
The third chapter introduces the methodology used for the uncertainty analysis applied for the experimental design of the methods. Finally, the results of the experiments are shown and discussed.
CHAPTER 1
The Problem
1.1 Why should we measure the infiltrations?
The infiltration of parasitical water in a damaged sewer system can cause the inefficiency of the integrated system sewer-wastewater treatment plant. The impact upon the sewer is mainly due to transport of fine grains into the pipe that settling on the bottom reduce the cross area available as well as removing support around the pipe determine a less mechanical resistance of the backfilling. The impact upon urban surface water bodies is due to both the dilution of the pollutant concentrations into the wastewater stream causes serious problems at different stages within a WasteWater Treatment Plant (WWTP) if the infiltrations were unknown when that plant was build, and the rise of frequency of the combined/separated sewer overflows that can cause discharges of untreated wastewater into natural water bodies. Untreated wastewater can be deliver to the urban environment not only the known chemical and biological pollutants, but also numerous pharmaceutical and organic contaminants recently recognized as pollutants of increasing concern (Halling-Sorensen et al., 1998; Daughton and Ternes, 1999; Ayscough et al.,
2000; Jorgesen and halling-Sorensen, 2000; Dietrich et al., 2002; Heberer, 2002; Kolpin et al., 2004; Weigel et al., 2004).
Although the effect of the inefficiency of a damaged sewer characterized by high amount of infiltration can be checked at the wastewater treatment plants and at CSOs discharges, the individuation of the most damaged part of a network can be done only monitoring directly the system. Such an approach has been used by the European research project APUSS which principal aim has been to develop two methods for quantifying infiltration by measuring continuously the concentration of typical wastewater pollutants.
1.2 Why should we measure the exfiltrations?
Exfiltration of wastewater from damaged sewer systems transport into the surrounding environment organic and inorganic pollutants dangerous for the human health.
Groundwater is the main source of potable water, nevertheless the use of urban groundwater is a serious challenge because of the severe anthropogenic pressure on it. As a matter of the fact, actually the principal groundwater sources are in the rural areas, but because of the increasing demand of water and the over-abstraction in the those areas, urban groundwater is getting an important potable water source. Consequently, worldwide a lot of researches are studying which pollutants are discharged from urban activities (industry, landfill, septic tank, sewer leakages, etc…) into the aquifers, which behaviour those pollutants have in the subsurface, how they can threat the human healthy, how they can be detected and then removed from groundwater or even from the aquifer itself. However, a natural protection of the groundwater quality is generally assumed, t is called “purification capacity” due to the unsaturated zone, but such capacity changes according to the sediment and hydrological characteristics of the aquifer (Rettinger et al., 1991).
The risk of contamination of soil and groundwater is especially high when wastewater, containing high concentrations of toxic chemicals, pathogenic bacteria for humans, and highly persist viruses, leaks from sewer (Dizer et al., 1985; Filip at al., 1986; Milde et al., 1987). When a pollutant does not vary its chemical and physical characteristics going through an aquifer, it could be considered an indicator of occurring exfiltration.
Since eighties, different approaches have been using for investigating the groundwater contamination by wastewater leakages, and the first studies were carried out in Germany, United
Kingdom and USA. The adopted methodology was the quality aquifer characterization and when such studies were approached one of the most important aspect to be defined was the sampling procedures. Generally, several monitoring-wells were built up and water samples were taken by suitable sampling system. The reliability of the collected data principally depended on the monitoring-well building criteria (e.g., deepness and extension of the abstraction section, location) and the sampling technique (e.g., by means of pump or multi layer sampler). (Ronen et al., 1986).
Rettinger et al. (1991) carried out an interesting study by building up a 10 m test pipe at 0.85 m below the ground and 5 m above the groundwater level and around the rig, which was parallel to groundwater flow, six monitoring wells were installed. The vertical spatial variation of: Na+, NO3-, HCO3-, SO42-, Dissolved Organic Carbon, Dissolved Oxygen, K+ and Zn- was
detected by means of multi-layer samplers based on the dialysis cell technique (Ronen et al., 1986). Only the first five parameters above showed high concentrations and high variability. Such a variability was only evident by multi-layer sampler which use, together with the ratio between the sewer leakage flow and the contaminated groundwater flow, and the dissolved oxygen in the contaminated groundwater, is important when the purification soil capacity has to be assessed.
Powell et al. (2003) studied the impact of sewer leakages on sandstone aquifers (confined and unconfined) detecting sewer-derived bacteria (E.coli, faecal streptococci and sulphide-reducing clostridia) and viruses (entoroviruses, Norwalk-like viruses, adenovirus, rotavirus, astrovirus). The aim of their study was to determine the deepness of the penetration of these sewer-derived microorganisms in Permo-Triassic sandstone aquifer underlying the city of Birmingham and Nottingham. The results proved that the microbiological contamination by sewer leakages in this kind of soil is not reduced by adsorption, filtration and inactivation. Indeed the aquifer thickness was entirely contaminated (90 m below the ground level) by the bacteria which concentration varied with the deepness; among these the sulphide-reducing clostridia bacteria were found to have a very long resistance in an aquifer and then to be indicator of sewer leakages in the past. The aquifer thickness was also contaminated by Virus, which presence could not be correlated to the bacteria. They hypothesized that the local aquifer features, which might affect the microorganism transport (averagely estimated 1 m/day) and survival, are: temperature, rain events and soil heterogeneities. Sometimes the component of groundwater flow responsible for long distance transport does not reflect the main hydraulic property, and beyond every expectation tens of meters far away from the leaking sewer the microorganisms could be found.
Concerning virus transport and survival, Bhattacharjee et al. (2002) developed a two dimensional models for virus transport in physically and geochemically heterogeneous subsurface porous media, considering the removal by attachment, release and inactivation by temperature. They estimated that: (i) in physical layered heterogeneous porous media the preferential transport is altered when geochemical heterogeneity is considered; (ii) under randomly heterogeneous hydraulic conductivity can provide preferential pathways; while high variation of heterogeneous geochemistry results in a slower transport; (iii) about the breakthrough behaviour the important parameters are: patches available for deposition; inactivation rate constant.
Dizer and Hagendorf (1991) analyzed the groundwater quality in an aquifer under leaking sewer, in particular they considered the physiological groups of microorganisms like: general aerobic bacteria, amylolytic bacteria, denitrifying bacteria, actinomycetes and fungi. Some of them are autochthonous microorganisms at different trophic levels which react rapidly as the substrate concentration changes and mostly of them (i.e., anaerobic bacteria as sulphate-reducing and denitrifying ones) are in the aquifers under urban areas where situation like low oxygen and high organic matter concentrations may occur. They found that denitrifying bacteria, actinomycetes and fungi were more abundant in wastewater contaminated samples than in uncontaminated ones, and the distributions of Total Organic Carbon, COD and total Nitrogen in the sewer leakages were similar to the denitrifying bacteria, actinomycetes and fungi thus the microbiological response seemed to be consistent with the substances aided to the soils from exfiltrations.
Barrett et al. (1999) applied a multi-component investigation in Nottingham (UK) in order to identify the different sources of recharges of groundwater (drinking water, wastewater and precipitation). The measured parameters were chosen among those defined as markers (i.e., easily analysed solute that is unique to one water source and pathway, at a constant concentration in the source and is non-reactive in all conditions, these kind of substances is rare and has to be identified carefully). In the shallow groundwater they found out a set of wastewater markers:
15N, total coliform, E.coli, faecal streptococci, d-limonene. 15N allowed them to distinguish the
different recharges, and where the groundwater showed an enrichment of 15N they considered it due to wastewater contaminations. d-limonene (C10H16) recently used as an aromatic scenting
agent in domestic cleaning products as a speciality solvent. Nevertheless, none of the considered markers could be absolute indicators because of the die-off of microorganisms, the mixing and the fractionation (principally during denitrification) of 15N and the not constant presence of
As a conclusion of the results of the research presented above, since bacteria and viruses can penetrate into the groundwater and persist for a long period the microbiological approach for the exfiltration investigation should be an useful tool. Neverthless uncertainty remains about:
• the real and actual source of contamination (e.g., septic tanks or sewer); • the sewer reach damaged which wastewater comes from;
• the actual sewer state, because such a markers could mean an old contamination by exfiltration phenomena occurring in the past.
Thus it might be more accurate to use conservative tracers directly added into running sewer pipes in well known network part and time for quantifying directly the water losses (Ellis, 2001). Such an approach has been used by the European research project APUSS which principal aim has been to develop two methods for quantifying exfiltrations by dosage of chemical conservative and non-buoyant tracers into running sewer reaches.
1.3 Sewer pipe deterioration
About this topic a literature review was done and published in an Italian journal:
Giulianelli, M.; Prigiobbe, V. (2004). Infiltrazione di acque di falda nelle fognature. L’ACQUA, 6, pp. 41-50.
The motivation of the study of the main factors affecting the sewer state arise from necessity to locate suitable urban sewer where carrying out the experimental activities. The initial questions were:
• which characteristics are to be considered as important ones for a sewer to be tested;
• which grade of spatial heterogeneity these characteristics can have;
• how we can suppose two sewer systems to have a different state of deterioration; • which informations we are able to gathered from the authorities of Rome.
The urban characteristics taken into account were established on the basis of the factors that in an urban area can affected the state of sewer network as well as those that are actually used for predicting the sewer deterioration and planning the rehabilitation.
In the next chapter is presented a brief review about: the sewer deterioration factors, the approaches for the sewer deterioration forecasting and the sewer diagnostic techniques.
1.3.1 Factors affecting the structural state of sewer system
The deterioration of sewer system causes the pipes to be not watertight anymore; consequently, infiltrations of parasitical water (e.g., groundwater, leakage from water system, …) and exfiltrations can occur.
The sewer damages can be divided in two groups (Gokhale and Graham, 2004):
• structural defects that include cracks, fractures, joint displacement, deformation and collapse;
• operational damages that include root intrution, siltation and blockage. The roots can cause structural damage as well as the opening of joints, while siltation can lead to blockage which in turn can cause excessive pressure in the system, and producing leakages.
For an detailed knowledge of sewer deterioration, the sewer should be considered as a composite structure consisting of: the pipe itself (geometry, material, use, etc…), the ground in which it is buried, and the local environment.
The principal factors that affect the state of sewer pipes were studied by several researchers and a summary of such factors is shown in Tab. 1.3-1.
Davies et al. (2001A) provide an exhaustive review focused on the features that have been recognized as influencing the structural stability of rigid pipes. Davies et al. (2001B) carried out a statistical investigation using logistic regression analysis for the individuation of restricted data set of variables describing the sewer network state; they found out that there were some variables that can help determining the risk of collapse of sewer as:
• sewer pipe section length; • sewer size;
• sewer use;
• backfilling soil properties; • sewer location;
• local groundwater regime; • sewer material;
• traffic load, mainly the bus load; • sewer depth.
Moreover, the infiltration and the exfiltration (principally in hydraulic surcharge regime) are recognized as important causes of loss ground surrounding the pipes, reducing the backfilling soil mechanical resistance (WEF/ASCE,1994; Serpente, 1994; WRc, 2001), since the loss of ground into a defect of pipes can result in the formation of voids or zones of low density adjacent soil to the sewer, which permit progressive deformation of defective sewer (WRc, 2001).
Tab. 1.3-1: Factors affecting the structural state of sewer pipe.
FACTORS COMMENTS Construction factors
Load transfer From cars, buses, others
Standard workmanship It is one of the principal cause of collapses for a lot of authors.
Sewer size
There are a lot of conflicting opinions about relationship between diameter and fractures. O’Reill et al. (1989) concluded that the incidences of cracks increases with diameter.
Sewer depth The effect decreases up to a depth of 5.5 m, but beyond 5.5 m the defects begin increasing with depth (O’Reill et al., 1989). Sewer bedding The bedding and surrounding material determine the
distribution of the loads over a pipe. The rate of exfiltration (Rauch and Stegner, 1994) and infiltration (Fenner, 1991) are sensitive to this factor.
Sewer material For example, clay sewer provides excellent corrosion protection in comparison with concrete ones.
Sewer joint type and material
The rubber seals used for flexible joints are more vulnerable to corrosion due to the soil than the pipe itself.
Sewer pipe section length
Fenner (1990) reported that a potential point for infiltration is the joint, and as longer individual sewer pipes, less joints per unit of sewer length, then less infiltration could go in the system.
Connections The connections of houses represent one of the principal point of infiltration and exfiltration (Ellis, 2001)
Local external factors
Surface loading and surface use
General static and dynamic loads, maintenance works of infrastructures, etc… For example the load of traffic that is not important itself, but the characteristic of the road pavement and bedding material have greater influence on the load transfer (O’Reill et al., 1989). Furthermore the construction traffic is another important load contribution.
Water mains bursts and leakage
Ground disturbance
For example differential settlements of soil during the first years and afterwards. Davies et al. (2001B) found that sewers laid in fracture potential soils (as clay) are at lower risk than sewer constructed in other soil. Anyway, it is to be considered that sewer are build in trenches that could reduce the ground disturbances.
Groundwater level
The water flows into or out the sewer, infiltration and exfiltration, respectively, promote the ground loss around the pipes (see below).
Ground condition The shrinkage and/or swelling of the soil under different temperatures produce various stress on the pipes.
clay soil-backfill than in chalk and sand one (O’Reill et al., 1989).
Root intrusion The roots can break the sewer walls as well as open the joints.
Other factors
Sewage characteristics
Wastewater can be corrosive, in particular if it is characterized by: pH<5.5, Sulphate>200 mg/L and CO2>0.23
mg/L*carbonate hardness for concrete and asbestos cement (WSA/FWR,1993). Davies at al. (2001B) estimated that separated sewer can more likely be damaged than combined one.
Inappropriate
maintenance method
The cleaning by means of pump jetting can erode the inner sewer wall
Age of sewer
It is not the age itself, principally, but the period of construction according to the historical and technological development.
Sediment friction
An interesting analysis is given by WRc (2001) which is based on a comparison among the effects of sewer defect size, hydraulic surcharge, groundwater level with water depth and soil type on ground loss. The worst situation is for a submerged sewer with severe defects, laid in a sandy fine sand or fine sand subjected to frequent high magnitude hydraulic surcharges; whereas one of the best picture is a non-submerged sewer with small defects, laid in a medium to high plasticity clays never subjected to hydraulic surcharges. The location of the experimental areas in Rome has been done on the basis of this analysis, and the investigated sewer systems (called Torraccia and Infenetto) were chosen because one was supposed to represent the best situation (Torraccia) and the worst situation (Infernetto).
Finally, Fenner (2000) identified some informations to be collected for completely characterizing an urban sewer systems, those information can support the decision for a strategic rehabilitation planning. They are divided in three groups: physical attributes, data by field visits and other. In particular:
1. the key physical attributes are: levels cover manhole, pipe sizes, invert levels of incoming and outgoing pipes and pipe material;
2. data by field visits: condition of manholes, overall integrity of the manhole structure, degree of tree roots, silt and evidence of surcharge levels;
3. other: pipe shape, function/location/condition of the upstream catchment, hydraulic load and frequency surcharge, drift/underlying geology, groundwater level, traffic and surface loadings, age and construction techniques, event history and frequency of CSO operation, years since last inspection as well as previous maintenance and rehabilitation history.
Even though all these informations are useful when multi-parametric models are used for assessing and forecasting the urban sewer state, gathering them is a very cost effective work, then the infomations’ colletion should be only concentrated on those parts of the sewer asset that are at most risk from a likely future failure.
A brief description of some models developed so far for sewer deterioration assessment in order to plan a prioritizing interventions is given in the following paragraph.
1.3.2 Sewer deterioration modelling
The functionality of the sewer system includes hydraulic, environmental and structural aspects, and for a good performance of the system the operators should provide an efficient rehabilitation planning. The urgency of sewer rehabilitation reflects the criterion used for classifying the damaged reaches in a priority way for the renovation, tools for the optimization of sewer rehabilitation can be summarized in three points (Baur, 2003):
1. development of a rehabilitation strategy;
2. selection of cost-efficient rehabilitation projects;
3. choice of the most appropriate rehabilitation technology for the selected projects.
While for understanding how the researchers approached at pipe deterioration modelling, it is profitable to know how they have studied the water pipe deterioration. Although recently more efforts have been done on improving the quality of this infrastructure, there are several old sewer systems whose there are not historical data about the their deterioration, but only the collapse of sewer pipes have been recorded over the years. Nevertheless, some historical failure records for water pipes have been available, and on these cases researchers can develop models for forecasting pipe deterioration.
Kleiner and Rajani (2001A and 2001B) wrote a comprehensive review about the models used for quantifying the structural deterioration of water mains by analysing historical performance data. Such models are divided in two groups: physical and statistical.
The physical models are scientifically more robust because consider the real loads supported by the pipe and its mechanical resistance, but because they needed the huge amount of data, this approach is applied when the important consequences of pipe failures can justify the accumulation of such data.
The statistical models with various levels of input data may be useful for minor water mains for which there are few data available or for which the cost of failure does not justify the amount and the quality of the required data. The statistical models assume that the historical patters can continue in the future, and the prediction can be done by:
• deterministic models, that are either time-exponential models or time-linear models based on two or three parameters. They are applied on an homogeneous group of pipes that have to be selected carefully;
• probabilistic multi-variate models consider many covariates (defined with awareness by an expert), that influence the pipe breakage patterns, and the selection of homogeneous groups it is not necessary. This kind of model can be useful for define a priority for rehabilitation;
• probabilistic single-variate group-processing models, that include models that use probabilistic processes on grouped data to derive: probabilities of pipe life expectancy (useful for future financial needs), probability of breakage and probabilistic analysis of break clustering phenomenon (useful for short-term planning of water main rehabilitation and renewal).
For example, the EN 752-5 formulates: “the investigation of the construction may comprise either a complete examination of the drainage system or a selective method”. Mueller (2003) argued out the benefit of random selection because it is convenient in terms of time and costs. Then the sewer network has to be grouped in quite homogeneous set according to the relevant characteristics to be considered.
The number of the selected groups depend on heterogeneity of the urban area and the aim of the selective inspection is to infer from the distribution of the classes of condition resulting from a representative random sample the distribution of the classes of condition of specific groups of reaches (Mueller, 2003). These groups have to be small enough to be quite uniform but
to be large enough to provide significant results (Kleiner and Rajani, 2001).The steps for the selection could be:
1. grouping the reaches in samples according to the factors in Tab. 1.3-1;
2. randomly evaluating, inspecting and classifying the condition of each sample, and possibly the longest reaches in each one;
3. projection of the distribution of the condition of the samples taken; 4. localization of the inspection and rehabilitation priorities.
The methods developed within APUSS project for assessing the infiltration at sub-catchment scale allow to improve the sewer grouping. For example, an urban area defined potentially affected by infiltration in a certain period of the year can be investigated by isotopic or pollutograph method in order to confirm this statement quantifying the infiltration rate. While an urban area defined potentially affected by exfiltration in a certain period of the year can be investigated and some of the reaches of its sewer system could be chosen as sample (90% of the reaches (Mueller, 2003)) for quantifying the leakages. In this way, the novel method could be useful for quantifying the consequence of assumed structural damages.
Furthermore, Fenner (2000) described a number of different methods that can be used to optimise and to prioritise proactive maintenance analysing sewer performance. All of them tend to define criteria for classify the sewer pipes in critical or in non-critical 1. This kind of models consist of performance assessment by parameters defined in agree with local characteristic, legal constraints, operational and management strategies (Fenner, 2000). Cardoso et al. (1999) developed a standardised performance assessments suggesting domains of performance indicators (PPIs) relied on hydraulic, environmental, structural, economic and social aspects. The PPIs may be used for immediate decision for technical management or design oriented just on some important performance aspects. A performance indicator list developed within the APUSS project is shown in Fig. 1.3.1 and Fig. 1.3.2 and they are used in a model for supporting decision making during planning rehabilitation allowing a hierarchy of the intervention estimate the performance assessment of the sewer systems by infiltration and exfiltration (LNEC, 2003).
1 Critical sewers are defined as those for which the repair costs after a collapse are expected to be the
Fig. 1.3.2: PPIs for infiltration (LNEC, 2003).
A scientific paper proposed for an international conference about the application of PPIs is:
Cardoso, A.; Prigiobbe, V.; Giulianelli, M.; Baer, E.; Coelho, S.T. (2005). Assessing the impact of infiltration and exfiltration in sewer systems using performance indicators: case studies of the APUSS project. 10th International Confernce on Urban Drainage, Copenhagen, Denmark, 21-26 August 2005.
In annex 2.
1.4 Diagnostic techniques
Although the methods for assessing the infiltrations and the exfiltrations developed within APUSS project can help understanding which part of an urban sewer systems is likely more damaged than another, never they can substitute the direct diagnostic techniques. The infiltration or/and exfiltration estimated by these methods will never give punctual description of
a structural damage. Thus, after applying these methods and individuating which sewer reach could need to be repaired, the sewer direct detection should be carried out.
Different diagnostic techniques exist and they can be divided in three groups that examine (Wirahadikusumah et al., 1998):
1. the overall condition of the external part of the sewer;
2. the overall condition of the sewer wall and, in some cases, the soil around the pipe;
3. specific problems within or behind the sewer wall.
Below each group of the diagnostic techniques listed above is described.
The detection of the overall condition of the external part of a sewer (i.e., sewer wall and the soil surrounding) can be carried out by means of:
• infrared thermography (GRC) that is carried out by an airplane flying over the area or by specially-equipped vans traversing all over the ground. It allows individuating the WW leakage, GW infiltration and the erosion voids (Weil et al.,1994), but it is susceptible to environmental conditions and it is expensive (Fig. 1.4.1).
• ground penetrating radar (GPR) technique that allow gathering information about the structure condition of sewer pipes and surrounding environment (Foillard et al., 1995), but Makar (1999) showed by experimental tests that this system is inaccurate in detecting the voids near the pipes, in particular if the sewer is laid in clay soil.
• dye test by means of smoke or liquid tracers. For example, the first one can be carried out by blowing smoke into an investigated pipe under pressure and then observing where the smoke appears over the ground;
• water tests that are 100% accurate but it is time consuming and labour intensive; • a new system developed in Germany called FELL-41 system and validated by
Gokhale and Graham (2004) in USA. It measures the electrical current between a probe moving in the pipe and a surface electrode. The pipe to be tested can contain sewage or water. The points where water flows out or into cause electrical signal intensity to increase proportionally to damages (Fig. 1.4.2). Gokhale and Graham (2004) successfully tested the device on circular small pipes made by different non-conductive materials (clay, PVC and HDPE) ranging in diameter from 200 through 300 mm. The assessments were reproducible and repeatable as
well as cost-effective. Although it is applicable in larger pipes (up to 1500 mm), the flooding could be cost and time consuming. Finally, practical problems are: bends, jumps and roots that could be damageed the probe.
Fig. 1.4.1: Image by GRC that allowed to see an illicit connection (http://www.nodig.it).
Fig. 1.4.2: Scheme of operation and results by FELL-41 (www.metrotech.com).
Detection of the part within and behind the sewer wall can be done by means of:
• sonic distance measurement method that use the sound waves generated by a piezoelectric transducer that detects the corrosion loss (Fig. 1.4.3) and the volume of the debris on the invert of sewer as small as 0.5 m or as large as 4 m (Price, 1995; Browne et al., 1993). This system allows to detect the state of the sewer under the water, thus it is useful for detecting leakages;
• a system based on the micro-deflection of sewer pipe could be used in order to investigate the state of both sewer wall and the bedding soil. Appling pressure to the inside surface of the wall to very slightly deform it (Makar, 1998). The deflection pressure applied ratio allows to estimate the mechanical resistance of both sewer and soil bedding. Anyway just rigid pipes can be investigated and,
because of the pressure applied, new damages could produced. At the state of the art of this method, it is not possible to separate these new damages from the those already presented before the pressure application;
• impact echo and spectral analysis of surface waves that consists of applying the natural vibration by means of hammers and detecting the vibration by microphones (Sack and Olson, 1994). Unfortunately, it is not possible either to distinguish the defects in sewer wall from those into the bedding soil either to locate the damages.
Fig. 1.4.3: Images recovered that highlight damages or illicit discharges this was carried out by a sonic distance measurement, it is evident the reduction of wall thickness because of corrosion (Price, 1995).
Detection of the overall part inside the pipe (i.e. joins, house connections, etc.) can be done by means of:
• Close-Circuit TeleVision (CCTV) the fist system was a stationary CCTV (Fig. 1.4.4). The stationary CCTV is one of the cheapest method for sewer investigation but the principal disadvantages are: (i) long sewer could be believe without any defects, (ii) defects under water or behind obstructions could be missed, (iii) the images could be subjectively interpreted and a not reference image for the deformation assessment existed so far. The first was overcome disadvantage the mobile CCTV was developed; the second one by the multi-sensor system. The third disadvantage was overcome by computer aided CCTV that assists the analysis process and both qualifies and identifies the defects. Anyway recently a new European standard EN 13508 and in particular the EN 13508-2 (Condition of
drain and sewer system outside buildings-part 2 visual inspection coding system - final draft) codifies the pipe damages recorded by visual inspections (i.e. CCTV, photos, direct inspections, etc.). The damage is codified by three letters: the first one identifies the investigated structure (manhole, pipes …); the second one defines the material, the use, etc…; and the third one the detected damages (cracks, collapse …) and then there are other informations that describe how large is the cracks and where it is placed around the pipe wall.
• a method for assessing the exfiltration at pipe scale consisting of filling the investigated pipe with water and keeping it in this condition for 24 for hours. The level of water used to fill it has to marked at the upstream manhole. The exfiltration rate would be the amount of water that in 1 hour is required to maintain the level constant;
• a method for assessing the infiltration at pipe scale consisting of completely sealing the pipe upstream and measuring the infiltrated flow rate at downstream by an accurate system like as a weir
Fig. 1.4.4: The image reports a collapsed sewer (WRc, 1983).
For a more accurate inspection of sewer condition the Laser-Based Scanning system should be applied, furthermore it has substantially reduced operator errors (Gibert, 1997), and in order to detect both above and below the water line the ultrasonic inspection system can be adopted (Andrews, 1998). It allow to see pits, voids and crack, even if some small cracks are not detectable.
Nowadays, advanced multi-sensoric systems like as KARO (optical, ultrasonic and microwave) (Kuntze et al., 1995), PIRAT (CCTV, laser and sonar scanners) (Campbell et al., 1995) and SSET (CCTV, scanner and three axis mechanical gyroscope) (Abraham et al., 1997)
exist, which can optimize the sewer detection (Fig. 1.4.5). The advantages of these systems are: more reliable data, continuous profile of pipe walls, robot module, higher benefit/cost ratio than the rational methods (e.g., CCTV, Ultrasonic and GPR). The disadvantages of these systems are: they are in prototypical or testing stage that require further development for field implementation and high initial cost (Wirahadikusumah et al., 1998).
Fig. 1.4.5: Images recovered that highlight damages or illicit discharges. C. this was carried out by SSET, the infiltration at join and the damages were detected (Abraham et al., 1997).
The following Tab. 1.4-1 summarizes and compares the method for sewer investigation discusses above.
Tab. 1.4-1: how to use diagnostic techniques by (Makar, 1999).
The diagnostic techniques that: give informations about the structural sewer state comparable to those provided by the novel methods developed within APUSS project and allow to estimate the structural state of running sewer are:
• Stationary CCTV; • Computer assisted CCTV; • Laser scanning; • Ultrasound; • Micro-deflection; • Impact echo; • SASW.
1.5 References
EN 13508-2 (Condition of drain and sewer system outside buildings-part 2 visual inspection coding system - final draft).
D.M. 97/1999.
D.L. 152/1999 and D.M. 258/2000.
Abraham, A.D.; Iseley, T.; Prasanth, R.K.; Wirahadikusumah, R. (1997). Integrating Sensing Technologies for Underground Utility Assessment, ASCE Conference on Infrastructure Condition Assessment, Boston, MA, August 1997.
Andrews, M. E. (1998). Large diameter sewer condition assessment using combined sonar and CCTV equipment. Proc. APWA Int. Public Work Congr. National Research Council of Canada.
Ayscough, N. J.; Fawell, J.; Franklin, G.; Young, W. (2000). Review of human pharmaceuticals in the environment. Environment Agency, R&D Technical Report P 390.
Barrett, M. H.; Hiscock, K. M.; Pedley, S.; Lerner, D. N.; Tellam, J. H.; French, M. J. (1999). Marker species for identifying urban groundwater recharge sources: a review and case study in Nottingham, UK. Water Research, 33 (14) pp. 3083-3097.
Baur, R. (2003). Developing a decision framework for sewer network rehabilitation. Proceedings of the 17th European Junior Scientific Workshop on Rehabilitation
Bhattacharjee, S.; Ryan, J. N.; Elimelec, M. (2002) Virus transport in physically and geochemically heterogeneous subsurface porous media. Journal of Contamination Hydrology, 57, pp. 161-187.
Browne, R.; Knott, G. (1993). Television and Scanning Sonar in Seattle Metro’s Siphons and Brick Sewers, ASCE International Conference on Pipeline Infrastructure II, San Antonio, p. 694–701.
Campbell, G.; Rogers, K.; Gilbert, J. (1995). PIRAT—A System for Quantitative Sewer Assessment, International No-Dig ’95 Conference, Dresden, Germany, September 1995 pp. 455– 462.
Cardoso, M. A., Coelho, S. T., Matos, J. S. and Matos, R. S. (1999). A new approach to the diagnosis and rehabilitation of sewerage systems through the development of performance indicators. In Proceedings of the eight international conference urban storm drainage, Sidney - Australia. pp. 610-617.
Dauthton, C. G.; Ternes, T. A. (1999). Pharmaceuticals and personal care products in the environment: agents of subtle change? Environ Health Perspect, 107(Suppl. 6), pp. 907-938.
Dietrich, D. R..; Webb, S.F.; Petry T. (2002). Hot spot pollutants: pharmaceuticals in the environment. Toxicological Letter, 131, pp. 1-3.
Davies, J.P.; Clarke, B.A.; Whiter, J.T.; Cunningham, R.J. (2001A). Factors influencing the structural state deterioration and collapse of rigid sewer pipes. Urban Water vol.3, pp. 73-89.
Davies, J.P.; Clarke, B.A.; Whiter, J.T.; Cunningham, R.J.; Leidi, A. (2001B). The structural condition of rigid sewer pipes: a statistical investigation. Urban Water, 3, pp. 145-154.
Dizer, H.; Filip, Z.; Lopez Pila, J.; Milde, G.; Nasser, A.; Seidel, K. (1985). Laborversuche zur persistenz unfìd zum trasportverhalten von viren. Materialen 2, pp.20-26, umweltbundesamt. Schmidt, Berlin.
Dizer, H.; Hagendorf, U. (1991). Microbial contamination as an indicator of sewer leakage. Water Research, 25 (7), pp. 791-796.
Ellis, B. (2001). Sewer infiltration/exfiltration and interactions with sewer flows and groundwater quality. Conference Proceedings of the 2nd International Conference “Interactions
between sewer, treatment plants and receiving waters in urban areas”. Interurba II°, Lisbon, 19th
-22nd February 2001, pp. 311-320.
Fenner, R.A. (1990). Excluding groundwater infiltration into new sewers. Journal of IWEM, 4.
Fenner, R.A. (1991). The influence of sewer bedding arrangement on infiltration rates and soil migration. Municipal Engineer, vol. 8, pp. 105-117.
Fenner, R.A. (2000). Approaches to sewer maintenance: a review. Urban Water, vol. 2, pp. 343-356.
Filip, Z.; Dizer, H.; Kaddu-Mulindwa, D.; Kiper, M.; Lopez Pila, J. H.; Milde, G.; Nasser, A.; Seidel, K. (1986). Untersuchengen ueber das verlhaten pathogener und anderer mikroorganismen und viren im grundwasser im hinblick auf die bemessung von wasserschutzzonen. In WaBoLu Hefte 3: Bundesgesundheitsanmt, Berlin.
Foillard, R.; George, B.; Schwarze, C. (1995). New Applications of Ground Penetrating Radar for Construction and Rehabilitation in the Pipe Sector. International No-Dig ’95 Conference, Dresden, Germany September 1995, pp. 147–159.
Gibert, J (1997). Newsdesk. Insight January 39 (1), 9.
Gokhale, S.; Graham, J. A. (2004). A new development in locating leaks in sanitary sewers. Tunneling and Underground Space Technology n.19, pp. 85-96.
Halling-Sorensen, B.; Nielson, S.N.; Lanzky, P.F.; Ingerslev, F.; Holten Lutzhoft, J.; Jorgensen, S.E. (1998). Occurrence, fate and effects of pharmaceutical substances in the environment – a review. Chemosphere, 35, pp. 357-393.
Heberer, T. (2002). Occurrence, fate, and removal of pharmaceutical residues in the aquatic environment: a review of recnt research data. Toxicological Letter, 131, pp. 5-17.
Jorgensen, S.E.; Halling-Sorensen, B. (2000). Drugs in the environment. Chemosphere, 40, pp. 691-699.
Kleiner, Y.; Rajani, B. (2001). Comprehensive review of structural deterioration of water mains: statistical models. Urban Water, 3, pp. 157-176.
Kolpin, D.W.; Skopec, M.; Meyer, M.T.; Furlong, E.T.; Zaugg, S.D. (2004). Urban contribution of pharmaceutical and other organic wastewater contaminants to streams during diffeing flow conditions. Science of the Total Environment, 328, pp. 119-130.
Kreitler, C.W. (1975). Determining the source of nitrate in groundwater by nitrogen isotope studies:. Austin, Texas, Univer. of Texas, Austin, Bureau of Econ. Geol. Rep. of Inves. #83, 57 p.
Kreitler, C.W., 1979. Nitrogen-isotope ratio studies of soils and groundwater nitrate from alluvial fan aquifers in Texas. Journal of Hydrology, 42, pp. 147-170.
Kuntze, H.B.; Schmidt, D.; Haffner, H.; Loh, M. (1995). KARO—A Flexible Robot for Smart Sensor-Based Sewer Inspection. International No-Dig ’95 Conference, Dresden, Germany, September 1995, pp. 367–374.
LNEC (2003). Infiltration and exfiltration performance indicators- sewer system performance assessment methodology and formulation. Project APUSS delivery.
Management of Urban Infrastructure Networks, Dresden 2003.
Makar, J.M. (1999). Diagnostic Techniques for Sewer Systems. Journal of Infrastructure Systems, 5 (2), pp. 60-78.
Milde, G.; Filip, Z.; Leschber, R.; Hagendorf, U. (1987). Auswirkungenvon abwasser auf boden und untergrund. Gewaessersch. Aess. Abwaess. (100), pp. 351-370.
Mueller, K. (2003). Selective inspection of sewer system and connecting pipes. Proceedings of the 17th European Junior Scientific Workshop on Rehabilitation
O’Reilly, M. P.; Rosbrook, R. B.; Cox, G. C.; McCloskey, A. “Analysis of defects in 180 km of pipe sewers in southern water authority” TRRL Research Report , 1989.
Powell, K. L.; Taylor, R. G.; Cronin, A. A.; Barrett, M. H; Pedley, S.; Sellwood, J.; Trowsdale, S.A.; Lerener, D. N. (2003). Microbial contamination of two urban sandstone aquifers in the UK. Water Research 37, 339-352.
Price; T. (1995). Inspecting Buried Plastic Pipe Using A Rotating Sonic Caliper. Proceedings of the 2nd International Conference on Advances in Underground Pipeline Engineering, pp. 126–137.
Rauch, W.; Stegner, Th. (1994). The colmation of leaks in sewer systems during dry weather flow. Water Science and Technology, 30 (1) pp. 205 - 210.
Rettinger, S.; Ronen, D.; Amiel, A.J.; Magaritz, M; Bischopsberger, W. (1991). Tracing the influx of sewage from a leaky sewer into a very thin and fast-flowing aquifer. Water Research 25, 75-82.
Ronen, D.; Margaritz, M.; Levy, I. (1986). A multilayer sampler for the study of detailed hydrochemical profiles in groundwater. Water Research 20, pp. 311-315.
Sack, D.; Olson, L. (1994). In situ non-destructive testing of buried precast concrete pipe. Proc. ASCE 1994 Mat. Engrg. Conf. ASCE Reston. Va.
Sacher, F.; Lange, F. T.; Brauch, H.-J.; Blankenhom, I. (2001). Pharmaceuticals in groundwaters Analytical methods and results of a monitoring program in Baden-Wuerttemberg, Germany. Journal of Chromatography A, 938, pp. 199-210.
Serpente, P.E. (1994). Understanding the modes of failure for sewers. In W. A. Macaitis (Ed.), Urban drainage rehabilitation programs and techniques selected papers on urban drainage rehabilitation from 1988-1993. New York, ASCE.
TU Dresden (2004). Conceptual model for the ex and infiltration of sewer. Project APUSS delivery.
WEF/ASCE (1994). Existing sewer evaluation and rehabilitation. 2nd edition. WEF manual of practice FD-6/ASCE manuals and reports on Engineering practice n. 62.
Weigel, S.; Beger, U.; Jensen, E.; Kallenborn, R.; Thoresen, H.; Huehnerfuss, H. (2004). Determination of selected pharmaceutical and caffeine in sewage and seawater from Tromso/Norway with emphasis on ibuprofen and its metabolites. Chemosphere 56, pp. 583-592.
Weil, G.J.; Graf, R.J.; Forister, L.M. (1994). Remote sensing pipeline rehabilitation methodologies based upon the utilization of infrared thermography. Urban drainage rehabilitation programs and techniques, ASCE.
Wirahadikusumah, R.; Abhaham, D. M.; Iseley, T.; Prasanth, R. K. (1998). Assessment technologies for sewer system rehabilitation. Automation in Construction 7, pp. 259-270.
WRc, (1983). Sewerage Rehabilitation Manual. 2nd edition. UK. WRc, (2001). Sewerage Rehabilitation Manual. 4th edition. UK.
CHAPTER 2
Novel Methods for Quantifying the
infiltration and the exfiltration in
Urban Sewer Systems
2.1 Introduction
Within the project APUSS novel methods for quantifying the infiltrations and exfiltrations in urban sewer systems have been developed by EAWAG (CH) and they have been applied by IRSA-CNR (IT) in two sewer systems in Rome. Anyway, these methods do not intend to replace the use of direct diagnosis techniques (described into §[ 1.4]), but money can be saved by using them for selecting sewer parts to be carefully investigated. As a matter of the fact, an advantage into use these novel methods is that they allow to quantify the infiltration and the exfiltrations and then to prioritise sewer parts for the inspection, as well as they can be applied
for the calibration and/or validation of the models used for the strategic planning of sewer rehabilitation.
This chapter is divided into two principal parts:
1. in the first one, the methods for quantifying the exfiltrations are described and the physical phenomena is critically discussed;
2. in the second one, the methods for quantifying the infiltrations are described and the applicability of those methods on an urban sewer system is critically discussed, as well.
2.2 Methods for Quantifying the Exfiltrations
In this paragraph, two methods developed for the quantification of the exfiltrations from the urban sewer networks are described. The methods are called QUEST (QUantification of Exfiltration from Sewer with artificial Tracer) and QUEST-C (QUantification of Exfiltration from Sewer with artificial Tracer Continuously dosed). They share a basic common idea, that is they consist of calculating a mass balance upon chemical a running urban sewer reach to be investigated of conservative tracer dosed into the wastewater stream. Nevertheless, they distinguish on the dosage system:
1. QUEST is based on the slug injection of a chemical tracer at two different points along the reach to be tested;
2. QUEST-C is based on a continuous dosage of two different chemical tracers at two different points along the reach to be tested.
The methods are described below, and subsequently there is a critical discussion of them, but for more details about them it suggests to read the protocol written by the partner of APUSS project that developed these methods and the literature by Rieckermann and Gujer, 2002, Rieckermann et al., 2003 and Rieckermann et al., 2004.
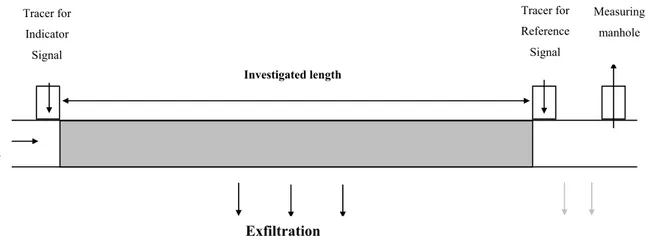
2.2.1 QUEST
The method QUEST applied has been developed within European Project APUSS. It essentially consists of a slug dosage of a tracer solution at known concentration in two different manholes of a sewer pipe and in the detection of tracer cloud plume? at downstream (Fig. 2.2.1).
At the first manhole upstream of the investigated pipe the amount of tracer affected by exfiltration is dosed and at measuring manhole (Fig. 2.2.1) the conductivity is recorded. When the cloud of tracer arrives at this section a peak is detected, as it allows evaluating the residual mass of tracer it is called indicator peak.
At the second manhole the tracer slug dosage aims at estimating the flow rate and the conductivity peak measured at downstream is called reference peak.
Between the second manhole and the measuring one the exfiltration ratio is not assessed, because it affects both the indicator and the reference signals.
In the following Fig. 2.2.2 reference and indicator conductivity signals are shown together with the hydrograph.
Fig. 2.2.1: Conceptual scheme of the QUEST method (modified after Rieckermann and Guyer, 2002)
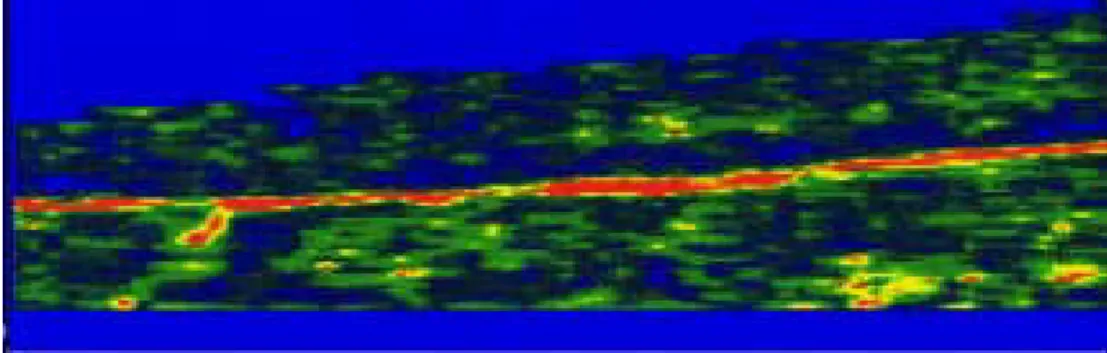
700 1000 1300 1600 1900 2200 2500 2800 3100 3400 3700 12:00:00 12:14:24 12:28:48 12:43:12 12:57:36 13:12:00 13:26:24 13:40:48 Time [hh:mm:ss] Conductivity [microS/cm] 0 5 10 15 20 25 30 35 Flow rate [L/s] Conductivity [microS/cm] Q [L/s]
Fig. 2.2.2: Graph of conductivity and flow rate vs. time. The peaks number 1, 2, 4 and 5 are the reference signals; the peaks number 3 and 6 are the indicator signals.
Tracer for Indicator Signal Exfiltration Tracer for Reference Signal Measuring manhole Investigated length Flow
If the complete mixing occurs the exfiltration rate of tracer mass is equal to wastewater one, so the equation used for the calculation of exfiltration ratio is:
dosage meas M M exf = 1− Eq. 2.2-1
where Mdosage is the dosed NaCl amount [gr] and Mmeas is evaluated by the following equation:
∫
− = . _ )) ( ) ( ( * * ) ( ind span baseline meas Q t e C t C t dt M Eq. 2.2-2in the Eq. 2.2-2 span ind. indicates the time during which the conductivity peak of indicator signal passes through the measuring manhole; Q(t) is the flow rate during the indicator peak passage [L/s]; C(t) is the indicator signal conductivity measured [µS/cm]; e is the conversion coefficient evaluated in the laboratory (e = 0.0006 gr cm (L µS)-1) and C
baseline(t) is the
background conductivity of wastewater during the indicator peak passage [µS cm-1].
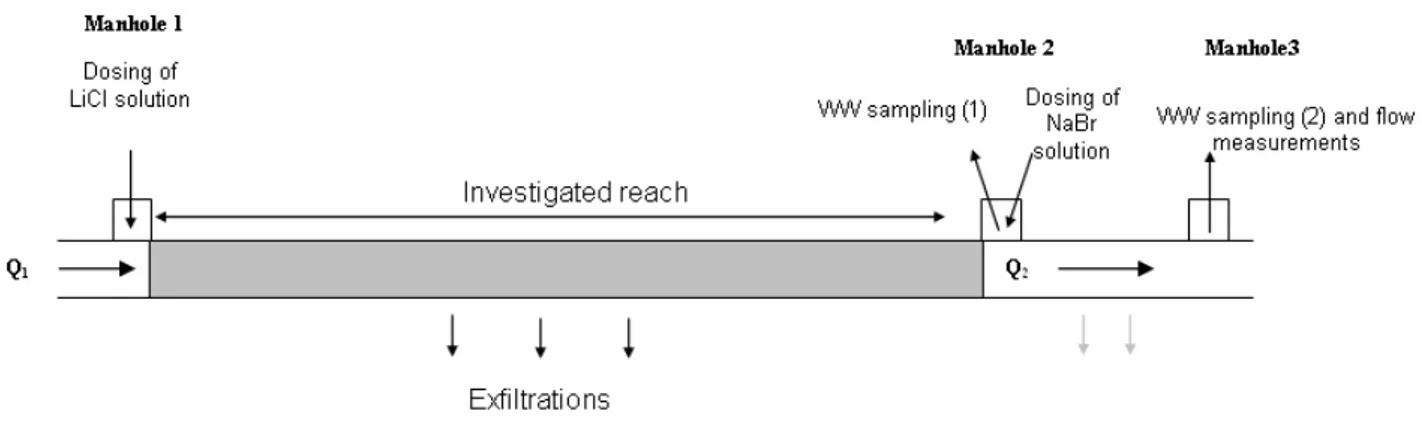
2.2.2 QUEST-C
The method QUEST-C allows quantifying the exfiltration in urban sewer pipes (Rieckermann et al., 2003 A and B; Rieckermann et al., 2004). It consists of a continuous dosing of two different tracer solutions (LiCl and NaBr) at two different locations along a tested sewer. The LiCl solution has to be dosed for measuring the discharge at the beginning of investigated reach (Q1 in Fig. 2.2.3), the NaBr solution has to be dosed for measuring the discharge at the
end of investigated reach (Q2 in Fig. 2.2.3). The wastewater samples taken at Manhole 3 are to
be analyzed by means of IC in order to determine the Li+ and Br-. The background concentration of Br- is determined by sampling at Manhole 2.
Fig. 2.2.3: Scheme of tracer dosage and sampling of QUEST-C method (Modified from Rieckermann et al., 2003B).
The exfiltration ratio percentage is calculated by the following equation:
100 * . 1 2 1 ⎟⎟ ⎠ ⎞ ⎜⎜ ⎝ ⎛ − = Q Q Q exf Eq. 2.2-3
In particular, considering a steady flow the latter equation becomes:
100 * * * 1 . ⎟ ⎟ ⎟ ⎟ ⎠ ⎞ ⎜ ⎜ ⎜ ⎜ ⎝ ⎛ − = wwLi solLi solLi wwBr solBr solBr C q c C q c exf Eq. 2.2-4
where: csolBr( Li) [mg/L] is the Br- (Li+) concentration in the dosed solution; qsolBr( Li) [L/s] is the flowrate of the peristaltic pump dosing NaBr (LiCl) solution; CwwBr(Li) [mg/L] is the concentration of Br- (Li+) in the wastewater samples. The qsolBr( Li) is checked during the
experiment in order to control the stability of the dosed tracer masses.
The Eq. 2.2-3 is applicable when the flow is quite steady during the trials; in this case Rieckermann et al. (2003B) estimated that the standard deviation of exfiltration ratio changed between 2.4% - 2.6%, and Rieckermann et al. (2004) observed that it decreased at 0.5% as the flow rate variability was taken into account. Following the exfiltration ratio has been calculated by the Eq. 2.2-3, because all the experiments were carried out in a period of the day when the lowest variability of flowrate had been calculated.
2.2.3 Hydrodynamic background of QUEST and QUEST-C
QUEST and QUEST-C base on the dilution method (ISO 9555-1, 1994) and allow to estimate the flowrate more accurately than the flowmeter, because of the high accuracy of the equipments applied. Nevertheless, there can be some sources of uncertainty affecting the exfiltrations calculated with the equations Eq. 2.2-1 and Eq. 2.2-3, and they are generally due to:1. dosage of tracers;
2. adsorption and precipitation of tracers; 3. tracers transport;
4. uncorrected sampling or uncorrected measurement of tracers; 5. data regression.
In this chapter the physical phenomena involved during the transport (point three above) of non-buoyant tracers in a channel is discussed in order to highlight the importance of some key points of the QUEST and QUEST-C methods (e.g., mixing, dilution, etc.). The other points are discussed in the next chapter, because in this chapter more emphasis is given to the hydraulic aspects of the tracer transport, while in the next chapter deals with the uncertainty sources.
Finally, the sampling and the measurement procedures for taking representative water samples are given.
2.2.3.1 Tracer Transport
The methods QUEST and QUEST-C consist of dosing a non-buoyant conservative tracer into a wastewater stream and calculate how much of this exfiltrates.
When a tracer is introduced into a stream, it is carried away from the point of discharge by the current and this phenomena is called advection and it spreads out because of the molecular diffusion or dispersion. Most of the considerations in this chapter are taken from (Rutherford, 1994).
In laminar flow we have the following situation. The advection causes the fluid parcels to move downstream without spreading, for a parcel that is carried in the direction x, the advective flux is modelled by:
c u Ix = x
where Ix is the advective flux in x direction [g m-2 s-1]; ux is the average longitudinal velocity [m
s-1]; c is the tracer concentration [g m-3]. The Lagrangian system, which lies at the centre of the tracer cloud (collection of fluid parcels whose dimension are comparable with the smallest length scale of interest and with velocity and concentration characteristics), is use for advection.
The molecular diffusion is modelled by the Fick’s law:
x c e Jx m ∂ ∂ − = Eq. 2.2-6
where Jx is the molecular diffusive flux in the x direction [g m-2 s-1]; em is the molecular diffusion
coefficient whose typical value in water changes between 0.5 – 2.0 x 10⁻⁹ [m2 s-1]; δc/δx is the tracer concentration gradient in the x direction [g m-4]. The negative sign means that the
molecular diffusion develops in the opposite direction of the concentration gradient. The molecular diffusion is defined in a fixed Eulerian coordinates.
The advection/diffusion three dimensional equation can be derived from a mass balance on a rectangular parcel fluid moving at mean velocity is in rectangular Cartesian coordinates2:
⎥ ⎦ ⎤ ⎢ ⎣ ⎡ ⎟⎟ ⎠ ⎞ ⎜⎜ ⎝ ⎛ ∂ ∂ = ⎟⎟ ⎠ ⎞ ⎜⎜ ⎝ ⎛ ∂ ∂ + ∂ ∂
∑
∑
= = 3 1 2 2 3 1 i i m i i i x c e x c u t c Eq. 2.2-7where ui is the average velocity along the three orthogonal directions defined by the rectangular
Cartesian coordinates [m s-1] where 1=“x”, 2=”y” and 3=”z”. A solution of this system for:
a. a conservative tracer; b. known initial conditions; c. stationary situation; d. unbounded channel;
allows us seeing that the variance of tracer cloud increase linearly with time.
If the Reynolds number is below 500 the flow is laminar, if it is above about 2000 the flow is turbulent which is generated by velocity shears where there are velocity gradients. In a turbulent flow the tracer spread more rapidly than in the first one.