ORIGINAL RESEARCH
Assessing community resilience, housing recovery
and impact of mitigation strategies at the urban scale: a case
study after the 2012 Northern Italy Earthquake
Alberto Basaglia1 · Alessandra Aprile2 · Enrico Spacone1 · Luca Pelà3
Received: 16 December 2019 / Accepted: 28 July 2020 / Published online: 10 August 2020 © The Author(s) 2020
Abstract
In this paper, the reconstruction process of a town affected by the 2012 Northern Italy Earthquake is analysed using information published on the town journal. Relevant aspects are highlighted, and the housing recovery is compared with that of a nearby city. Then, a what-if scenario is considered, by proposing a set of seismic mitigation strategies. These strategies are applied to a small sub-system of the city and the variation of the buildings’ vulnerability and expected damage is evaluated using a recently introduced methodol-ogy for risk assessments at the urban scale. Finally, a cost–benefit analysis is performed to assess the effectiveness of the proposed strategies. The analysis highlights a significant reduction in the expected damage and socioeconomic impact, as well as an increase in the overall performance of the urban system.
Keywords Community resilience · Housing recovery · Seismic risk · Risk assessment · Risk mitigation
1 Introduction
Major earthquakes are rare natural events whose consequences may last for decades. In most cases, this is due not only to the intensity of the event, but mostly to the fragility of the built environment (Smith 2006). Italy, for example, has one of the oldest building stocks in the world, with a considerable number of unreinforced masonry (URM) and rein-forced concrete (RC) structures not designed according to modern seismic codes. For these reasons, major earthquakes have been causing not only severe life losses but also wide-spread damage that required the Central Government to allocate several billion Euros in
* Alberto Basaglia [email protected]
1 Department of Engineering and Geology, University of Chieti–Pescara, Viale Pindaro 42,
65127 Pescara, Italy
2 Department of Engineering, University of Ferrara, Ferrara, Italy
3 Department of Civil and Environmental Engineering, Universitat Politècnica de Catalunya
Disaster Relief Funds (DRFs) over the years, see Table 1 (Servizio Studi - Dipartimento ambiente 2009; Ufficio Valutazione Impatto 2017). What is striking is not only the total amount of allocated funding but also the long spans of the funding periods.
These funds include direct losses, i.e. the costs related to the repair or replacement of buildings and infrastructures, and indirect losses, i.e. induced damage caused by the earth-quake on the community (Brookshire et al. 1997).
In general, major earthquakes may affect businesses by a variety of mechanisms, rang-ing from physical damage to property and assets, downtime with loss of revenue, and disruptions to labour supply, customers and suppliers (Brown et al. 2015). In particular, indirect losses due to business interruption can seriously threaten the financial stability of small-to-medium enterprises, as it happened after the 2012 Northern Italy Earthquake (NIE) (Donà et al. 2019). Usually, the Italian Central Government allocates funding after a disaster addressing direct losses of businesses, that can be used to restore their property and assets (Regione Emilia Romagna 2012a), and to households displaced by the event. More specifically, two different types of funding are provided for displaced households. The first type of funding is the Contribution for Autonomous Set-up or CAS that help fami-lies paying for an alternative lodging while their home is unusable (Agenzia Regionale di Protezione Civile 2012). The second type of funding covers the repair/replacement costs of homes damaged by the earthquake and owners can apply through the Unique Digital Module for Buildings or MUDE platform (Regione Emilia Romagna 2017). MUDE is a web-form where homeowners can submit claims for compensation of the reconstruction cost, while providing all the documentation of the construction works and project phases. Besides, households who do not want to find autonomously an alternative lodging or leave the town, are provided with a Removable Prefabricated Living Modulus or PMAR (Regione Emilia Romagna 2012b). It is worth noting that households who are assigned a PMAR cannot apply also for a CAS (Regione Emilia Romagna 2012c).
The aforementioned DRFs do not cover all losses due to major earthquakes. In fact, the impact on businesses unable to reopen or that decide to relocate may only be observed by analysing the community Gross National Product (GDP) years after the event (Webb et al.
2002). Similarly, households that decide to relocate cause a decrease of workforce, poten-tial customers and taxpayers, ultimately leading to the city depopulation (Parrinello 2012). Moreover, major earthquakes may severely damage the Nation’s built heritage (Parisi and Augenti 2013), causing not only immeasurable cultural losses but also negatively affecting Table 1 Disaster relief funds
and allocation period for major earthqakes in Italy since 1968 (Servizio Studi - Dipartimento ambiente 2009; Ufficio Valutazione Impatto 2017)
a Estimate
Earthquake Funding period Funding
allo-cated (MIL €)
Valle del Belice 1968–2018 8375
Friuli-Venezia Giulia 1976–2006 16,917 Irpinia 1980–2023 47,470 Marche-Umbria 1997–2024 12,284 Puglia-Molise 2002–2023 1300 L’Aquila 2009–2047 17,458 Emilia-Romagnaa 2012–2047 8171 Central Italya 2016–2047 13,163 Total 125,138
the citizens’ sense of place (Chamlee-Wright and Storr 2009) and tourism activities (Maz-zocchi and Montini 2001).
In order to reduce earthquake-related losses and the economic burden on the National budget, two main approaches can be employed. The first promotes risk coverage, particu-larly relevant in countries like Italy where only 2% of the population reportedly have earth-quake insurance in 2019 (Swiss Re 2019). However, this approach does not prevent loss of lives but only ensures swift monetary allocation for the reconstruction. On the other hand, mitigation strategies at the urban scale can be carried out, including strengthening or retro-fitting of buildings in order to reduce damage in the possible occurrence of future events. Ideally, both approaches should be pursued to minimize losses and guarantee recovery.
In the United States, recent studies show the economic benefits of mitigation, ranging from $6 (Multihazard Mitigation Council 2017) to $105 (FM Global 2018) saved for every $1 invested. The first study compares the “cost” associated with strengthening or building new constructions up to code and long-term maintenance, with the expected “benefits”. Benefits include not only direct losses, such as property damage, casualties, insurance claims, additional living expenses and loss of services, but also indirect losses such as the effects of post-traumatic stress disorder (PTSD) and business interruption. The analysis is made using hazard maps that include the probability of occurrence of various hazards across the States. The second study is related only to hurricane hazard but does not pro-vide additional detail; therefore, it should be seen only as an example of the benefits of mitigation.
In Italy, the Government has recently introduced incentives aimed at promoting insur-ance policies against natural disaster (Il Presidente della Repubblica 2017) and mitigation. The latter was made by enacting the so-called “Sisma-bonus” (Quake-bonus in English), a tax break spread over 5 to 10 years that can reach up to 85% of the amount spent in struc-tural reinforcement or retrofit works (Agenzia delle Entrate 2019). Both incentives have been introduced in recent years (2016–2017) after the Central Italy earthquake, thus the impact and effectiveness of these measures have still to be assessed.
For this reason, seismic assessments at the urban scale can become powerful tools not only to evaluate the actual vulnerability of the built environment, but also to identify the most suitable mitigation techniques. As these assessments have to deal with a large number of buildings, the use of so-called indirect methods is preferable. The indirect method used in this paper is described in detail in the following Section.
This paper focuses on the recovery process of Concordia sulla Secchia, a town in North-ern Italy, by analysing the town journal in the years following the event. The aim is to highlight the main issues faced by the community after the earthquake, as well as the losses left out from post-disaster reports. More specifically, the factors affecting the community resilience and the housing recovery process are investigated. Community resilience is defined as the ability of a community to adapt after a catastrophic event in order to regain its original functionality (Norris et al. 2008). Although the existing literature acknowledges that housing “recovery” may be difficult to assess and quantify, as it involves different psy-chological, social and economic aspects (Peacock et al. 2018), the return to a permanent living solution is a key element in the process (Peacock et al. 2007). Therefore, the term housing recovery is associated in this study to the return to a permanent living solution, measured by the values of PMARs and CASs after the earthquake occurrence. The hous-ing recovery process of Concordia sulla Secchia is measured and compared with that of a nearby community affected by the same earthquake. A mathematical function for predict-ing the time needed for the complete houspredict-ing recovery is derived and discussed. In addi-tion, a cost–benefit analysis of Concordia sulla Secchia essential sub-system is carried out
by proposing a set of building Strengthening Works (SWs). The essential sub-system refers to those buildings in the city whose damage has to be limited in order to carry out emer-gency operations. Few studies have already analysed the seismic mitigation at the urban level (Brando et al. 2017; Ferreira et al. 2017; Marques et al. 2018) but applications to RC buildings are still lacking. Lastly, expected losses due to the 2012 NIE with/without SWs are compared, thus highlighting the potential impact of seismic mitigation policies.
2 Indirect methods for the seismic assessment at the urban scale
Indirect methods usually characterize the seismic response of buildings by dividing them into classes or assigning them a vulnerability index. In particular, seismic assessments based on the vulnerability index method proposed by the Italian “Gruppo Nazionale di Difesa dei Terremoti” (GNDT) (Gruppo Nazionale per la Difesa dai Terremoti 1994a) have been increasingly carried out in recent years (Vicente et al. 2011; Ferreira et al. 2013,
2017; Formisano et al. 2015; Basaglia et al. 2018; Cara et al. 2018; Chieffo and Formisano
2019; Sbrogiò et al. 2019). The GNDT method uses a form to assess the buildings’ struc-tural response based on 11 parameters. Forms are available for URM (Gruppo Nazionale per la Difesa dai Terremoti 1994b) and RC buildings (Gruppo Nazionale per la Difesa dai Terremoti 1994c). An update of the form for URM buildings was proposed by the Tus-cany Region in 2004 (Ferrini et al. 2004). This update mainly focuses on buildings of poor masonry quality that were reinforced using strengthening techniques that turned out to actually increase the structural vulnerability, such as RC ring-beams added at the roof and/ or the floor level (see Sbrogiò et al. 2019 for more details). The 11 parameters represent the main geometrical and structural features deemed to affect the seismic response, such as the type of structural system, the in-plan and in-height regularity, roofing system, mainte-nance condition and others. Four different vulnerability classes, Cvi , and different weights,
wi , are assigned to each parameter. Vulnerability classes Cvi range from A (less vulnerable) to D (most vulnerable). Each class is associated with a score for each parameter, and may be determined thanks to a visual inspection of the building under assessment. Once the class Cvi and its related score is determined for each parameter, the vulnerability index IV is
evaluated through the following weighted sum:
then normalized so that it ranges in the [0, 100] interval. It is worth noting that IV for the
GNDT method does not include the effect of being in an aggregate sequence.
In this paper, a recently proposed (Basaglia et al. 2018) and already applied (Cara et al.
2018) method is adopted. This method stems from the original GNDT form and include, for URM buildings, five additional parameters to include the effect of being in an aggregate sequence. These parameters were already introduced in a previous study (Formisano et al.
2015) but their scores and weights have been recalibrated as they were felt to be too con-servative. The change was made by comparing the predicted damage to the one observed for Concordia sulla Secchia, a small Italian community hit by the 2012 NIE (Basaglia et al.
2018). Given these additional parameters for URM buildings, the IV normalization is
car-ried out using the following equations:
(1) I∗ V= 11 ∑ i=1 Cvi⋅ wi
Once normalized, the vulnerability index IV can be used to predict the expected mean
damage grade, 𝜇D , varying in the [0, 5] range ( 𝜇D= 0 indicating no damage and 𝜇D= 5
indicating full collapse), using the Macroseismic approach (Lagomarsino and Giovinazzi
2006):
where IEMS−98 is the earthquake intensity according to the EMS-98 scale (Grünthal 1998);
V is the vulnerability parameter, related to the IV through the empirical relationships in
Eq. (4 defined for URM buildings (Ferreira et al. 2013) and RC buildings (Basaglia et al.
2018); is a ductility factor, defined equal to 2.3 for masonry buildings and in the [2.3 ÷ 3.3] range for RC buildings (Lagomarsino and Giovinazzi 2006); f (IEMS−98, V
)
is a corrective function introduced to better describe damage for lower earthquake intensities (Bernardini et al. 2007). In case that site effects are present, they can be taken into account by adding a vulnerability modifier, ΔV , to the vulnerability parameter of Eq. 3 (Lagomarsino and Giovinazzi 2006).
The mean damage grade obtained for each building, 𝜇D , can be used to derive the
prob-ability of experiencing different damage levels P(Dk) ( D0 indicating no damage and D5 indicating full collapse), through the beta distribution, see Eqs. 5–7:
where p𝛽(x) and P𝛽(k) indicate the probability density function and the cumulative
distri-bution function of the beta distridistri-bution, respectively; b and t are assumed equal to 6 (Lago-marsino and Giovinazzi 2006) and 8 (Bernardini et al. 2007). The procedure is described in detail in previous papers (Vicente et al. 2011; Basaglia et al. 2018; Cara et al. 2018).
(2) (URM, with additional parameters) IV= I
∗ V 675 (RC) if I ∗ V < −6.5, IV = −1.731 ⋅ IV∗+ 56.72 if I∗ V > −6.5, IV= −10.07 ⋅ IV∗+ 2.5175 (3) 𝜇D= 2.5 ⋅ [ 1 + tanh( IEMS−98+ 6.25 ⋅ V − 13.1 Q )] ⋅ f(IEMS−98, V ) ((4) (URM) V = 0.592 + 0.0057 ⋅ IV (RC) V = 0.24 + 0.0165 ⋅ IV− 0.00003333 ⋅ I 2 V (5) P(Dk) = P𝛽(k + 1) − P𝛽(k) = k+1 ∫ k p𝛽(x)dx = ; k = 0 ÷ 5 (6) p𝛽(x) = 𝛤(t) 𝛤(r)𝛤 (t − r) xr−1(b − x)t−r−1 bt−1 ; 0≤ x ≤ 6 (7) r = t𝜇D b
3 Community resilience after the earthquake: the case of Concordia
sulla Secchia
3.1 Documenting the reconstruction
At 02:03 UTC (04:03 local time) on May 20th, 2012, a seismic event with moment mag-nitude (Hanks and Kanamori 1979) MW = 5.9 hit the Emilia Romagna Region, Northern
Italy. At 09:00 UTC (07:00 local time) on May 29th, 2012, another seismic event with MW = 5.8 hit the same area. Both earthquakes caused a total of 28 deaths, injured approxi-mately 300 people and displaced 45.000 (Ioannou et al. 2012).
The earthquakes caused severe damage, especially to historic buildings such as churches (Sorrentino et al. 2014), made of clay bricks and low quality mortars, but also to industrial buildings made of precast RC (Braga et al. 2014). It is estimated that 500 factory ware-houses suffered severe damage or collapse in the Emilia-Romagna Region (Liberatore et al. 2013), mainly due to the absence of proper beam-column connections. The area was included in a seismic zonation in 2003 only (Presidente del Consiglio dei Ministri 2003), thus the structures built before this year were designed without taking into account the nec-essary earthquake-resistant concepts.
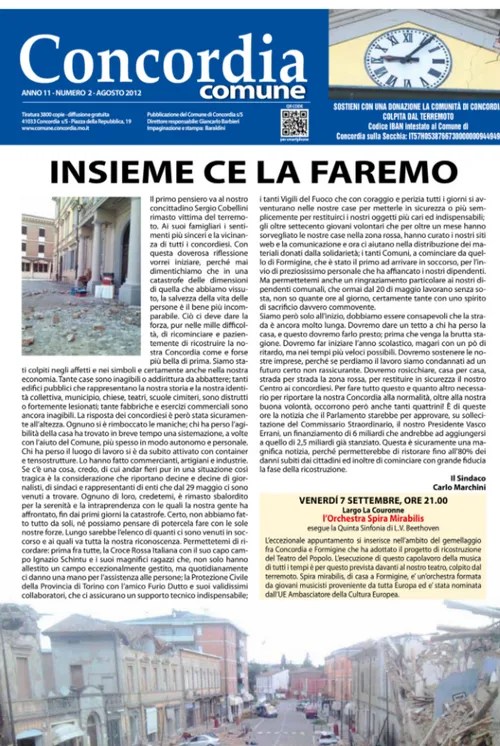
Concordia sulla Secchia is a city of approximately 8300 people in the Province of Modena, Emilia-Romagna Region. The city has a K12 school system (from kindergarten to secondary school) and more than 800 active businesses, with manufacturing being the main sector [source: Italian Department of Commerce Registry (Il Presidente della Repub-blica 2009)]. Concordia sulla Secchia has a town journal called “Concordia Comune”, see Fig. 1. The journal is used to update the community on political actions, main pub-lic events, voluntary activities, and it sometimes collects testimonies by citizens and local business owners.
“Concordia Comune” represents not only a useful tool to raise and maintain the popula-tion awareness, but also a precious testimony to document the reconstrucpopula-tion process after the 2012 earthquake. In the following sections, the aftermath of the 2012 NIE is described through information found in the journal. Issues from August 2012 to December 2019 are analysed. Issues will be referenced using the notation CC XX/YYYY, where CC stands for Concordia Comune, X is the issue number and YYYY is the year of publication. All issues may be retrieved at the journal website (Municipality of Concordia sulla Secchia 2019) (in Italian). The description of the reconstruction is divided into four main sections, following the four dimensions of the community resilience framework as defined by Bruneau et al. (2003): (1) technical dimension, related to the physical system; (2) organizational dimen-sion, related to the public administration; (3) social dimendimen-sion, related to the population and its needs; and (4) economic dimension, related to the businesses.
3.2 Technical dimension of community resilience
Concordia sulla Secchia was the second most affected city by the 2012 NIE (CC 2/2012) in terms of damage. The earthquake severely hit not only homes but also public buildings such as the Town Hall, the Police Station, the main Theatre and Library, several schools, churches and the city Monumental Cemetery. Building damage pointed out the fragility of structures that dated back mostly to before the World War II, thus were designed without considering the necessary earthquake-resistant design concepts. More specifically, the vast
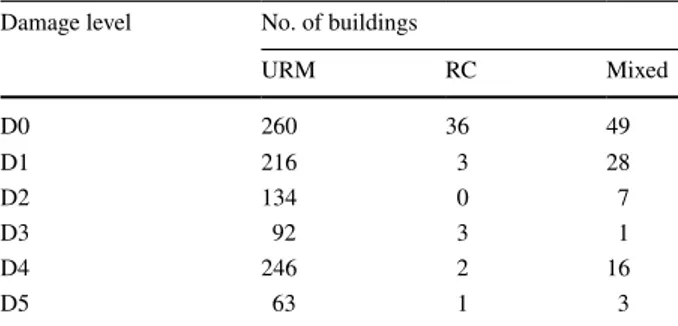
majority (87%) of buildings in Concordia sulla Secchia are made of URM and most of them are built before 1919. Remaining buildings are mainly made of RC (4%) or mixed structure (9%) and were built between 1946 and 1981. Information about the built environ-ment are retrieved from the Da.D.O. platform (Dolce et al. 2017) available online (Eucen-tre 2019). Da.D.O is a web-GIS platform created by the non-profit Eucentre foundation in collaboration with the Italian Civil Protection Department. The platform has collected damage assessment data due to seismic events since the 1976 Friuli earthquake. For the cities of Concordia sulla Secchia, the damage was assessed using the AeDES forms (Bag-gio et al. 2007) and is shown in Table 2 using the EMS-98 damage levels described in the Introduction. AeDES forms are used in the aftermath of an earthquake to assess the safety degree and damage level of the buildings. Conversion from the damage described in the AeDES forms to the EMS-98 damage levels has been done following the indications pro-vided by Rota et al. (2008) and Del Gaudio et al. (2017).
In many cases, provisional works to avoid collapse were introduced after the earthquake while few buildings had to be demolished (CC 3/2012) Most of the damage was located in the city-centre, see Fig. 2, where few buildings are still unusable, including the Town Hall and the main Theatre (as of the end of 2018, CC 4/2018).
3.3 Organizational dimension of community resilience
The widespread damage that involved also several public buildings required the Concordia sulla Secchia administration to take swift actions in order to guarantee the essential ser-vices. The “Red Zone”, i.e. the exclusion zone (Braga et al. 2015) due to extensive damage, was established by governmental agencies and volunteers took it in turns to patrol along-side the Army (CC 2/2012). Fear of looters is a common issue in the immediate aftermath of a disaster, even though it has been reported to happen very rarely (Tierney et al. 2006). The Red Cross and the Civil Protection Department established camps and shelters for the people displaced that lasted for almost 3 months (CC 3/2012). Family doctors were given a temporary location in a square near the city centre while a camp hospital was located in the nearby city of Mirandola (CC 2/2012) due to its larger population size. It is worth not-ing that all the residents of the areas affected by the earthquake received free medical care. Moreover, in less than 2 months after the earthquake, a temporary primary and secondary school were set-up in the area nearby the pre-school (CC 3/2012) that was not damaged. The City Council voted to increase the contribution to buy textbooks for low-income fami-lies (CC 5/2013).
Table 2 Damage distribution for buildings in Concordia sulla Secchia after the 2012 NIE (retrieved from Da.D.O. platform (Eucentre 2019))
Damage level No. of buildings
URM RC Mixed D0 260 36 49 D1 216 3 28 D2 134 0 7 D3 92 3 1 D4 246 2 16 D5 63 1 3
Once the first emergency phase was over, damaged buildings were assessed using the aforementioned AeDES forms (Baggio et al. 2007) (CC 2/2012) and homeowners could apply for repair/replacement funds using the MUDE platform. The amount of funds was increased from the initial 80% percentage of the expected cost (CC 2/2012) to the full cov-erage (CC 1/2013). The bureaucratic complexity and slowness in the applications’ process-ing by the City Council, probably due to the low personnel number, caused delays in the funding allocation and discontent in the population (CC 1/2013). This issue was reported in previous disasters worldwide (Browne 2013), and pointed once again to the need for simpler procedures for economic compensation after disasters. As of early 2020, more than 233 MIL € have been allocated for the reconstruction, of which 170.7 MIL € are already distributed (Regione Emilia Romagna).
The first major step of the city reconstruction began with the inauguration of the New Town Hall on July 2013 (CC 2/2013). The New Town Hall was included in a bigger project named “New Concordia” that included also the temporary commercial area “Parco Fiera”, a new K12 school institute, a new church, a new sports centre and all the PMARs for peo-ple displaced by the earthquake, see Fig. 3.
Little to no information is available on how citizens reacted to this big change in their city, and how they went through the necessary changes of habits and the reorien-tation process (Cox and Perry 2011). In the same year, the damaged Municipal Library became accessible again (CC 5/2013). In the following years, a new outpatient care (CC 1/2014) was built, the Red Zone was reduced (CC 3/2014), the Monumental Cemetery was Fig. 2 Damage after the 2012 NIE in the Concordia sulla Secchia city centre. Pictures taken on May 29th, 2016, 4th anniversary of the earthquake
reopened (CC 2/2017) and the school of music of the Municipal Band (CC 1/2017), venue of several concerts, became accessible again.
A crucial and symbolic step for the recovery was the dismantling and clean-up of the area assigned to the PMARs that started when the last household moved out (CC 3/2017). At the end of 2018, the reconstruction was considered to be almost over, especially for pri-vate buildings (CC 4/2018). In 2019, the Middle School (CC 1/2019) was also reopened, giving the possibility to over two hundred students to regularly attend their classes. How-ever, few works were still ongoing, such as the local Police Station (CC4/2019), while oth-ers have still to start, such as the rehabilitation of the old Town Hall and the main Theatre, as well as the renovation of the main square (CC 4/2018). Once these landmarks will be restored, the city will finally regain its identity (CC 3/2018).
3.4 Social dimension of community resilience
Concordia sulla Secchia experienced one casualty due to the 2012 NIE (CC 2/2012), while several hundred people were displaced. In the aftermath of the NIE, the people displaced lived in tent camps provided by the Civil Protection Department (CC 2/2012). On January 2013, 94 PMARs were given to Concordia sulla Secchia in order to accommodate 288 peo-ple (CC 1/2013), see Fig. 4. The last household to leave PMARs moved out in mid-2017, almost 4 years after the earthquake (CC 2/2017). Very little information is given on the life in a PMAR and the possible discomforts suffered by the population. The only highlighted issue concerns the accessibility of the PMAR area and the initial absence of a bike path (CC 3/2013).
In addition to PMARs, 756 households were granted the CAS (CC 5/2013) and, at the end of March 2019, a hundred households were still waiting to return to their homes. The trend of PMARs and CASs in the years after the earthquake is analysed in detail in Sect. 3. Fig. 3 New Concordia (right) and new commerical area (left) built after the 2012 NIE. Adapted from CC 1/2013
Few months after the earthquake, the population asked for supervised access to the Red Zone, in order to recover those personal belongings they were unable to take with them in the emergency phase, but also to regain familiarity with the city (CC 1/2013). Five months after the earthquake, the City Council decided to host the “All Saints’ Day Festival”, the most traditional celebration of the city, which takes place every year on November 1st (CC
3/2012). The community welcomed this decision as a slow return to normality after such a tragic event. The festival is a great tourist attraction, with approximately 30.000 peo-ple coming to Concordia sulla Secchia in 2013 (CC 4/2013) that gave a substantial and much needed boost to the city economy. Several other festivals were organized thanks to the efforts of city volunteer groups that provided free medical assistance to the community since the emergency phase (CC2/2012). The volunteers organized the traditional Christ-mas concert (CC4/2012) and hosted several fundraising events to support the reconstruc-tion (CC 2/2013). All these acreconstruc-tions proved essential in rebuilding the social capital, i.e. those feelings and networks of relationships that make a group of individuals a community (Aldrich and Meyer 2015).
At first, the City Council and the Mayor itself actively tried to include the community in the decision-making process of reconstruction, by promoting a series of focus groups where ‘All ideas will be listened to’ (CC 2/2013). Moreover, the population proposed a short list of fourteen actions to be taken in order to revitalize the city centre (CC 2/2014). However, debates and disagreements between the citizens and the City Council began 1 year after the earthquake (CC 5/2013), and the population felt that it was being used as argument for political campaign only (CC 3/2017). Eventually, a sense of exclusion from the decision-making process started to spread within the community (CC 4/2017). This issue highlights once again how citizen participation after a disaster should be incentiv-ized, as it is the key to achieve a successful recovery (Kweit and Kweit 2004). Moreover, the debate that sparked for the presence of an Islamic Centre in the PMAR area showed how cultural bridging (Beyer 1997) may be required in order to avoid discrimination of minorities.
3.5 Economic dimension of community resilience
The 2012 NIE affected small and large businesses alike. However, the timing of the recov-ery showed significant differences. For example, four major factories that provided jobs to Fig. 4 PMARs of Concordia sulla Secchia. Pictures taken on May 29th, 2016, 4th anniversary of the earth-quake
over 1900 people in both Concordia sulla Secchia and the nearby city of Mirandola had to close down only for few days or few weeks at most. These four factories quickly reopened after moving their stocks and activities to temporary tensile structures built in their parking areas (CC 1/2013). In addition, the owners saw the earthquake as an opportunity to rebuild their factories according to earthquake-resistant design concepts even more demanding than current code provisions. Yet, businesses experienced overall significant downtime which led to an approximate 30% decrease in revenues at the end of 2012, with estimated losses exceeding €5 billion, approximately equal to 4% of the Emilia-Romagna Region GDP (Barone et al. 2013). This aspect highlights how indirect losses may often times be comparable or even exceed direct losses due to natural disasters (Donà et al. 2019). Luck-ily, a multinational company specialized in mechatronics decided to establish its new head-quarters in Concordia sulla Secchia, with investments that were supposed to bring up to 500 new jobs in the city (CC 2/2014). It is reasonable to expect a great boost to the local economy by this important event. No study is currently available on the long-term losses of Emilia-Romagna large businesses due to the NIE, to the best of the authors’ knowledge.
As for small businesses, it took almost a year for the first activities in the city centre to reopen after the earthquake (CC 1/2013). Some decided to temporary business locations, or used their homes as shops (Martinelli et al. 2018). Others moved to the new “Parco Fiere” commercial area, see Fig. 3, built by the City Council as a mean to avoid or at least reduce business interruption (CC 2/2013). Before the earthquake, small businesses were already starting to adapt to changes in customers’ needs and preferences due to an ongoing eco-nomic crisis (Di Quirico 2010) that affected mostly historical city centres. For this reason, they showed a high level of adaptability to the drastic changes caused by the earthquake. At first, the help of suppliers, loyalty of consumers and cohesion among business owners gave the necessary relief to keep their activities open. No information about businesses asking others to continue the production in their place, i.e. outsourcing (see Donà et al. 2019) was found. Eventually, the earthquake was seen as an opportunity to boost new capabilities and create new business opportunities (Martinelli et al. 2018). Businesses located in the city centre continued to reopen even years after the earthquake (CC 2/2018), and new activities started as well (CC 2/2014).
The City Council put considerable efforts in promoting small businesses not only by constantly advertising the reopening of activities, particularly in the city centre, but also by assigning grants every year after the event ranging from €1.000 (CC 2/2016) to €20.000 (CC 4/2018) per activity. Few business owners reported issues with the many construction sites that limited accessibility and/or visibility to their activities (CC 3/2016). No study is currently available on the long-term losses of Emilia-Romagna small businesses due to the NIE, to the best of the authors’ knowledge.
4 Housing recovery: comparison of two case studies
As several years have passed since the 2012 NIE, analysing the trend of households in Concordia sulla Secchia either living in a PMAR or receiving the CAS can provide meaningful insights on the housing recovery process. Additionally, trends for Concordia sulla Secchia can be compared with those of the nearby city of Mirandola, also severely hit by the 2012 NIE. Mirandola has a population of approximately 23.800 people and it is chosen for the similar built environment and proximity to Concordia sulla Secchia. Mirandola has a town journal as well, the “Indicatore Mirandolese” (IM). All IM issues
may be retrieved at the journal website (Municipality of Mirandola 2019) (in Italian). Similarly to the CC, the IM documents the reconstruction process and provides signifi-cant information about the housing recovery.
Both the CC and the IM are issued by the respective Municipality, therefore they are reasonably considered a trusted source for the data collection. Moreover, they are found to be the only possible source of data on the housing recovery. In fact, Regional data-bases do not usually share information about the reconstruction process and, when some information is available, it is often incomplete or impractical to use.
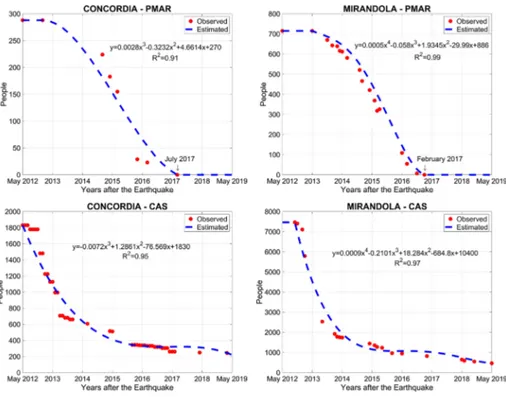
The housing recovery for Mirandola has already been examined in a previous study (Carnelli and Frigerio 2016), which is however limited to the PMARs in the September 2013–March 2016 period. In this paper, both PMAR and CAS observed values are col-lected from May, 2012 (occurrence of the NIE) to May, 2019, and are shown in Fig. 5
(red-dotted).
As the data are not provided at regular time intervals but are scattered throughout the years, they are interpolated in order to obtain continuous values. The interpolations are shown in Fig. 5 as dashed blue lines. The interpolation is performed using third degree and fourth degree polynomial functions. The polynomial functions are seeked so that they reach the best fitting of the observed values. The obtained trends are monotonic decreasing in the considered period. The goodness of fit is evaluated through the coef-ficient of determination (Rao 1973) ( R2 ). Emphasis is given to the end values of PMAR
Fig. 5 Observed (red-dotted) values of PMAR and CAS for Concordia sulla Secchia and Mirandola and (dashed blue line) interpolated trends
for both Concordia sulla Secchia and Mirandola, as they become zero before the end of the considered time period.
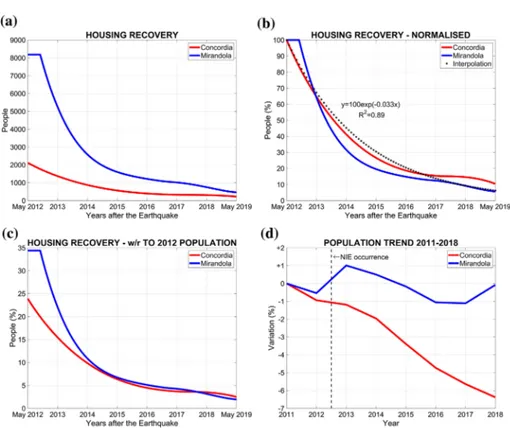
Once the curves of PMAR and CAS are derived, values are summed together providing what is considered in this study as housing recovery, that is the trend of people returning to a permanent housing solution, either because they moved out of a temporary shelter or because they do not require a housing contribution anymore. It is worth noting that people who decided to move out of the city permanently from Concordia sulla Secchia and Mirandola after the 2012 NIE are not included in Fig. 5, as no information was found in the municipal journals or other sources. Values of the housing recovery for Concordia sulla Secchia and Mirandola are shown in Fig. 6.
In Fig. 6a, it is possible to observe that the housing recovery evolutions for Concordia sulla Secchia and Mirandola reach comparable values in May 2019, despite the former had almost four times the number of people displaced, either living in a PMAR or needing a CAS. To better analyse this aspect, the dimensionless housing recovery curves are reported in Fig. 6b, showing fairly similar trends. Dimensionless curves of Fig. 6b are used to obtain the following simple general equation of housing recovery (dotted curve in Fig. 6b):
(8) y = 100 ⋅ e−0.033x
Fig. 6 Housing recovery for Concordia sulla Secchia and Mirandola (a); housing recovery adimensional (b); housing recovery normalised to the respective 2012 population size (c); and population variation in the 2011–2018 period (d)
where y is the percentage of the population still displaced the x-th month after the event. Using Eq. 8 allows predicting when the housing recovery can be approximated to zero (given the exponential form) for both cities, meaning that the population will have com-pletely returned to a permanent housing. Such time is estimated as 161 months (or 13 years and 5 months) after the earthquake. Other studies of the housing recovery process after the 2009 L’Aquila earthquake in Italy (Mannella et al. 2017) and the 1992 Hurricane Andrew (Zhang and Peacock 2009) or 2014 South Napa Earthquake (Kang et al. 2018) in the United States showed trends that can be comparable with an exponential curve. Nonethe-less, more case studies affected by the 2012 NIE should be investigated in order to validate the approach used in this work.
To better understand the reason for the differences in the housing recovery of the two cities, different aspects are herein considered. At first, the curves in Fig. 6a are normalised to the respective population size in 2012, when the earthquake occurred (see Fig. 6c). It is noticed that the housing recovery curve for Mirandola rapidly decreases until the begin-ning of 2014, and it overlaps with the curve for Concordia sulla Secchia thereafter. For this reason, the population variation of both cities is examined. Data are retrieved from the Italian National Institute of Statistics (ISTAT) website (Istat 2019), and are subsequently normalised to the initial population value (see Fig. 6d). Data are showed for the 2011–2018 period. It is observed that the population of Concordia sulla Secchia saw an approximate 6% decrease, while the population of Mirandola remained almost unchanged. However, this difference is not believed to be significant enough to influence the housing recovery. In addition, the population of Concordia sulla Secchia was already decreasing before the occurrence of the NIE (May 2012), thus the negative trend may be related to different causes than the earthquake.
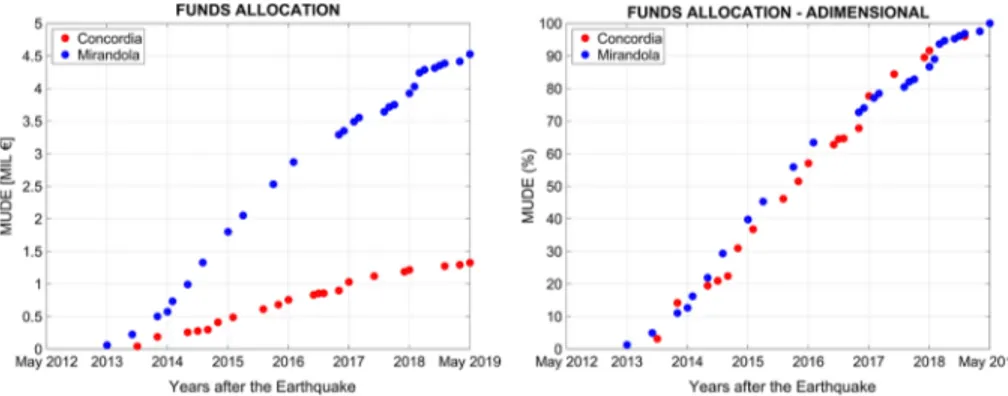
Next, the pattern of the repair/replacement funds allocated through the MUDE platform is examined. Data are retrieved from the CC and IM issues and are shown in Fig. 7.
Values of the allocated reconstruction funds are made dimensionless with respect to the last MUDE data of the considered period (May 2012–May 2019) in order to compare the timing of the allocation. Both cities had comparable trends in the funding allocation, thus explaining the similarity of the housing recovery.
Finally, the level of earthquake damage in both cities is examined. Data are retrieved from the Da.D.O database (Dolce et al. 2017; Eucentre 2019) and are shown in Fig. 8 using the EMS-98 damage scale.
Fig. 7 Allocated MUDE funds for Concordia sulla Secchia and Mirandola (left) and dimensionless curves (right)
The percentage of URM buildings in Concordia sulla Secchia is slightly higher than in Mirandola, while the latter has a higher percentage or RC buildings. Moreover, Concordia sulla Secchia has a higher percentage of buildings with high damage ( D4 ) while Miran-dola has a higher percentage of buildings with no damage ( D0 ). It is reasonable to assume that the higher presence of URM buildings corresponds to higher percentage of damaged structures due to the higher seismic vulnerability of this structure typology. In addition, the lower level of damage reported in Mirandola allowed the rapid initial decrease of the housing recovery curve, because undamaged buildings granted access for immediate re-occupancy after the post-earthquake inspection. On the other hand, more damaged build-ings ( D4 or D5 ) will need extensive work to be repaired or demolished/replaced.
5 Seismic mitigation at the urban scale
After the discussion on the damage suffered by Concordia sulla Secchia and the ensuing reconstruction process and housing recovery, this section presents a “what-if” scenario in which preventive mitigation strategies are implemented. This study investigates the effec-tiveness of strengthening works (SWs) in reducing seismic damage in both URM and RC buildings. The buildings considered in the study are those included in the so-called Emer-gency Limit Condition (ELC) (Dolce 2012). The ELC is a sub-system of the city that is defined by the Italian Civil Protection Department for all municipalities. The ELC con-sists of all “strategic” buildings, i.e. hosting essential functions during emergencies (such as the Town Hall, the Police Station, etc.), as well as all “interfering” buildings, i.e. having at least one side facing emergency connection routes and whose failure could prevent the access or cause delays to the arrival of emergency vehicles and/or the population evacua-tion (Basaglia et al. 2018; Cara et al. 2018).
The ELC of Concordia sulla Secchia is made of 42 buildings: 8 are URM structures, 31 are RC structures and the remaining 3 are steel or mixed structures. All URM and 24 of the 31 RC buildings are also included in the so-called Minimal Intervention Unit (UMI), see Fig. 9. UMIs are damaged structures located in the city centre that are in aggregate sequence and present accessibility issues. Therefore, these buildings require additional efforts in identifying the most suitable SW(s).
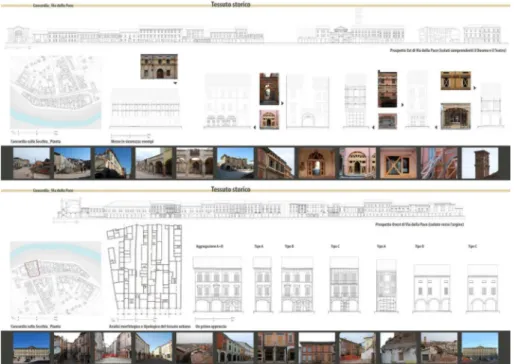
Geometrical and structural features of UMI buildings are available thanks to an extensive post-earthquake survey commissioned by the Emilia-Romagna Region to the Fig. 8 Structure typologies (left) and observed damage distributions (right) for buildings in Concordia sulla Secchia and Mirandola after the 2012 earthquake. Data from Da.D.O database (Eucentre 2019)
Labo.R.A. research group of the University of Ferrara (LABO.R.A. Unife 2013), see Fig. 10.
A previous study (Basaglia et al. 2018) used these geometrical and structural features to derive the IV and 𝜇D for all the buildings of the Concordia sulla Secchia ELC. The same
Fig. 9 Concordia sulla Secchia’s UMI (left, adapted from CC 12/2018) that is included in the ELC (right)
Fig. 10 Geometrical and structural survey of the Concordia sula Secchia UMI [courtesy of the Labo.R.A. research group of the University of Ferrara (LABO.R.A. Unife 2013)]
study included also the effect of URM buildings in aggregate sequence in the vulner-ability definition by modifying an existing approach (Formisano et al. 2015), as well as the seismic amplification effects in the damage estimation (Lagomarsino and Giovinazzi
2006). Estimated results were compared with the observed mean damage levels, showing a remarkable agreement and therefore validating the approach. The reader may refer to this publication (Basaglia et al. 2018) for a more detailed description of the method.
In the present work, the same approach is used but a set of SWs is included in the vulnerability definition. According to the current Italian Building Code (Ministero delle Infrastrutture 2018) and specifically to §C.8.4.3 of the “Instruction document to apply the updated ‘Technical Norms for Constructions 2018’” (Consiglio Superiore dei Lavori Pub-blici 2019), SWs are distinguished depending on whether they induce a variation of the structure’s stiffness and/or weight that is negligible or substantial. The impact of SWs is considered by modifying the GNDT form’s scores and parameters following the process discussed in detail in the following Sections. It is worth noting that the proposed SWs do not intend to represent an extensive portrayal of all possible mitigation strategies of general validity, but are selected based on the authors’ engineering judgment for the application to the URM and RC building typologies of Concordia sulla Secchia. The proposed SWs may be also applied to structures of similar characteristics located in urban centres of Italy or other countries.
5.1 Masonry buildings
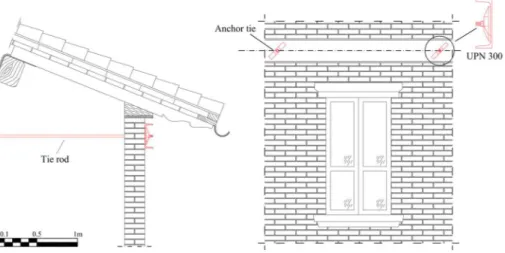
The survey of URM buildings carried out in the Concordia sulla Secchia ELC highlighted common structural deficiencies from the seismic point of view. One important issue is the absence of connections at the floor level. During a seismic event, the deficient connection between storeys and walls may lead to the activation of local failure mechanisms, as the “box-like behaviour” (Raka et al. 2015) is not guaranteed. In order to prevent this fail-ure mechanism, ring beams should be placed on the perimeter of all the floors. However, being all the URM buildings of the Concordia sulla Secchia ELC in aggregate sequence, only two sides are accessible (main façade and rear) while the others are bounded by the
adjacent constructions. For this reason, the combined “ring beam-tie rods” method is pro-posed, see Fig. 11.
Ring beams realized with steel profiles are placed externally at the floor level on two opposite free sides. The beams are connected together and to the masonry walls with steel tie rods. Tie rods can also be applied to link poorly connected orthogonal walls. The ring beam-tie rods technique leads to the change of Cvi class in two parameters (P) of the GNDT
forms: P1 (Type and organization of resisting system) and P9 (Roof system), as reported in Table 3. The ring beam-tie rods technique is applied to all URM buildings in the study sample. Average variation of the IV and 𝜇D for all URM buildings are reported in Tables 4
and 5.
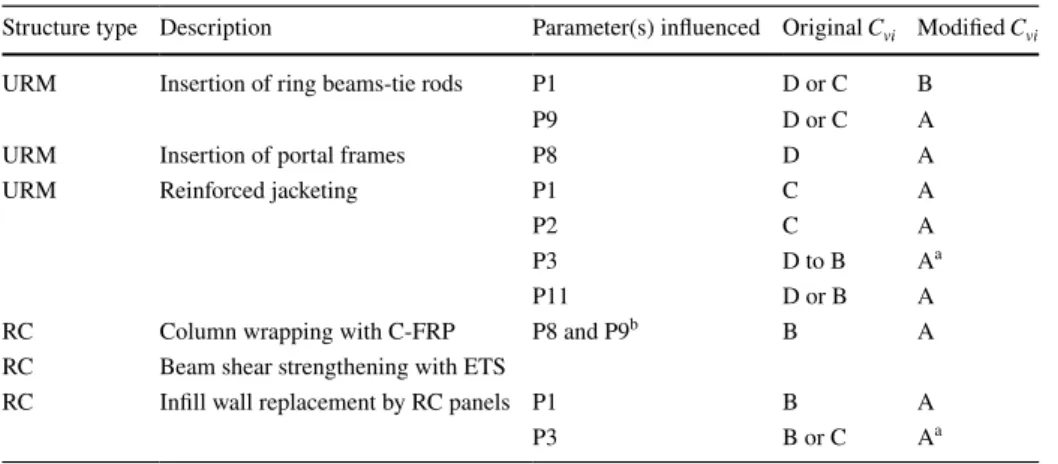
Another structural deficiency shared by URM buildings in the Concordia sulla Sec-chia ELC is the large span between parallel bearing walls. As a result, the orthogonal, Table 3 Variation of Cvi in URM and RC buildings due to proposed SWs
a Depends on the extent of applied reinforcement b Reinforcement techniques are applied together
Structure type Description Parameter(s) influenced Original Cvi Modified Cvi
URM Insertion of ring beams-tie rods P1 D or C B
P9 D or C A
URM Insertion of portal frames P8 D A
URM Reinforced jacketing P1 C A
P2 C A
P3 D to B Aa
P11 D or B A
RC Column wrapping with C-FRP P8 and P9b B A
RC Beam shear strengthening with ETS
RC Infill wall replacement by RC panels P1 B A
P3 B or C Aa
Table 4 Mean (min–max) values of IV and ΔIV for URM and RC buildings before/after the proposed SWs for the Concordia sulla Secchia UMI
a Strengthening works applied together
Structure type Description Before SW After SW
IV IV ΔIV (%)
URM Insertion of ring beams-tie
rods 54.3 (35.3–66.1) 48.7 (30–60.8) 10.6 (8–14.9)
URM Insertion of portal frames 54.3 (35.3–66.1) 52.5 (33.5–64.3) 3.4 (2.7–5) URM Reinforced jacketing 54.3 (35.3–66.1) 34.2 (19.9–44.4) 37.9 (28.4–47.6)
RC Columns wrapping with
C-FRP 43.1
a (25.2–60.4) 37.1a (20.1–50.4) 14.2a (9.5–22.2)
RC Beams shear strengthening with ETS
RC Infill walls replacement by
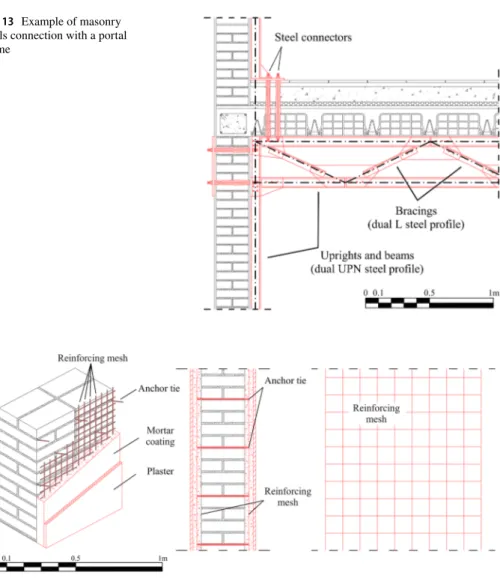
unrestrained walls (e.g. the grey wall in Fig. 12) are vulnerable to out-of-plane failure dur-ing a seismic event. In such cases, a possible solution is the introduction of portal frames that work as a bracing system, see Fig. 12. These frames are bolted to the sides of the walls and placed below the slab, see Fig. 13.
The above masonry walls connection with portal frames leads to the change of Cvi class
of P8 (Maximum distance between walls) as summarized in Table 3. The masonry walls connection with portal frames is applied to all URM buildings in the study sample. Aver-age variations of the IV and 𝜇D for all URM buildings are reported in Tables 4 and 5.
Due to the high vulnerability of URM buildings in the Concordia sulla Secchia ELC, additional reinforcement of the structural system is proposed through the application of the reinforced jacketing (RJ) technique (Corradi et al. 2014; Kouris and Triantafillou 2018). This technique consists in the application of a reinforcing mesh, made of steel or fibre-reinforced polymers, on each side of the existing masonry walls, later covered with a mortar coating, see Fig. 14. Prior to the mesh and mortar application, an accurate cleaning and sealing of exist-ing cracks, if any, is necessary. This particular intervention technique, also known as Textile Table 5 Mean (min–max) values of 𝜇D and Δ𝜇D for URM and RC buildings before/after the proposed SWs for the Concordia sulla Secchia UMI
a Strengthening works applied together
Structure type Description Before SW After SW
μD μD ΔμD (%)
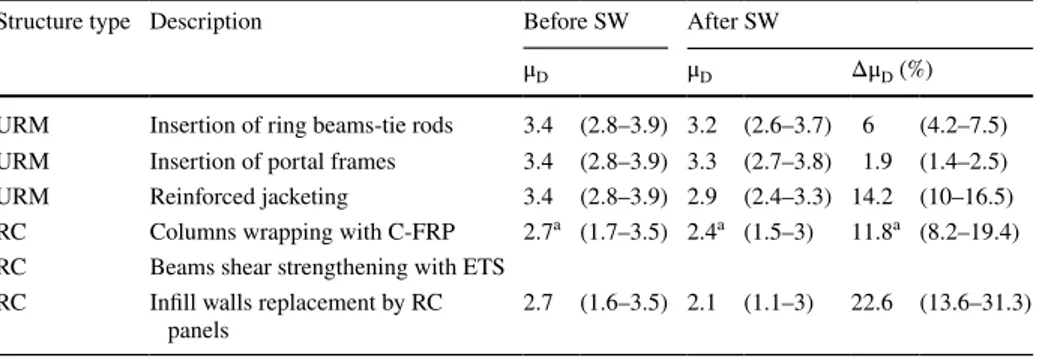
URM Insertion of ring beams-tie rods 3.4 (2.8–3.9) 3.2 (2.6–3.7) 6 (4.2–7.5) URM Insertion of portal frames 3.4 (2.8–3.9) 3.3 (2.7–3.8) 1.9 (1.4–2.5) URM Reinforced jacketing 3.4 (2.8–3.9) 2.9 (2.4–3.3) 14.2 (10–16.5) RC Columns wrapping with C-FRP 2.7a (1.7–3.5) 2.4a (1.5–3) 11.8a (8.2–19.4)
RC Beams shear strengthening with ETS RC Infill walls replacement by RC
panels 2.7 (1.6–3.5) 2.1 (1.1–3) 22.6 (13.6–31.3)
Reinforced Mortar (TRM) was extensively applied for damaged URM strengthening’s works during post-earthquake reconstruction since it have been proved to be extremely effective if properly applied (Gulinelli et al. 2019).
In the GNDT form, P3 (Conventional Strength) requires specification of the building piers’ cross section areas resisting the horizontal (seismic) forces. The introduction of the RJ requires a distinction between the cross section of the existing masonry wall and of the rein-forcing mortar. The GNDT form is thus updated as shown in Fig. 15. The resisting areas of the masonry wall and of the RJ are defined separately and then homogenised using Eq. 9:
(9) ATOT=AURM+n ⋅ ARJ=AURM+
ERJ
EURM
⋅ ARJ
Fig. 13 Example of masonry walls connection with a portal frame
where AURM and ARJ are the cross section areas of the masonry walls and the reinforced
jacketing, and n is the homogenization coefficient equal to the ratio between the Young’s Modulus of the masonry, EURM , and of the RJ, ERJ . The evaluation of the parameters EURM
and ERCJ , as well as of the increased tangent strength, 𝜏k , and weight, pm , are assigned
following the GNDT Manual provisions (Gruppo Nazionale per la Difesa dai Terremoti
1994b).
In addition to the updating of P3, the application of the RJ leads to the change of Cvi
class of P1 (Type and organization of the resisting system), P2 (Quality of the resisting sys-tem) and P11 (General maintenance condition) as reported in Table 3. The reinforced jack-eting technique is applied to all URM buildings in the study sample. Average variations of the IV and 𝜇D for all the URM buildings are reported in Tables 4 and 5.
5.2 RC buildings
Similarly to URM buildings, the survey of RC buildings in the Concordia sulla Secchia ELC pointed out common structural deficiencies from the seismic point of view. A recur-rent issue is the inadequate reinforcement of beams and columns that does not guarantee the strength and above all the ductility needed during a seismic event. For this reason, col-lapse due to brittle failures may occur. This is a commonly found issue in non-conforming RC buildings. One way to increase the ductility is increasing the shear strength of beams and columns, so that the risk of brittle failures is reduced. RC columns may be reinforced through a fibre-reinforced polymer (FRP) wrapping (Bousias et al. 2007). FRP wraps are extremely thin and light but have high tensile strength. Fibres are usually made of glass (G-FRP), carbon (C-FRP) or aramid (A-FRP). In particular, C-FRP are used to increase the confinement and the shear strengthening of columns (Ye et al. 2002). Hybrid tech-niques can also be applied in order to increase the cyclic ductility of columns (Perrone et al. 2009). At first, the concrete surface is accurately cleaned (removing the plaster, if Fig. 15 Proposed update of the
GNDT form for URM buildings to include the walls retrofitted with the reinforced jacketing
present) and smoothed, see Fig. 16. Moreover, corners of the column are rounded in order to improve bond and avoid fractures at the sharp corners. C-FRP sheets are then applied and covered with heat-resisting plaster, as the polymer may experience glass transition at temperatures higher than 70 °C.
RC beams may be reinforced through the embedded through-section (ETS) technique (Breveglieri et al. 2014, 2015) increasing their shear strength when they have insufficient stirrups. At first, a cover meter survey is needed in order to detect the existing rebar. Then, the bottom surface of the beam is exposed and additional steel or FRP rebars are embed-ded in the concrete through drilled holes that are later sealed with epoxy resin, see Fig. 17. The sealing process provides additional rebars with effective adherence to the surrounding material.
Applying both C-FRP wrapping of columns and ETS to beams leads to the change of Cvi
class of P8 (Connections and critical elements) and P9 (Low ductility elements) as reported in Table 3. The combined techniques of C-FRP wrapping of columns and ETS reinforce-ment of beams are applied to 16 of the 24 RC buildings in the study sample, as the remain-ing construction units did not present this structural deficiency. Average variations of the IV
and 𝜇D for strengthened RC buildings are reported in Tables 4 and 5.
In some cases, it may be necessary to significantly increase the strength and stiffness of RC structures. In order to do so, masonry infill walls may be replaced by RC panels con-nected to the existing structure (Sucuoğlu and Karageyik 2011), see Fig. 18. The lateral load resisting system is thereby changed from frame to wall or mixed wall-frame system. Fig. 16 Example of RC column
reinforcement with C-FRP wrapping
The introduction of shear walls is balanced on the opposite sides of each considered build-ing, in order to prevent a torsionally flexible behaviour (Thermou and Psaltakis 2018). To guarantee the transfer of the large lateral forces attracted by the walls to the foundation, micropiles or new foundations are usually necessary.
Replacing masonry infill walls with RC panels leads to a change of Cvi class of P1 (Type
and organization of the resisting system) and P3 (Conventional strength) as summarized in Table 3. The infill walls replacement technique is applied to all RC buildings in the study sample. Average variation of the IV and 𝜇D for all RC buildings are reported in Tables 4
and 5.
5.3 Vulnerability, damage and performance assessment
Table 3 shows the summary of Cvi changes due to SWs applied to URM and RC buildings
of the Concordia sulla Secchia ELC. In addition, the structural type of buildings within the UMI and the difference in application of SWs (for RC buildings only) is showed in Fig. 19.
It is worth noting that the variation of Cvi for Parameter 3 (Conventional Strength) has
been calculated based on the area of walls strengthened by the reinforced jacketing or the infill walls replacement, for URM and RC buildings respectively. For the other SWs, the change of Cvi has been assumed a priori based on the indications provided by the GNDT
manuals (Gruppo Nazionale per la Difesa dai Terremoti 1994b, c). Therefore, the actual change in the structural vulnerability related to these SWs should be validated by numeri-cal analyses.
Using Eq. 2, the IV for URM and RC buildings of the Concordia sulla Secchia UMI is
evaluated again to include the effect of SWs. The mean and min/max values of IV before
and after SWs along with the variation, ΔIV , are listed in Table 4. The vulnerability
index IV is then used to predict the variation in the expected mean damage grade, 𝜇D ,
due to the 2012 NIE, see Eq. 3. Based on available geological surveys (Tertulliani et al.
2012) an earthquake intensity IEMS−98= 7.5 is used. The mean and min/max values of
𝜇D before and after SWs along with the variation, Δ𝜇D, are listed in Table 5.
Average variations ΔIV and Δ𝜇D listed in Tables 4 and 5 show that the first two
pro-posed SWs on both URM and RC structures (typically considered as “local SWs” in Italy) lead to a modest reduction in vulnerability and damage. On the other hand, the third SWs for both URM and RC structures (typically considered as “global SWs” in Italy) lead to substantial reductions of vulnerability and damage. While the results for global SWs seem reasonable as they can significantly improve the seismic behaviour, the current version of the GNDT forms may not correctly represent the positive effect given by local SWs. In fact, it is well known that local SWs aimed at enhancing the box-like behaviour in existing URM buildings (such as installing tie rods or restraining the out-of-plane mechanisms in walls) may lead to a considerable improvement of the overall seismic behaviour. Therefore, it is recommended that future studies will focus on updating the scores and weights of the GNDT forms, in order to represent more pre-cisely the benefits provided by locals SWs in both URM and RC buildings. Figure 20
shows the damage map with and without the proposed SWs for the Concordia sulla Sec-chia UMI with respect to the intensity of the 2012 NIE.
Applying the beta distribution as described in the Introduction, see Eqs. 5–7, the 𝜇D
values of the UMI buildings in the Concordia sulla Secchia UMI are used to derive the damage probabilities, P(Dk) , with and without the proposed SWs. Their graphical rep-resentation for increasing earthquake intensities, referred to as fragility curves (Porter Fig. 19 Structure type
identifica-tion and differences in the appli-cation of proposed SWs (for RC buildings only) of the Concordia sulla Secchia UMI
2015), is shown in Fig. 21. These fragility curves are related to the mean IV of the URM
and RC buildings examined. It is worth noting that the change in shape for intensities IEMS−98< 7 is due to the corrective factor f (IEMS−98, V
)
of Eq. 3.
Fig. 20 Damage levels’ distribution for the buildings in the Concordia sulla Secchia UMI (left) without and (right) with the proposed SWs, with respect to the 2012 NIE intensity
Fig. 21 Fragility curves without and with the proposed SWs for (left) URM and (right) RC buildings of the Concordia sulla Secchia UMI
Damage probabilities, P(Dk) , can also be used to estimate the number of casualties, injuries and people displaced by a seismic event. Despite numerous studies have been investigating the relationship between building damage and social impact (Spence et al.
2011), significant effort is still needed. The 2012 NIE caused only few casualties but a significant number of people displaced. For this reason, only the latter aspect is consid-ered in this work. For each building, the expected number of people displaced is esti-mated using Eq. 10 (Bramerini et al. 1995):
where P(D3) , P(D4) and P(D5) are the probabilities of experiencing damage levels D3 , D4 and D5 , respectively, and Noccupants is the number of buildings’ occupants. The aver-age daily occupancy provided by the post-earthquake survey (LABO.R.A. Unife 2013), see Fig. 22, is used in Eq. 10. Then, Fig. 23 shows the variation of people displaced for increasing earthquakes intensities. Two different risk mitigation scenarios are considered: without the application of SWs, and with the application of proposed SWs.
It is possible to observe that applying SWs significantly reduces the expected number of people displaced. More specifically, for the intensity of the 2012 NIE, the reduction can reach 84% when the proposed SWs are applied. Unfortunately, no information is provided on the number of displaced people at the parcel level for Concordia sulla Sec-chia in either the CC or the Da.D.O. database used. Therefore, it is not possible to com-pare the estimated values of people displaced for the UMI with the actual one.
(10) Ndisplaced= [0.4 ⋅ P(D3) + 0.6 ⋅ P(D4) + 0.7 ⋅ P(D5)] ⋅ Noccupants
Fig. 22 Number of occupants for the Concordia sulla Secchia UMI (LABO.R.A. Unife 2013)
As previously stated, buildings of the UMI belong also to the city’s ELC. In the ELC, all elements (strategic and interfering buildings) have to function properly in order to guarantee the overall performance of the system. In fact, the failure of a single element will cause the failure of the whole system that, in this case, is associated to the impossi-bility of carrying out the rescue activities/evacuation procedures in a timely manner. For this reason, the ELC is reasonably represented by a series system configuration (Basa-glia et al. 2018; Cara et al. 2018). For this reason, it is meaningful to assess the survival probability of the ELC to a major earthquake. The survival probability of a series sys-tem is evaluated using Eq. 11 (Pinto et al. 2004):
where Pe is the failure probability of the e-th element of the ELC. In the case of the ELC,
Pe is computed as the sum of damage probability(ies) P(Dk) above a defined maximum
damage level Dmax that the e-th building can experience given its function. For a strategic
building, it is assumed that it has to withstand only negligible damage ( Dmax=D2 ), and
for interfering building it has not to endure partial or total collapse ( Dmax=D4 ). It is worth
noting that, being the damage probability derived from the vulnerability index through the mean damage grade (see Eqs. 5–7), P(Dk) of URM buildings takes into account the effect of being in an aggregate sequence, thanks to the five additional parameters as described in the Introduction, while it is not considered for RC ones. More details can be found in Basa-glia et al. (2018).
Assessing the survival probability of the ELC is useful not only to evaluate the effectiveness of proposed risk mitigation strategies, but also to provide a simple and clear value that represent the overall urban system performance to a seismic event. The survival probability for buildings of the Concordia sulla Secchia ELC is shown in Fig. 24, for increasing earthquakes intensities and the different risk mitigation scenarios described above.
It is possible to observe that, when the proposed SWs are applied, the Concordia sulla Secchia ELC has an 85% survival probability with respect to the intensity of the 2012 NIE. (11) P[survival] = 1 − P[failure] = n ∏ e=1 (1 − Pe) = n ∏ e=1 ( 1 −∑P(Dk > Dmax)e ) Fig. 23 Estimation of people
displaced for the Concordia sulla Secchia UMI with/without the application of proposed SWs for earthquakes of increasing intensities
5.4 Cost–benefit analysis
In order to evaluate the impact of mitigation strategies at the urban scale, reconstruc-tion costs for the Concordia sulla Secchia ELC with/without SWs are compared, with respect to the expected damage for the 2012 NIE. The costs of applying proposed SWs to URM and RC buildings is determined using the nominal costs (VAT excluded) pro-vided by the Bill of Quantity (BOQ) for the Emilia Romagna Region (Regione Emilia Romagna 2011).
Table 6 lists the average SWs costs per building and square meter.
Repair/replacement costs following earthquake damage are assumed according to a recent survey (Di Ludovico et al. 2017a, b; De Martino et al. 2017) carried out in the Fig. 24 Survival probability for
the Concordia sulla Secchia ELC with/without the application of proposed SWs for earthquakes of increasing intensities
Table 6 Mean costs per building and square meter of SWs
Structure type Description Mean cost per
build-ing (€) Mean cost per m2 (€)
URM Insertion of ring beams-tie rods 16,397 31
URM Insertion of portal frames 3908 8
URM Reinforced jacketing 80,621 129
RC Columns wrapping with C-FRP 54,312 121
RC Beams shear strengthening with ETS 28,102 58
RC Infill walls replacement by RC panels 34,454 52
Table 7 Assumed nominal
repair/replacement costs Mean damage grade 𝜇D Nominal costs (Euro/ m2) 0–1 27 1–2 135 2–3 405 3–4 810 4–5 1350
city of L’Aquila hit by a major earthquake in 2009. Repair/replacement costs depend on the building’s mean damage level, 𝜇D , and are listed in Table 7.
Total costs are finally compared between the two considered scenarios (with/without the application of proposed SWs) and the results are summarized in Table 8.
From Table 8, it is observed that applying the proposed SWs leads to a substantial increase of the ELC survival probability compared to the scenario where no SWs are applied, a reduction of the estimated people displaced and a significant savings in terms of reconstruction costs. For this reason, the final decision on which strategy do adopt has to be taken by the City Council, depending not only on the available monetary resources but also on what is considered an acceptable level of loss. To this end, more rigorous risk anal-yses, which the seismic hazard [i.e. the probability of occurrence and its uncertainties (Var-gas et al. 2013; Lagomarsino and Cattari 2015)], could be useful to support the findings of this study. Moreover, the above comparison only includes the earthquake direct losses related to buildings’ damage. Indirect losses include also the possible social and economic impact. The main aim of mitigation strategies is to reduce the loss of lives and displaced people. The latter, in particular, has been of peculiar relevance for the NIE, with more than 20,000 families who required alternative housing (Dolce and Di Bucci 2017). If the hous-ing recovery costs were included, along with the decrease in business revenues, it would be reasonable to expect that scenarios with SWs would lead to significantly higher savings.
6 Summary and conclusions
The 2012 NIE had a significant impact on both the social and the economic lives of the affected communities. High number of people displaced and widespread damage to busi-nesses were serious issues for the recovery of communities. The documented recovery process of Concordia sulla Secchia, a city affected by the seismic event, highlighted the positive and negative aspects faced by communities in the short and long term. At first, the synergy between City Council, the economic sector and nongovernmental organizations provided a great push to the recovery. More specifically, the presence of major factories that limited the business interruption to few days or weeks was of paramount importance for workers, who kept their jobs and their salary to provide for the family needs, and for the city to prevent or limit depopulation. Great efforts were put in maintaining the city tradi-tions, such as the yearly “All Saints’ Day” festival, in order to regain a sense of normality in the life of the community. However, businesses still faced losses of revenue that are yet to be determined. Moreover, several households are still waiting to return to their homes as Table 8 Cost–benefit analysis
with/without the application of proposed SWs
Without SWs With SWs
SW cost (MIL €) – 4.16
Reconstruction cost (MIL €) 11.91 3.53
Total cost (MIL €) 11.91 7.69
Savings with SW (MIL €) – 4.22
Savings with SW (%) – 35.43
People displaced (–) 32 5
citizens gradually feel a stronger disconnection with the City Council, as their role in the decision-making process of the reconstruction keeps decreasing years after the earthquake. Finally, drastic changes to the city layout had to be made, and the restoration of important landmarks is still ongoing years after the event.
The paper also shows that the preventive adoption of seismic risk mitigation strategies continues to be the most effective measure to reduce damage and short-to-long term losses. A simulation on Concordia sulla Secchia considered a set of mitigation strategies and their effects on a small subsystem of the city. The comparison of the scenario with and without SWs showed a significant reduction in the expected damage with respect to the 2012 NIE intensity, and substantial monetary savings in the reconstruction costs. Nevertheless, more case studies and different earthquake scenarios should be analysed in order to generalize the obtained results, possibly including other SWs not considered in this work.
The promotion of seismic risk mitigation strategies has clearly become of paramount importance. The Italian Government has recently introduced a tax break in 5 years of up to 85% of the structural reinforcement or retrofit costs (the so-called Sisma-bonus). However, communities may not have the sufficient knowledge or will to understand the benefits of mitigation strategies. Communities already showed their willingness to actively participate in the risk assessment and mitigation process (Newport and Jawahar 2003; Cadag and Gail-lard 2012; Grigoratos et al. 2018). For this reason, it is a duty of institutions and academia to continue raise risk awareness and actively cooperate with communities in agreeing on proper mitigation strategies able to prevent future losses (Stoppa and Berti 2013). The GNDT forms could be a powerful tool to preventively assess the efficacy of different miti-gation strategies and suggest a set of possible solutions to communities. Yet, future studies should focus on a major update of the forms so that the effect of SWs can be evaluated more realistically in terms of reduction of vulnerability and expected damage. This updated should be based on risk analyses, accurately modelling the structural behaviour and includ-ing the probability of occurrence of the earthquake hazard and its uncertainties.
Acknowledgements Open access funding provided by Universitegli Studi G. D’Annunzio Chieti Pescara within the CRUI-CARE Agreement. This work was supported by the FAR funding of the University of Ferrara, 2015, “Historical Centers Livable and Sustainable” (HC-LIVE)” and by the scholarship of the Uni-versity “G. D’Annunzio” Chieti-Pescara, 2019, “Risk Assessment of the Built Heritage at the Urban Scale” (Ref. Num. 0002299). The fourth Author would like to acknowledge the Ministry of Science, Innovation and Universities (MCIU) of the Spanish Government, the State Agency of Research (AEI), and the Euro-pean Regional Development Fund (ERDF) through the SEVERUS project (Multilevel evaluation of seis-mic vulnerability and risk mitigation of masonry buildings in resilient historical urban centres, Ref. Num. RTI2018-099589-B-I00).
Open Access This article is licensed under a Creative Commons Attribution 4.0 International License, which permits use, sharing, adaptation, distribution and reproduction in any medium or format, as long as you give appropriate credit to the original author(s) and the source, provide a link to the Creative Com-mons licence, and indicate if changes were made. The images or other third party material in this article are included in the article’s Creative Commons licence, unless indicated otherwise in a credit line to the material. If material is not included in the article’s Creative Commons licence and your intended use is not permitted by statutory regulation or exceeds the permitted use, you will need to obtain permission directly from the copyright holder. To view a copy of this licence, visit http://creat iveco mmons .org/licen ses/by/4.0/.
References
Agenzia delle Entrate (2019) Sisma Bonus: Le Detrazioni per gli Interventi Antisismici. https ://www.agenz iaent rate.gov.it/. Accessed 10 Dec 2019