/DEPARTMENT OF MEDICAL BIOTECHNOLOGY
DOCTORAL THESIS IN MEDICAL BIOTECHNOLOGY
CYCLE XXXIII
COORDINATOR: PROF. LORENZO LEONCINI
TITLE OF THESIS:
INVESTIGATING CLINICALLY RELEVANT METHODS OF ASSESSING THE QUALITY OF THREE-DIMENSIONAL SURFACE SCAN DATA IN DENTISTRY
SCIENTIFIC-DISCIPLINARY SECTOR: MALATTIE ODONTOSTOMATOLOGICHE MED/28
PhD STUDENT:
CECILIE ANNETH OSNES
SUPERVISORS:
PROF. MARCO FERRARI DR ANDREW KEELING
Academic Year in which the PhD was awarded: 2021
2
Declaration of own work
The candidate confirms that the work submitted is her own, except where work which has formed part of jointly-authored publications has been included. The contribution of the candidate and the other authors to these works have been explicitly indicated below. The candidate confirms that appropriate credit has been given within the thesis where reference has been made to the work of others.
X
Cecilie A Osnes PhD student
3
Contributions
Chapter 2: Full arch precision of six intraoral scanners in vitro
C. Osnes: Design of the research project, data acquisition, data processing, analysis and interpretation, drafting and manuscript completion
J. Wu: Statistical analysis
P. Venezia: Data acquisition and manuscript completion
M. Ferrari: Design of the research project, data acquisition and manuscript completion A. Keeling: Design of the research project, analysis and interpretation, manuscript completion
Chapter 3: Investigating three methods of assessing the clinically relevant trueness of two intraoral scanners
C. Osnes: Design of the research project, data acquisition, data processing, analysis and interpretation, drafting and manuscript completion
J. Caplan: Data acquisition and manuscript completion
M. Ferrari: Design of the research project and manuscript completion
A. Keeling: Design of the research project, analysis and interpretation, manuscript completion
Chapter 4: Sources of Error in Maximum Intercuspation from Complete Dentate Full Arch Intraoral Scans in vitro
C. Osnes: Design of the research project, data acquisition, data processing, analysis and interpretation, drafting and manuscript completion
J.Wu: Statistical analysis
T. Joda: Design of research project and manuscript completion M. Ferrari: Design of the research project and manuscript completion
A. Keeling: Design of the research project, analysis and interpretation, and manuscript completion
Chapter 5: Optimal Use of Physical Centric Relation Records for Digital Workflows C. Osnes: Design of the research project, data acquisition, data processing, analysis and interpretation, drafting and manuscript completion
J. Patel: Design of research project, data acquisition, and manuscript completion A. Wagstaff: Data acquisition and manuscript completion
A. Keeling: Design of the research project, analysis and interpretation, and manuscript completion
4
All custom software credited to Leeds Digital Dentistry was written solely by Andrew Keeling, but collaboratively developed by CO and AK.
This copy has been supplied on the understanding that it is copyright material and that no quotation from the thesis may be published without proper acknowledgement.
5
Abstract
Title: Investigating clinically relevant methods of assessing the quality of three-dimensional
surface scan data in dentistry
Motivation:
Having an awareness of the quality of three-dimensional (3D) scan data produced by a dental scanner can affect the clinician’s treatment plan, and potentially whether they choose to invest in a 3D scanner for clinical use. Assessing the quality of 3D scan data can therefore be of great value both to practitioners and scanner manufacturers.
Statement of problem:
Assessing the quality of 3D data is a challenge; assessing the quality of 3D data for clinical use is even more so. As a result, there is no standardised method of assessing, or reporting, the quality of 3D data within the field of dentistry. This research aimed to investigate methods of assessing the trueness and precision of scanners with clinical application in mind.
Method and summary of publications:
This research resulted in four publications. All data collection was undertaken in vitro. Digital processing, measurements and analyses were all performed digitally, in most cases using automated methods.
Chapter 2 compares full arch edentulous scans produced by six intraoral scanners [IOS], with focus on identifying full arch error which may not be identified if analysed using commonly used methods such as measuring the mean distance deviation between a scan-pair. The proposed method suggests reporting the unsigned distance of the median value of the upper 1% most deviating aspect of a repeated scan.
Chapter 3 investigates three methods of analysing scan data produced by two IOSs, applying the upper-bound method presented in the previous chapter in a more approachable manner, by reporting the percentage of a scan deviating beyond 0.1mm. This paper also presents the use of a virtual key point method, by which topologically similar key points can be robustly identified across differing meshes.
The virtual key point method is further investigated in Chapter 4, in which the accuracy of the virtual occlusion of an IOS is investigated. By using virtual key points, the proportion of error
6
produced by the arch scan and the proportion of error which is introduced during the occlusion stage are identified.
Lastly, in Chapter 5 the key point method is used to investigate the precision of physical interocclusal records and the difference in precision between virtual articulation of dental models using un-clamped, scanned bite records, and traditional, manual articulation done by an experienced technician. Having determined the accuracy with which an IOS can record occlusion in the previous chapter, we use the same scanner to digitally record the technician’s manual articulations and, from there, identify the portion of error which was introduced by the manual articulation.
Results:
Chapter 2 finds that the upper-bound method may provide a clinically useful metric with which to gain an insight into the precision of full arch scans produced using different IOSs. The results indicate that three of the six scanners investigated would likely produce scans appropriate for clinical use where the full arch is required, while the latter three produced errors deviating beyond 0.3mm, hence proving to be unlikely to be appropriate for clinical use.
Chapter 3 concludes that the Primescan produces significantly truer scans than the Omnicam, regardless of the method used to analyse the scan data. Furthermore the ‘standard’ analysis method might incorrectly infer that Omnicam produced clinically acceptable full arch scans. The proposed novel methods, measuring the intermolar-width and proportion beyond 0.1mm, may give a clinically relevant insight into the quality of scan data. These novel analyses reveal clinically unacceptable limitations for Omnicam.
Our findings in Chapter 4 conclude that while the virtual bite records were relatively precise ((never deviating beyond 0.022mm) the error produced during the creation of the full arch scan negatively impacts the virtual occlusion.
Lastly, Chapter 5 indicates that the digital articulation method using un-clamped, scanned bite records is significantly more precise than the traditional articulation method when considering precision (or lack of dislocation) along the anteroposterior axis.
Discussion:
All papers, with the exception of Chapter 5, investigate aspects of IOSs ability to accurately record full arch scans. All investigations presented are in vitro; as a result one may assume the quality of in vivo scan data will be worse than the findings reported herein. Chapter 3, which investigates the quality of full arch data produced by the Omnicam and Primescan scanners,
7
highlights the importance of using the appropriate measurement method during investigation, as seen in Figure 3:2. Chapters 4 and 5 highlight the variable nature of digital methods, with the IOS virtual occlusion feature being negatively affected by error produced in the full arch scan, making the method less likely to be clinically reliable. Whereas the virtual method in Chapter 5 indicates that virtual articulation, using a high quality, clamp-less laboratory scanner is likely to reproduce articulation more precisely than traditional, physical methods.
Conclusion:
This thesis concludes that efforts to gain a clinically relevant insight into the quality of scan data are challenging. It finds finds that there is no one-size-fits-all when assessing 3D data in a clinically relevant manner but suggests some newer methods that go some way to addressing this.
Standard surface comparison methods, borrowed from Engineering and used extensively in dental research, almost invariably produce overly optimistic results. Given that dental audiences are generally less well versed in mathematical 3D analysis, there is a real risk that clinical applicability of some digital techniques may be advocated in error.
The findings also show that the quality of 3D data within digital dentistry varies widely. A paradigm shift from digital dentistry being considered as multiple methods all producing data and clinical work of similar quality, to digital dentistry being considered an umbrella term covering a spectrum of workflows, all of highly varying quality, is needed.
8
Acknowledgements
Thanks to Marco Ferrari for enabling me to do this research. Thanks, also, to all co-authors for your collaboration and endless patience all those times I caused yet another deadline to whoosh by.
9
List of Contents
Declaration of own work ... 2
Contributions ... 3 Abstract ... 5 Acknowledgements ... 8 List of Contents ... 9 List of Figures ... 11 1. Introduction ... 12 1.1. Intention ... 12
1.2. An introduction to 3D scanning in dentistry ... 14
1.2.1. Digital impressions ... 14
1.2.2. Digital methods of occlusion and bite registration... 16
1.2.3. Current methods for measuring scanner accuracy ... 18
1.2.4. The issue with standards ... 20
1.3. A brief introduction to 3D data and 3D scanners ... 23
1.3.1. Alignment in data generation and measuring ... 25
1.3.2. Summary of working with 3D data ... 30
1.4. Scope ... 31
1.5. Statement of problems ... 31
1.6. Aims, goals and objectives ... 32
1.7. Indication of research approach ... 32
1.8. Statement of contribution ... 33
1.9. List of references ... 35
2. Full arch precision of six intraoral scanners in vitro ... 43
2.1. Abstract ... 44 2.2. Introduction ... 45 2.3. Method ... 47 2.4. Results ... 48 2.5. Discussion ... 49 2.6. Conclusion ... 52 2.7. Figures ... 54 2.8. Appendix [Unpublished] ... 57 2.9. List of references ... 59
3. Investigating three methods of assessing the clinically relevant trueness of two intraoral scanners ... 61
3.1. Abstract ... 62
3.2. Introduction ... 63
3.3. Materials and methods ... 65
3.4. Results ... 66
3.5. Discussion ... 68
10
3.7. Figures ... 71
3.8. List of references ... 73
4. Sources of error in maximum intercuspation from complete dentate full arch intraoral scans in vitro ... 76
4.1. Abstract ... 76
4.2. Introduction ... 78
4.3. Materials and method ... 79
4.4. Results ... 81
4.5. Discussion ... 82
4.6. Conclusions ... 86
4.7. Figures ... 87
4.8. List of references ... 92
5. Optimal Use of Physical Centric Relation Records for Digital Workflows... 96
5.1. Abstract ... 97 5.2. Introduction ... 98 5.3. Method ... 101 5.4. Results ... 103 5.5. Discussion ... 104 5.6. Conclusion ... 106 5.7. Figures ... 107 5.8. List of References... 112 6. Discussion ... 114
6.1. Summary of work presented ... 114
6.2. Critical Reflection ... 115
6.3. The current state of full arch scanning and the effect of different measures of ‘accuracy’ ... 116
6.4. Underlying wand technology ... 117
6.5. The lack of acuity measurements of scan data ... 118
6.6. Contributions ... 122 6.7. Future Work ... 123 6.8. List of references ... 125 7. Conclusion ... 127 8. Appendix ... 130 8.1. Corrections ... 130
8.2. A summary of the automatic key point method... 130
8.3. Additional publications and presentations of relevance ... 133
8.4. Comprehensive list of references ... 137
11
List of Figures
Figure 1:1 Example of a scanner manufacturer specifying the accuracy of a dental laboratory scanner . 13
Figure 1:2 XKCD by Randall Munroe ... 22
Figure 1:3: Illustration simulating data acquisition in an intraoral scanner. ... 25
Figure 1:4: Illustrating the issue with global alignment... 27
Figure 1:5 Illustrating the difference between optimal digital and optimal clinical alignment ... 28
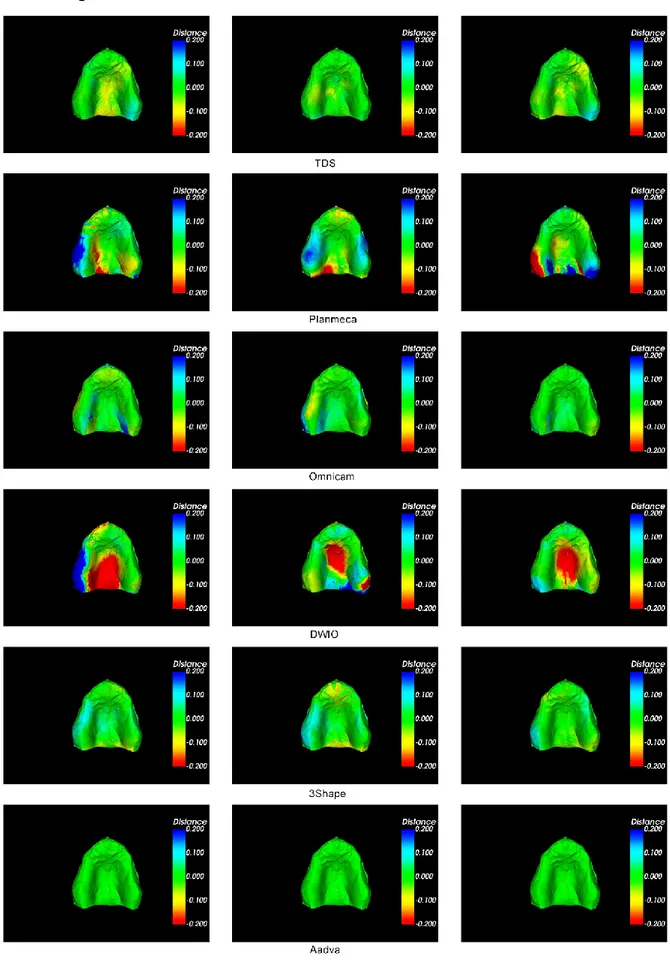
Figure 2:1 Colour map ... 54
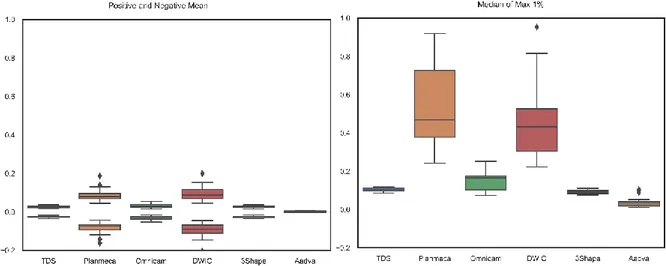
Figure 2:2: 2a Global positive and negative mean for each scanner. ... 55
Figure 2:3 Maximum 1% of each scan-pair measurement plotted. ... 55
Figure 3:1 Identifying anatomically identical keypoints ... 71
Figure 3:2 Three methods with which to measure scan accuracy. ... 72
Figure 3:3. Screencaptures displaying edge sharpening artefacts ... 72
Figure 4:1: The occluded model: Key point locations ... 87
Figure 4:2: Key point validation method used in experiment 1... 88
Figure 4:3: Intermolar distance error over the six IOS scans ... 89
Figure 4:4: Right molar inter-occlusal distances across the six scan groups ... 89
Figure 4:5: Left molar inter-occlusal distances across the six scan groups ... 90
Figure 4:6: Anterior inter-occlusal distances across the six scan groups ... 90
Figure 5:1: Variation in key point distance for all three key points... 108
Figure 5:2: Centric relation records ... 109
Figure 5:3: The cast scans having been articulated ... 109
Figure 5:4: Physical articulation (Traditional group only). ... 110
Figure 5:5: Articulated scans produced by the Omnicam ... 111
Figure 6:1 Visual comparison of acuity across a stone dental model and three scanners ... 120
Figure 8:1 Variation in position of vertices in scans ... 131
12
1. Introduction
1.1. Intention
Digital dental solutions have in recent years been adapted by clinicians and technicians across the globe. Intraoral (IOS) and indirect scanners, dental computer-aided design (CAD) packages, and millers and 3D printers (computer-aided manufacture, or, CAM) can all be used within the clinical workflow (Van Noort, 2012; Rekow, 2020; van der Zel, 2020).
The digital dental workflow always requires a data acquisition stage, where an impression is taken and this, or the consequent model, is 3D scanned. Alternatively, an intraoral scanner can be used to create a direct digital impression. (Or in some cases, such as for implantology, computed tomography scan data can also be used, but this is often in combination with higher resolution surface scan data). Once digitised, the scan data can be brought into a dental CAD package. Crowns, bridges, prosthetic implants, partial dentures, bite splints and retainers are just some of the devices currently commonly designed using CAD. The final design can then be manufactured through various methods, commonly milling for crowns and prosthetics, and 3D printing or vacuum forming for orthodontic appliances.
So, the first stage of any digital dental workflow is scanning the patient’s dental arch,
impression, or model. That the scan data is a true representation of the scan object is critical for the success of any clinical appliance, crown or prosthesis designed on this data. Most commercially available dental laboratory scanners cite a “certified” accuracy of <0.01mm or less (see Figure 1:1 Example of a scanner manufacturer specifying the accuracy of a dental laboratory scanner. The claimed accuracy of 0.004 mm might hold very little meaning to a clinician attempting to decide on the appropriate scanner for their use yet the literature commonly report scan errors ten times this distance (Keul and Güth, 2020, being but one example). This suggests that the methods and standards used by manufacturers to validate their devices do not align with the methods clinicians and researchers use to measure the data produced by the same device.
13
Figure 1:1 Example of a scanner manufacturer specifying the accuracy of a dental laboratory scanner. The claimed accuracy of 0.004 mm might hold very little meaning to a clinician attempting to decide on the appropriate scanner for their use, and rarely reflects the findings produced by academic studies investigating the accuracy of scanners.
Assessing and robustly measuring the trueness and precision1 of the data produced by a 3D scanner in a clinically relevant way is an actively investigated, but unsolved, problem. The most common method for assessing scanner accuracy, by aligning multiple scans and measuring the average distance deviation between scan-pairs, carries numerous risks and pitfalls in that it relies on correct global alignment; a computational problem with no single correct solution if the two scans are even remotely different (which will always be the case with scan data) (Güth et al., 2017; O’Toole et al., 2019a).
Taking the problem of relying on global alignments (also known as best fit alignment) and mean distance measurements as a starting point, this thesis aims to investigate methods of robustly assessing the ability of dental scanners to correctly record scan data, particularly with clinical application in mind.
The dimensional accuracy of full arch scans (Ender and Mehl, 2011; Ender et al., 2019), the accuracy of virtual bite registration (DeLong et al., 2002; Gintaute et al., 2020) and the quality of a scanned margin of a tooth preparation (Keeling et al., 2017) have been identified as key issues which could benefit from further investigation. In particular, this thesis will focus on the issues of full arch scan accuracy and occlusal accuracy, since these are fundamental to the
1 The combination of trueness and precision is from here-on referred to as accuracy, as according to BS
14
production of good quality digital study models, from which any future prosthodontic treatment can be planned and designed.
Gaining an awareness of the achievable quality of data within the clinical dental workflow would be of great advantage to clinicians when treating patients using digital solutions as well as to clinicians and dental technicians when investing in digital systems.
Being a laboratory-based, non-clinical research project, this work will focus on determining the quality of data which is technically achievable, and leave the task of determining the quality of data which is clinically necessary to future researchers.
1.2. An introduction to 3D scanning in dentistry
There are a handful of tangible differences between indirect scanners (often referred to as laboratory scanners) and intraoral scanners; solving the problem of identifying the location of 3D points in the real world is greatly complicated by not knowing the location of the sensor (normally a camera) which is collecting the information. As such, an intraoral scanner is faced with a greater computational challenge than a laboratory scanner, which can be calibrated to know the exact location of its sensors during manufacture. Additionally, intraoral scanners are used in the inherently challenging environment of the patient’s mouth, with moisture, fogging and optically complex surfaces such as enamel further adding to the challenge of collecting valid scan data. As a result, laboratory scanners are generally assumed to produce more accurate and higher quality (in terms of point density) data than intraoral scanners. All publications within this thesis (with some exception in the final publication) focus on intraoral scanners. It is worth noting that all the methods developed and explored herein could also be applied to data produced by indirect scanners, as many of the challenges in investigating scan data apply to all optical surface scanners, regardless of acquisition method.
1.2.1. Digital impressions
It is assumed that an intraoral scanner needs to produce digital impressions of similar quality to that produced by traditional impressions, or better. There is limited agreement as to how best to assess the quality of a digital impression. Further, there is limited data when it comes to determining the clinically required quality of an impression, be it digital or traditional, partly due to the lack of a standardised metric for assessing such qualities.
15
Investigations into the precision and trueness of IOSs have been undertaken regularly for the last decade. A 2011 study reported some IOSs to record full arch impressions more precisely than alginate impressions, but less precisely than silicone impressions (Ender and Mehl, 2011). A 2012 publication observed an increase in distortion across the arch, both in real world distance, and angulation distortion of the scan artefact, indicating that a single quadrant scan was likely to be more accurate than a full arch scan (van der Meer et al., 2012).
Many studies have concluded with similar findings since van der Meer et al.’s publication: that short distance scans, such as those required for single preparations or partial prostheses, may be acceptable (Syrek et al., 2010), but that IOSs fail to produce clinically acceptable full arch scans (Ender et al., 2015; Chochlidakis et al., 2016; Tsirogiannis et al., 2016; Ender et al., 2016; Ahlholm et al., 2018). Guth et al. found in their 2016 study that intraoral scanning systems showed similar or higher accuracy than conventional polyether impression with subsequent indirect digitalisation (Güth et al., 2016). Kuhr et al., on the other hand, reported the very same year that conventional polyether impressions, analysed by pouring of the model and measuring these with a coordinate measuring machine, were still truer than digital
impressions when performed in vitro (Kuhr et al., 2016). Mangano et al. concluded,
regardless of analysis method, that the 12 IOSs under investigation produced widely varying results when scanning implant impressions (Mangano et al., 2020).
It becomes apparent at this stage that the lack of agreement in methods used when
investigating the accuracy of scanners obfuscates the field, and that measuring 3D data can be done in many ways, all producing different results and, therefore, a lack of clarity.
Further, IOSs have not yet truly penetrated the market, and the user-group may be self-selecting to enthusiasts willing to invest in IOS. This is likely to result in studies investigating IOSs being instigated by investigators who may be biased towards digital solutions. To illustrate the tunnel-vision of the general digital audience: Dentsply Sirona’s flagship scanner at the time of writing, the Primescan, is heavily promoted based on the results presented in Ender et al.’s study from 2019; this study did in fact show that conventional silicone
impressions are still truer and more precise than all of the scanners investigated in the in vitro experiment, echoing their findings eight years prior (Ender et al., 2019).2
2 Further, with the study being in vitro, one may argue that the study favours IOSs by design: IOSs
perform better in vitro than under the challenges posed in vivo. Silicone, on the other hand, is designed to work in a slightly moist environment, and thus might, perversely, perform worse in vitro. It might be
16
One fact which does become clear through much of the literature, and as specifically
concluded by Mangano et al. in their 2020 publication, is that the quality of data produced by IOSs varies widely between devices. This is shown throughout the field and is reflected in this thesis.
While findings such as the conflicting views on the precision of conventional impressions in comparison to IOS could be the result of inconsistent methods of investigation and
measurement, these divergences could also be the result of using different laboratory scanners when scanning the impression/model against which to compare the IOS scans. The Ender et al. (2019) study used a 5-axis laboratory scanner to scan impressions. In contrast, the study which concluded that IOSs produced impressions of a similar or higher quality than conventional methods relied on an older 3-axis scanner (Güth et al., 2016). It may be the case that the inability of a scanner to produce full-coverage of the scan object will negatively affect any study using surface deviation as a metric: dental models are inherently complex shapes containing undercuts and crevices3; poor scan coverage, as result of limited range of freedom by the scanner, may result in holes. As well as negatively affecting global alignment, holes or artificial "hole patching” performed by scanner software on an incompletely scanned object (unbeknownst to the user) would result in standard methods of measuring precision, such as mean deviation between repeated scans, reporting greatly varying values; and as such, a lack of precision. This could erroneously result in the conclusion that an indirectly digitised
conventional impression is less precise than a virtual impression produced by an IOS, while the true cause of error is the inability of the laboratory scanner to correctly digitise the dental model.
1.2.2. Digital methods of occlusion and bite registration
Having produced a digital version of a patients’ dental arches, by whichever method deemed appropriate by the clinician, a record of the patient’s occlusion is usually required. Having an awareness of the patient’s habitual intercuspation (occlusion) and dynamic paths of function (articulation) could potentially prevent future tooth fractures (Keeling, 2016). If part of the
argued that the study would likely have had greater promotional value had it been used by the poly- vinylsiloxane material manufacturer whose materials proved the most precise in Ender et al.’s study.
3 Impressions are even more of a challenge to scan. The complex topology, and tendency of dentate
impressions to have undercuts and narrow crevices, means moving a scanner head or scan object into a position where a direct scan view is possible is a challenge, if not impossible. The result is often either a scan with holes, or a scan with artificially repaired areas to close up any holes.
17
treatment is digital (such as CAD/CAM crowns or larger appliances such as digitally
manufactured bite splints) the occlusion may need to be digitised. While dynamic articulation falls beyond the scope of this thesis, (and IOSs currently have only limited capabilities of recording this) static occlusal registration is offered by most IOS (and most indirect scanners) and could benefit from further investigation.
There are several methods which can be used to create a digital record, ranging from scanning analogue bite records, scanning articulated models in a laboratory scanner or using an IOS. The challenges that come to light when developing an experimental protocol with which to assess the quality of articulation, be it analogue or digital, are evident in the literature (Rhee et al., 2015; Solaberrieta et al., 2015; Solaberrieta, Garmendia, et al., 2016; Alghazzawi, 2016). Evaluation of contact points is a common method, as seen in (Bohner et al., 2016), but
quantitatively assessing the quality of contact points is a challenge, as this may fail to indicate perforation of teeth, if overclosure has occurred. Overclosure is, in most cases, an artifact of the nature of virtual data (which can intersect freely, unlike real world objects), and is unlikely to be encountered in analogue studies (Gintaute et al., 2020). Furthermore, contact point analysis requires some form of arbitrary parameterization. Is a contact point valid if there is a 0.001 mm separation between the teeth? Or 0.01 mm? Or 0.35 mm? The latter value has been used previously (DeLong et al., 2002) but would a clinician really accept articulating paper which is over one third of a millimeter thick? Typical clinical articulating paper is less than 0.1mm thick, and usually less than half of that value. Therefore, when assessing the body of literature relating to digital dental occlusion, one must be mindful that the measurement metrics are not ideal.4
4 While DeLong settled for 0.35mm distance between cusp tips, Straga compared physical intersections
(<0.000 mm) between opposing teeth in the digital arm of their study (Straga, 2009). Shimstocks and articulating foil were used as the control in this study. This is a problematic approach, as seen on page 41 in Straga’s study: the digital version underestimates the number of contact points. This may be the result of the missing contact point being just less than the thickness of the shimstock/articulating foil away from the opposing tooth. This would result in the contact being identified in the conventional arm, but not in the digital arm which required physical intersection with the opposing tooth.
Alternative reasons for reduced contact points in the digital study include misalignment of the model during scan creation, misalignment of one or both models against the buccal scans, or a lack of resolution in the digital mesh produced by the scanner. A simplified, or low resolution mesh (in comparison to Type IV stone, for example) would likely negatively affect the trueness and precision of virtual articulation. Cusp tips, due to their relatively smooth surface (as opposed to margins of
preparations), may suffer from aggressive simplification during scanning and mesh generation. This will be discussed in more detail, but in relation to virtual articulation, such simplification may result in digital cusp tips consisting of fewer points and larger face triangles — resulting in a faceted appearance. In
18
With these caveats in mind, digital recording of maximum intercuspation [ICP] using IOS has been reported to produce favourable results compared to analogue methods, with Jaschouz and Mehl reporting a reproducibility in ICP registration using an IOS of 0.042(±0.034) mm as opposed 0.135(±0.077) mm from an analogue method (Jaschouz and Mehl, 2014). This study investigated the precision of reproducibility in buccal scan alignment, as opposed to the alignment of a full arch scan using the buccal scans as reference. We show, in Chapter 4, that the results produced when introducing the full arch scan differ greatly from the optimal buccal bite alignments. The results presented by Jaschouz and Mehl must therefore be considered optimal results under ideal conditions, and clinical ICP registration using IOSs is likely to produce inferior results.
Assessing the ability with which a scanner is able to correctly record occlusion is a challenge, and is complicated, in IOSs, by any arch distortion produced during the original scan. Work investigating the challenge of identifying, and separating, arch scan error from bite scan error is presented in Chapter 4. This paper could be read as a continuation of the work presented in (Gintaute et al., 2020).
1.2.3. Current methods for measuring scanner accuracy
Determining the accuracy of dental scanners is not a new topic, and although technologies are constantly being improved, the quality of dental scan data, and methods with which to
investigate this, has been “under investigation” since 1987, if not longer (Rekow et al., 1987). In 2003, Luthard et al. claimed to present a novel method for investigating dimensional changes in dental materials, by using an optical scanner. Though presented as an investigation into material shrinkage, rather than the scanner, this study is an earlier example of the
method used subsequently by many to measure the accuracy of 3D data. This method
proceeds by performing best-fit registration on multiple data-sets before measuring the mean distance between scan pairs (by searching for the closest point of the opposing mesh from each vertex of the target mesh). While there was little noticeable change in material
shrinkage, the authors report, following best-fit registration of the scanned stone dies and the master die, a mean deviation between test groups of:
“about 10 μm. However, the maximum deviations reached up to 100 μm”
fact, example scans provided from a Carestream IOS contained cusp tip triangle edges of 0.4mm. This would obviously have a negative effect on any attempts of recreating correct articulation.
19
(Luthardt et al., 2003). In 2012, Van der Meer et al. raised the issue of the trend in the literature of reporting a single figure to give an indication of the quality of a scan, as seen in the quoted example from Luthard et al.(van der Meer et al., 2012). This is a salient point, as the most common method of reporting scanner accuracy in the literature is a single figure representing the mean deviation of the complete scan from either a repeated scan (to assess precision) or a scan produced by a validated, traceable scanner (to assess trueness). Similarly, most commercial scanners are released with a statement claiming a “validated x micron accuracy”, which one might argue holds little informative value to an end-user (see also 1.2.4: The issue with standards).
Most current methods for measuring scanner precision rely on black box solutions5, often using, or repurposing, commercial engineering and metrological software packages, which may not have been designed for this purpose. This may, as a result, lead to erroneous conclusions. For instance, collaborative work undertaken with investigators at Kings College London found that measuring erosion using commercial software, not designed with this task in mind, may under-report dental erosion (O’Toole et al., 2019b; Marro et al., 2020). This problem is not solely restricted to the virtual quantification of tooth wear. The key issue is exclusively relying on global alignment of scan data prior to analysis. This is discussed in more detail in section 1.3.1 and in Chapter 2.
An alternative to relying on alignments to investigate the accuracy of 3D data is by measuring real-world distances, such as the width of a tooth, or an arch, or any linear distance between multiple key points, as seen in (van der Meer et al., 2012; Braian and Wennerberg, 2019; Mangano et al., 2020). The precision with which a scanner can reproduce data which measures the identical distance across repeated scans might be a more conceptually
accessible metric than other more statistical and process-heavy methods, or indeed, a single
5 Black box is a term commonly used within the digital field to describe tools and software in which
parameters and settings have been ‘hard coded’ into the software, meaning that the end-user has less control, and often little knowledge, of the underlying methods and processes which they are using. While often convenient for the user, this is problematic as it may affect results and impede reproducibility.
In addition, black box packages (be it the scanner software or analysis software used by investigators) may modify the data, unbeknownst to the user. This might take the shape of automatically closing scan holes, sharpening edges (in the case of dental scanner software) and remeshing and/or simplifying the data in question. All are actions which result in the data produced being slightly different to the data the user fed into the software — and which the user assumes they are working on…
20
mean value measurement. Kuhr et al. presented a method of investigating the trueness of impressions and IOSs in vivo, by attaching metal spheres to the cusp tips of the test subjects, and measuring the distance between spheres, and deviation in angle of virtual planes fitted to these spheres, across various scanner systems. This is one of few examples of methods with which to assess the in vivo trueness of IOSs (Kuhr et al., 2016). The inherent risk of such methods is that the results are operator dependent, unlike the mean distance measurement between scans, which is calculated by the computer, with little human input.
Due to the financially driven nature of technological developments within dentistry6, the risk remains of quantitative data being interpreted incorrectly to present enhanced, biased, or even falsified, results. This risk becomes all the greater with much research being undertaken by clinicians and other researchers whom may not necessarily have a deep understanding of the low-level workings of 3D scanners and 3D data.7 There is a risk of well-meaning research foundering in the mists of data analysis, and producing flawed or erroneous data due to lack of awareness of underlying processes within scanners, and analysis software. More conceptually accessible methods of evaluating 3D data than those currently in use would therefore be of great value to the field.
1.2.4. The issue with standards
There is no single standardised method for measuring 3D data within the dental field, nor is there a standardised method for measuring the trueness and precision of intraoral dental scanners. The International Organization for Standardization’s (ISO) effort to provide a
standard by which to assess the accuracy of digital scanning devices may offer an introduction into the real challenges of quantifying and assessing the accuracy of 3D surface data. BS EN ISO 12836:2015 (Dentistry — Digitizing devices for CAD/CAM systems for indirect dental restorations — Test methods for assessing accuracy)(British Standards Institution, 2015) can be used to verify the accuracy of laboratory scanners. This standard has occasionally,
somewhat misleadingly, been used by researchers investigating intraoral scanners, despite the standard explicitly stating that it does not cover handheld scanning devices. The obvious reason for this misconduct is that there (at the time of writing) is no standard available for the validation of handheld scanning devices, as previously discussed by (Braian, 2018). (It is also
6 Brontes Technologies, the start-up which developed what eventually became known as the Lava
Chairside Oral Scanner, was acquired by 3M for $95 million in 2006 (Writer, 2006). In 2009, 3M announced that the Lava platform (in USA and Canada) had been sold (3M, n.d.). While the Lava scanner is still commercially available, it is no longer actively promoted, and unlikely to have been considered a successful investment.
21
worth noting that most manufacturers of indirect scanners fail to document their ISO 12836 verification in a way that it is available to the customer, despite the standard stating this as a requirement8). An alternative standard is the VDI 2634, though this is generally used by more general, not dental-specific, 3D scanners (Luhmann and Wendt, 2000).
It has become evident that passing the requirements for ISO 12836 verification is considered crucial by most dental scanner developers, even for IOS. One lead engineer described this, in conversation, as “jumping through hoops”, and a tick-box exercise for which the team would “tune” their scanners. While not necessarily a damaging approach, whether the ISO 12836 metric provides a valid measure of a scanner’s accuracy when scanning clinical topology, as opposed the proposed standard scan objects, —and whether such “tuning” improves the performance of the scanner, or not— is a matter very much worthy of further investigation, but falls beyond the scope of this thesis9. The fact that the entire IOS industry relies on, and is shaped by, a standard which specifically states it does not cover hand-held devices, gives an insight into how financial motivations may — blindly — steer technological developments within the field.
Standardisation is never simple. It became clear early on during this research that developing and proposing a standardised method for measuring scanner accuracy would provide very little, except yet another proposed standard (Figure 1:2) 10. As such, though this work does introduce a handful of new methods for assessing the quality of data, it aims to investigate the clinical relevance of various methods of measuring scan data, traditional and novel, with the hope of raising an awareness of the problematic nature of an industry or field placing its trust blindly in standardisation procedures and gold-standard analysis methods.
8 I have, as fits a tunnel-visioned PhD researcher, tried to obtain the ISO 12836:2015 test documentation
from several of the large manufacturers within the field without any luck (but with a fair share of ambivalence).
9 An anecdotal footnote: In computer science, specifically the field of 3D face prediction, benchmark
data has traditionally been made available to the community. As a result, many developers "tune" their algorithms to work optimally with the benchmark data, as this results in optimal results in publication. This often means that the algorithms have been optimised to such an extent they fail to perform "in the wild" — despite this being their originally intended purpose. There are moves in the field to use "hidden" benchmark data, against which developers can submit their algorithm to be tested by
independent researchers. Anecdotally, this has resulted in a dramatic reduction in optimally performing algorithms, and in the number of new publications.
10 See also Whitehouse, D.J. 1982. THE PARAMETER RASH - IS THERE A CURE? Wear: an international
22 Figure 1:2 XKCD by Randall Munroe
Much of the unpublished preliminary work undertaken as part of this research focused on the current standards and methods for assessing trueness. It quickly became clear that
investigating quantitative trueness is a highly problematic topic, as summed up in Hasong Chang’s deliberations on scientific measurement:
"Among physicists, those who are involved in the testing of complicated and advanced theories by means of elementary observations would be in a relatively straightforward epistemic position [...]. But for those who try to justify the reasoning that justifies the elementary observations themselves, it is very difficult to escape circularity. The basic problem is clear: empirical science requires observations based on theories, but empiricist philosophy demands that those theories should be justified by observations. And it is in the context of quantitative
measurement, where the justification needs to be made most precisely, that the problem of circularity emerges with utmost and unequivocal clarity." (Chang, 2005)11
Or in simpler terms: traceability. One can only ever assume that a measurement is true to within the margin of error of the device against which it was calibrated and/or manufactured. For a PhD student on the quest to frame and narrow down their research, this is a tempting academic booby-trap and time-drain, which I am grateful to have escaped mostly unscathed. I thus leave the challenge of truly determining the trueness of 3D scanners to a braver, and more patient, researcher.
11 page 221, Chapter 5: Measurement, Justification and Scientific Progress. Emphasis in quotation is my own.
23
1.3. A brief introduction to 3D data and 3D scanners
Up until this point we have considered the current state of 3D scanning for clinical use, with a brief introduction into methods commonly used to measure 3D scan data, and some of the issues related to this. At this stage, it may be appropriate to briefly cover some of the fundamentals of 3D data and 3D scanners.
The first stage of any digital workflow is data acquisition, or, getting the relevant information digitised. Within dentistry this is achieved through 3D scanning.12 The exact method by which scanners obtain the relevant 3D information and converts this to a presentable 3D file (a clean, manifold mesh, in most cases saved as an STL or PLY file before reaching the end-user)
depends on the scanner type and the manufacturers’ design decisions. No matter the scan method, the goal is to accurately, virtually reproduce the real-world object. (Whether the data acquisition method of the various scanners on the market affect the quality of the scan data is mostly beyond the scope of this work, and did not make an appearance in any of the
publications enclosed, but will be briefly revisited in Chapter 6.)
Current scanning technologies have been built on work developed in applied geometry (Besl and McKay, 1992; Gruen and Akca, 2005), optics (Datta et al., 2009; Zhou et al., 2013; Schmalz et al., 2015), metrology, and computer graphics research (Ahuja and Coons, 1968; Zorin et al., 1996). Factors which are considered priority within these fields, such as speed, and financial and processing costs, may not be of equal importance to a clinician, whose priorities may differ greatly from those of, say, a theoretical mathematician. Unfortunately, most clinical end-users are unlikely to be aware of these differences in priorities and are therefore unable to critically assess how such design decisions may affect the digital data presented to the user. This will be explored further, following an introduction to the 3D scanning process. An
introduction to the 'black box' of scanning will allow the reader to get a more rounded understanding of how 3D scanning works, and from this, what some of the most common pitfalls and shortcomings of 3D scanners are.13
12 Other fields relating to less complex subject matters with less variation can occasionally (re)produce
the relevant information using CAD.
13 It may be worth noting that any references to algorithms and publications in the following sections are examples of processes that may be taking place within dental scanners. A well-performing
alignment or surfacing algorithm may well result in a scanner performing better than the competitor. It is therefore nearby impossible for an independent researcher to uncover the exact processes in use in scanners currently available on the market.
24
Any reader familiar with the literature on the quality of dental scan data would be excused for believing that the “STL” or mesh available following scanning is the raw scan data. This is not the case. To gain an understanding of what can, and does, go wrong prior to producing the STL file, one needs a deeper understanding of the underlying processes which take place while the scanner is calculating the final mesh. This involves numerous stages, all out of sight of the user. It is noteworthy that all these stages may result in a degree of data degradation, as points are averaged, resampled, recalculated or simply removed. And to understand how, and why, these processes take place, a summary of the very basics of 3D data will now be
described.
A 3D dataset, at its very lowest level, consists of vertices, or, 3D coordinates. A vertex is colloquially referred to as a point, and a dataset consisting of multiple vertices is a point cloud14.
A 3D scanner — scanning — collects samples of coordinates which produce a point cloud. Due to the many challenges that present themselves when trying to determine the location of any given point in space, a large number of samples may be collected, before an average point is generated, to represent the sample. Hence, even at this very early stage, filtering is occurring, and an average estimate point cloud is generated (Le et al., 2017).
Point clouds are of little use for clinical — or any physical — use, where a continuous surface is required. Therefore, the point cloud, is surfaced to produce a 3D mesh. This is a collection of triangles15, connecting vertices, to create a continuous surface. While one may conceptually think of this as joining the dots, it may be worth pointing out that most surfacing algorithms re-sample the point clouds, resulting in a mesh whose vertices are in different locations to those of the original point cloud (Kazhdan et al., 2006)16.
Surfacing, while a necessity, brings with it several issues which can negatively affect the clinical usability of the data. Namely, producing sharp corners and edges is a challenge to a surfacing algorithm, whose very nature is to average any wildly disagreeing values (such as two points on a corner, facing in very different directions) to produce a concordant surface (Demarsin et
14 Much like their 2D equivalent, pixels, vertices are not little cubes or spheres, just coordinates (Smith,
1995). However, for one’s sanity, and teaching purposes, vertices are often represented as little squares — like postage stamps — as this allows us to consider the concept of a 3D coordinate possessing a back and front face (which is indicated by the vertex and/or triangle face normal).
15 Or, in inefficient cases, more complex planar shapes. But most, if not all, modern dental software use
triangle-based meshes.
25
al., 2007; Cao et al., 2012; Le et al., 2017) 17. The result is often a rounded edge or corner, much to the disadvantage of the clinician (Keeling et al., 2017). Nedelcu et al. report that the finish line distinctness of various intraoral scanners vary greatly, and that scanners which produced meshes with non-uniform tessellation tended to produce scans with a more distinct finish line; highlighting the fact that the method with which scanners surface their data is not always the same, and does affect the clinical usability of the data produced (Nedelcu et al., 2018). Nedelcu et al.’s findings suggests that algorithms which rely on heavily sampling scan data in areas which contain interesting features, such as margins, and preserving fewer points in areas with little of interest may produce a more clinically useful scan, without creating an unnecessarily large data file. While a seemingly sensible approach, this does yet run the risk of affecting the clinical suitability of the data. As previously mentioned, accurate virtual occlusion could be negatively affected by an (even modestly) simplified mesh, when a patient is able to feel 0.01mm of difference between their teeth (Tryoe et al., 1962). Much work has been invested in solving the problems that come with surfacing and the topics of edge sharpening and the acuity of scan data are revisited in Chapters 3 and 6.
1.3.1. Alignment in data generation and measuring
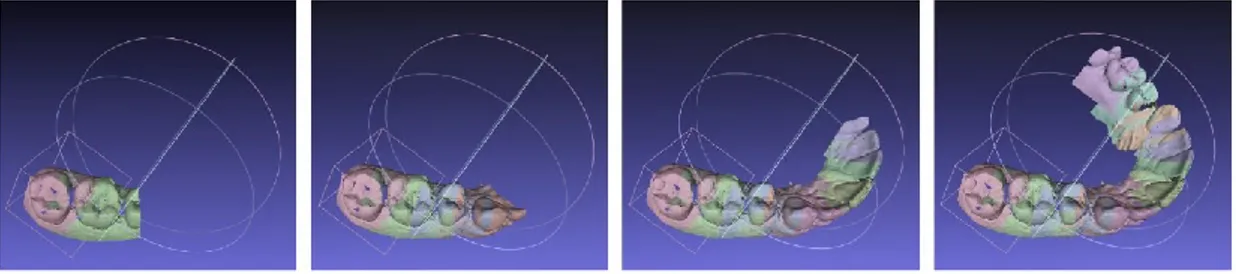
Regardless of whether 3D data has been generated by a laboratory scanner or an IOS, alignment (or registration) is required to assemble the many scan views to produce the final scan (See Figure 1:3). Alignment also plays a key part in many methods currently used to investigate data quality, as highlighted in section 1.1. Alignment is a very challenging problem within computer science, in that there is no single true alignment solution. Identical scan data aligned multiple times may produce different outputs.
Figure 1:3: Illustration simulating data acquisition in an intraoral scanner. With thanks to Andy Keeling.
17 A technically alternative, (but conceptually similar, to the non-programming end-user) approach with
26
In addition, ideal digital alignment is not the same as ideal clinical alignment. Much of the work presented within this thesis explores the consequences of relying on the problematic assumption that digital alignment produces clinically relevant results. Iterative closest point (ICP) algorithms work by taking a large number of distance measurements between two (rigid) meshes and minimizing the average distance between the meshes. As a result of this, the algorithm allows the meshes to perforate through one another if this reduces the average distance between the two. (See Figure 1:4). Clinically, such a scenario (where two physical objects perforate, non-destructively) is not physically possible, meaning that an ideal digital alignment can be less than ideal in a clinical setting. Thus, a clinical ideal alignment must take protrusions and undercuts into account and requires a determined path of insertion. The first positive error encountered along the path of insertion is the clinical fit, be it for a crown or a denture. (See Figure 1:5).
27
Figure 1:4: Illustrating the issue with global alignment A and B are perfectly identical spheres, except the top of sphere B has been removed. C shows perfect alignment of sphere A and sphere B, with the apices of the spheres displaying a difference between the two meshes, but all else being identical. D shows global alignment working to reduce the maximum deviation at any point between the two meshes, and as a result pulling sphere B upwards, introducing error at the base of the spheres, as illustrated by the change in colour. The yellow band towards the top indicates the sphere B perforating through sphere A producing a ‘positive’ error. This experiment was done using Geomagic, which is, undoubtedly, the most common software package used within the dental literature for 3D analysis. Thanks to Saoirse O’Toole for the screenshots.
28
Figure 1:5 Illustrating the difference between optimal digital and optimal clinical alignment of a denture in the patient’s mouth. a) illustrates optimal fit, requiring a perfectly fitting denture. b) illustrates an imperfectly fitting denture having been “optimally” aligned. The computer assumes this is as perfectly aligned as it is possible to fit two differently shaped objects. This alignment is not physically possible and is show in c) as a colourmap of where the denture and patient’s gums interact. Blue indicates areas where the denture has passed beyond the patient’s gums, pink shows areas where there is a gap between the denture and gum and green shows ideal fit. d) and e) illustrate optimal clinical alignment, where no area of the denture passes through the patient. The ICP alignment algorithm would report this as incomplete alignment. Thanks to Andy Keeling for illustrations and screenshots.
The selection criteria by which the ICP (Iterative Closet Point) algorithm selects its sample points between which to take each measurement depends on the implementation of the algorithm. Besl and McKay propose measuring between a vertex on mesh A to the closest vertex on mesh B, while Chen and Medioni suggest measuring from a vertex on mesh A to the closest intersecting plane on mesh B (Chen and Medioni, 1991; Besl and McKay, 1992). Chen and Medioni’s point to plane method is generally considered likely to produce improved convergence and accuracy (Pomerleau et al., 2013). While a seemingly abstract, and minor, difference, the two methods would produce somewhat different results if used to measure the same two meshes, and of some importance when investigating data which may present seemingly minute, but potentially relevant, errors. This also highlights the issue of using black box systems to align and investigate scan data, as these rarely allow the investigator the
29
opportunity to make active decisions regarding the most appropriate method with which to align data, and rather presents a “one button does it all” with limited user input, as previously discussed in (O’Toole et al., 2019b).
30
1.3.2. Summary of working with 3D data
It is not my intention to cover all aspects of the 3D data pipeline which takes place in 3D scanners. However, there are a couple of key messages that lay the foundations for the following work:
• All 3D scanners work by calculating spatial coordinates which are stored as a raw point cloud.
• Scan data undergoes multiple processing steps (including, but not limited to: cleaning, alignment, simplification and surfacing) before the final mesh (STL or PLY) is produced. • Every processing stage may result in data degradation.
• Alignment is necessary both during scan generation and during most methods of analysis.
• There is no single, true solution to surface alignment. A computer aligning the same pair of scans multiple times may produce divergent solutions. (The only guaranteed alignment is in the mathematically trivial case of aligning two identical, but displaced, meshes (each with identical vertices) – a situation which will never occur when using different scans.)
31 1.4. Scope
The focus of this work is to explore novel methods for quantifying the quality of 3D surface scan data in dentistry. Much of the work uses data produced by IOSs, though the methods can also be applied to data produced by extraoral (laboratory) scanners.
In particular, this thesis seeks to determine how to measure 3D data in a clinically relevant way. To that end, the basics tenets of good prosthodontic treatment are investigated – namely high quality full arch models, correctly occluded in the desired relationship (inter-cuspal position or centric relation). Further prosthodontic requirements (for example, accurate crown preparation models with sharp margins and good emergence profiles) are beyond the scope of this thesis but are touched upon when relevant.
Illuminated by the findings of these methods, and the intuition that not all digital data is equal, an optimal digital method is proposed in Chapter 5 for the prosthodontic situation of aligning dental models in the centric relation position (useful, for example, in rehabilitative treatment). This method overcomes the largest single barrier to dentists ‘going digital’ – that they do not own an IOS – by keeping the clinical workflow entirely traditional and thus achievable. The novel measurement method developed throughout this thesis (key point analysis) is applied to the final experiment. It is shown that a simple modification to current laboratory practice (by digitally scanning the inter-occlusal records using an inexpensive, but high quality, clamp-less scanner) significantly improves the precision of the articulated digital models, compared to the standard practice of physically articulating the models, then scanning them. The experiment also hints that the precision exceeds that of IOS bite scans from a modern IOS and might therefore represent the state-of-the-art in high precision digital articulation for centric relation models, whilst remaining accessible to all dentists rather than the minority equipped with IOSs.
1.5. Statement of problems
• There is no gold standard method used to measure or report the quality of 3D data in dentistry
• Current standard methods of reporting scanner accuracy are often too abstract to be clinically relevant
32
• Novel, clinically relevant measurement methods are required. These will pave the way for developing digital (or hybrid analogue/digital) workflows which truly provide the best possible clinical standards of treatment
1.6. Aims, goals and objectives
The aim of this research is twofold. Firstly, attempts will be made to establish methods, both current and novel, for testing the accuracy of 3D dental arch scans in a clinically relevant way, with particular focus on full arch scanning for large appliance and virtual articulation.
Secondly, using these methods, investigations will be made to establish the accuracy of various intraoral scanners, and a suggestion for a more precise method to digitally occlude models in centric relation will be explored.
Objectives include:
• Methods commonly used within the field to investigate scanner accuracy will be identified and tested
• Alternative methods with which to assess the quality of scan data will be proposed and tested
• All results will be considered with clinical applicability in mind
1.7. Indication of research approach
All work presented takes the form of in vitro laboratory studies. One notable difference from much in vitro work which has been undertaken within the field, is the tendency towards robustly performed investigations with a large number of repetitions wherever possible, with the aid of automation tools and batch processing.
33 1.8. Statement of contribution
There are several novel concepts presented in the following pages:
i. The "meaningless mean" and the inherent risks of relying on mean and median values of scan data are mainly, but not solely, explored in Chapter 2. While the problematic nature of relying on mean values in data analysis has been raised in other fields (Matejka and Fitzmaurice, 2017), this issue is rarely mentioned in the dental field. In this paper, we propose the use of an “upper-bound value” to reach a more clinically relevant value when investigation scan errors.
ii. A robust method for selecting features on similar, but inherently different, meshes is presented in Chapter 3. The upper-bound value method, presented in the previous chapter, is also simplified and made more conceptually approachable, by reporting the percentage of a scan deviating beyond 0.1mm. See Appendix 8.2 for a detailed
description of the key point method.
iii. A method for measuring full arch distances using the aforementioned key point method is presented in Chapter 3 and again in Chapter 4. This method can give an indication of the location of distortion within an arch scan. Unlike previous physical feature-reliant methods (by adhering spheres or bars to the teeth for reference, for instance), this method can be applied to data collected in vivo, as well as in vitro.
iv. A method for apportioning sources of error in the inter-cuspal occlusion created from intraoral scans, using the key point method, is presented in Chapter 4. This allows us to identify the proportion of scan error which is caused by the arch scan, and the proportion of error introduced during the bite registration stage.
v. Chapter 5 uses the key point method, and the findings on arch accuracy of the Omnicam presented in Chapter 4, to investigate the accuracy of using bite records to occlude dental models in centric relation, using a traditional and a virtual (hybrid) method of articulation. This method, using a clamp-less laboratory scanner, could be seamlessly integrated into a clinician’s workflow without the practitioner having to change their clinical routine.
34
vi. Lastly, in section 6.3: The current state of full arch scanning and the effect of different measures of ‘accuracy’ the results found in Chapter 3 are revisited, highlighting the real value of using appropriate means of measurement, as illustrated by the three different methods producing three different results, and therefore conclusions, as to whether the device under investigation produces clinically appropriate scan data, or not.
35 1.9. List of references
1. 3M n.d. 3MTM True Definition Intraoral Scanner acquired by Midmark in U.S. and Canadian Markets. 3m.com. [Online]. [Accessed 11 December 2020]. Available from: https://www.3m.com/3M/en_US/dental-us/expertise/digital-dental-impressions/.
2. Ahlholm, P., Sipila, K., Vallittu, P., Jakonen, M., Kotiranta, U., Sipilä, K., Vallittu, P., Jakonen, M., Kotiranta, U., Sipila, K., Vallittu, P., Jakonen, M. and Kotiranta, U. 2018. Digital Versus Conventional Impressions in Fixed Prosthodontics: A Review. Journal of Prosthodontics. 27(1), pp.1–7.
3. Ahuja, D. V. and Coons, A. 1968. Interactive Graphics in Data Processing: Geometry for construction and display. IBM Systems Journal. 3.4, pp.188–205.
4. Alghazzawi, T.F. 2016. Advancements in CAD/CAM technology: Options for practical implementation. Journal of Prosthodontic Research. 60(2), pp.72–84.
5. Besl, P.J. and McKay, N.D. 1992. A Method for Registration of 3-D Shapes. IEEE Transactions on Pattern Analysis and Machine Intelligence. 14(2), pp.239–256.
6. Bohner, O.L.L., Neto, P.T., Ahmed, A.S., Mori, M., Lagana, D.C. and Sesma, N. 2016. CERECChairside Systemto Registerand Designthe Occlusion in Restorative Dentistry : A Systematic Literature Review. Journal of Esthetic and Restorative Dentistry. 28(4).
7. Braian, M. 2018. Studies on the trueness and precision of additive manufacturing and intraoral scanning.[Online] Malmö University. Available from: https://www.diva-portal.org/smash/get/diva2:1404654/FULLTEXT01.pdf.
8. Braian, M. and Wennerberg, A. 2019. Trueness and precision of 5 intraoral scanners for scanning edentulous and dentate complete-arch mandibular casts: A comparative in vitro study. Journal of Prosthetic Dentistry. 122(2), pp.129–136.
36
9. British Standards Institution 2015. BS EN ISO 12836:2015: Dentistry - Digitizing devices for CAD / CAM systems for indirect dental restorations — Test methods for assessing accuracy
10. Cao, J., Wushour, S., Yao, X., Li, N., Liang, J. and Liang, X. 2012. Sharp feature extraction in point clouds. IET Image Processing. 6(7), pp.863–869.
11. Chang, H. 2005. Inventing Temperature: Measurement and Scientific Progress.
12. Chen, Y. and Medioni, G. 1991. Object Modeling by Registration of Multiple Range Images. Proceedings - IEEE International Conference on Robotics and Automation., pp.2724–2729.
13. Chochlidakis, K.M., Papaspyridakos, P., Geminiani, A., Chen, C.J., Feng, I.J. and Ercoli, C. 2016. Digital versus conventional impressions for fixed prosthodontics: A systematic review and meta-analysis. Journal of Prosthetic Dentistry. 116(2), pp.184–190. 14. Curless, B. and Levoy, M. 1996. Volumetric method for building complex models from
range images. Proceedings of the ACM SIGGRAPH Conference on Computer Graphics., pp.303–312.
15. Datta, A., Kim, J. and Kanade, T. 2009. Accurate camera calibration using iterative refinement of control points. Computer Vision Workshops ( …., pp.1201–1208.
16. DeLong, R., Ko, C.C., Anderson, G.C., Hodges, J.S. and Douglas, W.H. 2002. Comparing maximum intercuspal contacts of virtual dental patients and mounted dental casts. Journal of Prosthetic Dentistry. 88(6), pp.622–630.
17. Demarsin, K., Vanderstraeten, D., Volodine, T. and Roose, D. 2007. Detection of closed sharp edges in point clouds using normal estimation and graph theory. CAD Computer Aided Design. 39(4), pp.276–283.
37
18. Ender, A., Attin, T. and Mehl, A. 2016. In vivo precision of conventional and digital methods of obtaining complete-arch dental impressions. Journal of Prosthetic Dentistry. 115(3), pp.313–320.
19. Ender, A. and Mehl, A. 2011. Full arch scans : Conventional versus digital impressions - An in-vitro study. International Journal of Computerized Dentistry. 14(21).
20. Ender, A., Zimmermann, M., Attin, T. and Mehl, A. 2015. In vivo precision of
conventional and digital methods for obtaining quadrant dental impressions. Clinical Oral Investigations. 20, pp.1495–1504.
21. Ender, A., Zimmermann, M. and Mehl, A. 2019. Accuracy of complete- and partial-arch impressions of actual intraoral scanning systems in vitro. International journal of computerized dentistry. 22(1), pp.11–19.
22. Gintaute, A., Keeling, A.J., Osnes, C.A., Zitzmann, N.U., Ferrari, M. and Joda, T. 2020. Precision of maxillo-mandibular registration with intraoral scanners in vitro. Journal of Prosthodontic Research. 64(2), pp.114–119.
23. Gruen, A. and Akca, D. 2005. Least squares 3D surface and curve matching. ISPRS Journal of Photogrammetry and Remote Sensing. 59(3), pp.151–174.
24. Güth, J.F., Edelhoff, D., Schweiger, J. and Keul, C. 2016. A new method for the evaluation of the accuracy of full-arch digital impressions in vitro. Clinical Oral Investigations. 20(7), pp.1487–1494.
25. Güth, J.F., Runkel, C., Beuer, F., Stimmelmayr, M., Edelhoff, D. and Keul, C. 2017. Accuracy of five intraoral scanners compared to indirect digitalization. Clinical Oral Investigations. 21(5), pp.1445–1455.
26. Jaschouz, S. and Mehl, A. 2014. Reproducibility of habitual intercuspation in vivo. Journal of Dentistry. 42(2), pp.210–218.
38
27. Kazhdan, M., Bolitho, M. and Hoppe, H. 2006. Poisson surface reconstruction In: Proceedings of the fourth Eurographics symposium on Geometry processing.
28. Keeling, A. 2016. Determination of the transverse horizontal axis and interocclusal registration using a novel optical technique. University of Leeds.
29. Keeling, A., Wu, J. and Ferrari, M. 2017. Confounding factors affecting the marginal quality of an intra-oral scan. Journal of Dentistry. 59, pp.33–40.
30. Keul, C. and Güth, J.F. 2020. Accuracy of full-arch digital impressions: an in vitro and in vivo comparison. Clinical Oral Investigations. 24(2), pp.735–745.
31. Kuhr, F., Schmidt, A., Rehmann, P. and Wöstmann, B. 2016. A new method for assessing the accuracy of full arch impressions in patients. Journal of Dentistry. 55, pp.68–74.
32. Le, M.T., Chen, L.C. and Lin, C.J. 2017. Reconstruction of accurate 3-D surfaces with sharp edges using digital structured light projection and multi-dimensional image fusion. Optics and Lasers in Engineering. 96(April), pp.17–34.
33. Luhmann, T. and Wendt, K. 2000. Recommendations for an acceptance and verification test of optical 3-D measurement systems. International Archives of Photogrammetry and …. XXXIII, pp.493–500.
34. Luthardt, R.G., Kühmstedt, P. and Walter, M.H. 2003. A new method for the computer-aided evaluation of three-dimensional changes in gypsum materials. Dental Materials.
19(1), pp.19–24.
35. Mangano, F.G., Admakin, O., Bonacina, M., Lerner, H., Rutkunas, V. and Mangano, C. 2020. Trueness of 12 intraoral scanners in the full-arch implant impression: a
comparative in vitro study. BMC oral health. 20(1), p.263.
36. Marro, F., Jacquet, W., Martens, L., Keeling, A., Bartlett, D. and O’Toole, S. 2020. Quantifying increased rates of erosive tooth wear progression in the early permanent