UNIVERSITÀ DEGLI STUDI DI CATANIA
DOTTORATO DI RICERCA
IN
BASIC AND APPLIED BIOMEDICAL SCIENCES
XXX CICLO
Coordinatore: Prof. Massimo Libra
IMMUNE ESCAPE MECHANISMS IN
HEMATOLOGICAL DISEASES:
ROLE OF THE MYELOID DERIVED SUPPRESSOR CELLS
AND TUMOR MICROENVIRONMENT
Dottorando: Dott.ssa Cesarina Giallongo
Docente: Chiar.mo Prof. Roberto Avola
SUMMARY
BACKGROUND ... 3
The tumor microenvironment as immunological barrier ... 5
1. Myeloid-derived suppressor cells (MDSC) ... 5
2. Neutrophils... 7
3. Mesenchymal stem cells (MSC) and Cancer associated fibroblasts (CAF) ... 9
Immune escape in haematological diseases ... 10
1.1 Chronic myeloid leukemia ... 14
1.2 Multiple Myeloma ... 15
AIM ... 17
MATERIAL AND METHODS ... 18
SECTION-1 (S-1) ... 18
SECTION-2 (S-2) ... 23
RESULTS ... 28
1. SECTION 1 ... 28
1.1 MDSC are increased in CML patients ... 28
1.2 M-MDSC percentage correlates with MMR in dasatinb treated patients ... 30
1.3 CML cells are able to induce M-MDSC by secreting soluble factors ... 32
1.4 CML-derived exosomes promote M-MDSC expansion ... 33
2. SECTION 2 ... 34
2.1 CML-MSC activate immature myeloid cells (IMC) in immunosuppressive neutrophils ... 34
2.1.1 N2 polarization is driven by disfunctional MSC ... 34
2.1.2 CML-MSC up-regulate immunomodulatory factors ... 36
2.1.3 Gene expression of immunomodulatory factors in CML-MSC educated-neutrophils ... 37
2.2 Mesenchymal Stromal Cells (MSC) as key players in promoting immunune escape and tumor microenvironment transformation from MGUS to Myeloma ... 37
2.2.1 MM-MSC polarized neutrophils versus a “N2” phenotype ... 37
2.2.2 Molecular regulators of MM-MSC-mediated neutrophils activation ... 39
2.2.3 MM-MSC educated neutrophils promote angiogenesis in vitro ... 40
2.2.4 TLR4 signaling activates healthy MSC in stromal cells with the same functional alteration of MM-MSC ... 40
2.2.6 MM-MSC favour tumor engraftment and immune escape in vivo ... 44
DISCUSSION ... 46
SUPPLENTARY FIGURES ... 56
BACKGROUND
The interactions between the immune system and the tumor cells occur through complex events that lead to tumor eradication or immune evasion by cancer [1]. Generally, CD8+ cytotoxic T and CD4+ helper T lymphocytes inhibit tumor development by production of interferon (IFN)- and cytotoxins [2], but chronic inflammation and immune suppressive factors may promote cancer development [3]. In fact, chronic inflammation within the tumor microenvironment inhibits tumor elimination and enhance transformation of cancer. NFKB signaling in hematopoietic cells has been reported to play a critical pro-carcinogenic role producing various pro-inflammatory cytokines and chemokines (such as TNF, IL1, IL6, and CSF1, type I interferons and IL8) that promote carcinogenesis [4]. Immune system plays a critical role with a dual capacity to both promote and suppress tumor growth. It is well established that tumor cells differ from their normal counterparts in antigenic composition. The immune system is able to recognize and destroy the most vulnerable cancer cells [5], but, on the contrary of not transformed cells which maintain a stable antigenic profile, new antigens are constantly generated in tumor cells as a consequence of genetic instability. Until there is a balance between immune control and tumor growth, the tumor dormancy is maintained [6]. However, tumor cells can evade the immune response through multiple mechanisms, resulting in overt clinical cancer.
Inhibition of tumor antigen presentation
Genetic and epigenetic alterations that are characteristic of all cancers provide a diverse set of antigens that the immune system can use to distinguish tumour cells from their normal counterparts [7]. In addition to antigen loss, downregulation of proteosome subunits transporter associated with antigen presentation (TAP) [8, 9] or mutation or deletion of B2-microglobulin genes [10, 11] can inhibit presentation of MHC-peptide complexes on surface of tumor cells [12].
Immune checkpoints
Immune checkpoints are crucial for the maintenance of self-tolerance to avoid autoimmunity and protect tissues from damage when the immune system is responding to infection [7]. Tumors dysregulate expression of immune-checkpoint proteins which are co-stimulatory and inhibitory signals that regulate T cell receptors (TCR)[13]. Indeed, inhibitory ligands regulating T cell effector functions are commonly overexpressed on tumour cells or on non-transformed cells in the tumour microenvironment (fig1).
Pardoll. Nat Rev Cancer;2012
Figure 1. Co-stimulatory and inhibitory interactions which regulate T cell responses. Communication
between T cells and antigen presenting cells (APC) is bidirectional. A2aR, adenosine A2a receptor; B7RP1, B7-related protein 1; BTLA, B and T lymphocyte attenuator; GAL9, galectin 9; HVEM, herpes virus entry mediator; ICOS, inducible T cell co-stimulator; IL, interleukin; KIR, killer cell immunoglobulin-like receptor; LAG3, lymphocyte activation gene 3; PD1, programmed cell death protein 1; PDL, PD1 ligand; TGFβ, transforming growth factor-β; TIM3, T cell membrane protein 3.
PD1 is one of the most studied immune checkpoint; it is expressed on a large proportion of tumour-infiltrating lymphocytes. By upregulating ligands for PD1 (PDL1), cancer cells inhibit antitumour immune responses. Several clinical trials of PD-1/PD-L1 signal-blockade agents have exhibited dramatic antitumor efficacy in patients with certain types of solid or hematological malignancies [14].
Enzymes as immune-inhibitory molecules
Another category of immune-inhibitory molecules includes metabolic enzymes, such as arginase 1 and indoleamine 2,3-dioxygenase (IDO). IDO is expressed by both tumour cells and infiltrating myeloid cells and inhibits immune responses through depletion of aminoacids essential for T cells activation and proliferation.
The tumor microenvironment as immunological barrier
The tumor microenvironment, once established, represents a consistently effective barrier to immune cell functions. Some mechanisms responsible for immune suppression are directly mediated by factors produced by tumors, whereas others result from alterations of normal tissue homeostasis occurring in the presence of cancer. Immune cells have also been identified as contributing to the tumor-associated microenvironment via dysregulation of immune-mediated responses. Macrophages, dendritic cells, natural killer (NK) cells, myeloid-derived suppressor cells, and regulatory T cells (Tregs) are the first cells attracted and recruited
in the site of injury and have all been shown to contribute toward the polarization of a pro-tumorigenic microenvironment [15].
1. Myeloid-derived suppressor cells (MDSC)
MDSCs have myeloid origin, an immature state and are characterized by their potent ability to suppress immune responses, especially T cell proliferation and cytokine production [16]. MDSC were firstly identified in tumor-bearing mice by the expression of CD11b and Gr-1. The mAb used to identify Gr1, however, is able to bind the same epitope of two different molecules belonging to the lymphocyte superfamily (Ly)-6, Ly-6C and Ly-6G, mainly expressed on monocytes and neutrophils respectively, resulting in the identification of two subtypes of murine MDSC: CD11b+ Ly-6C+ Ly-6G- monocytic-like MDSC and CD11b+
Ly-6C- Ly-6G+ granulocytic-like MDSC [17, 18]. As in mice, two main subsets of human MDSC
have been identified: CD14+HLA-DRlow/- M-MDSC and CD15+ CD14- CD11b+ CD33+
HLA-DRlow/- G-MDSC. However, on the contrary of M-MDSC subset, human G-MDSC represent a more heterogeneous population identified by a set of antigens (CD11b, CD14, CD15, CD33, CD66b, CD16 and HLA-DR) which are well established markers for mature neutrophils or polymorphonuclear neutrophils (PMN) [19, 20]. In contrast to conventional PMN collected from the normal density neutrophil fraction on top of red cells after ficoll separation, MDSC are purified from the mononuclear cell fraction (fig.2). Therefore, G-MDSCs are defined as low-density immature cells with neutrophil-like morphology [21, 22].
Scapini and Cassatella. Blood; 2014.
Figure 2. Circulating immature neutrophils (LDNs) and mature neutrophils (NDNs) isolation after ficoll separation.
Both M-MDSC and G-MDSC apply antigen-specific and antigen non-specific mechanisms to regulate immune responses, although these mechanisms are not exclusively used by one of the two subtypes [16, 23]. MDSC-induced immune suppression is mediated primarily by the upregulation of nitric oxide synthase 2 (NOS2), reactive oxygen species (ROS) and overexpression of arginase 1 [24, 25] (fig.3). Moreover, up-regulation of cyclooxigenase-2 and prostaglandin E2 [26], induction of regulatory T cells [27-29], up-regulation of TGF-β [30], depletion of cystein [31], down-regulation of T cell L-selectin expression [32], inhibition of NK function via downregulation of the activating receptor NKG2D [33] have been described. The specific mechanisms used by MDSC are dependent on the context of the microenvironment [34].
Accumulation of MDSC has been described in both solid tumors and hematological malignancies [35]. Tumor progression is frequently associated with their expansion in the peripheral blood (PB), spleen, and tumor [36].
I. Poschke, R. Kiessling; Clinical Immunology 2012
Figure 3. Model of MDSC function in cancer patients. MDSC suppress immune cells by using several
mechanisms dependent on the context of the tumor microenvironment.
2. Neutrophils
Neutrophils are the most abundant white blood cells (WBC). They are classically viewed as short-lived effector cells of the innate immune system. They are important in host defense and infectious diseases with intracellular bacteria (such as mycobacteria or Brucella abortus)[37, 38], parasites [39, 40] and viruses (such as human immunodeficiency virus-1 or influenza virus) [41, 42].
In the last few years, it has been demonstrated that human neutrophils are extremely dynamic and adaptable cells. They can acquire antigen presenting (APC)-like properties and dendritic cell (DC) characteristics or be reprogrammed into macrophages [43, 44]. It has been demonstrated that human neutrophils, other than interacting with nonimmune cell types such as platelets [45] and mesenchimal stem cells [43], can establish, in vitro and in vivo,
cross-talk with innate immune cells, such as DCs, monocytes, macrophages, and natural killer (NK) cells, as well as with adaptive immune cells, such as T and B cells, or related subpopulations [22]. Moreover, longevity of neutrophils increases several-fold during inflammation [46] and there is growing evidences of the key role of neutrophils in tumour transformation, including orchestration of the immune response. In fact into cancer microenvironment, neutrophils have been linked with immunosuppression, angiogenesis, tumor development and metastasis [47-49].
The neutrophils found in the tumor are often referred to as tumor-associated neutrophils (TAN). Recent data have suggested that tumours manipulate neutrophils, sometimes early in their differentiation process, to create diverse phenotypic and functional polarization states able to alter tumour behaviour [50]. Neutrophil polarization states have been divided into N1 or N2 [51]. In fact, TAN can have an anti-tumorigenic (N1) or a pro-tumorigenic (N2) phenotype (fig.4). It has been shown that blockade of TGFβ polarize the protumoral, immunosuppressive N2 to the antitumor, immunostimulatory N1 neutrophils [51]. The most TAN within the tumour microenvironment appear to have an N2 phenotype and thus contribute to tumor growth and immunosuppression producing large amounts of arginase 1, which inactivates T cell activation [52]. Moreover, neutrophils also exert their immunosuppressive function through production of ROS that at high concentrations, induce apoptosis in T cells [53]. Compared with healthy subjects, neutrophils isolated from patients with hepatocellular carcinoma release more CCL2 (C-C Motif Chemokine Ligand 2) that inhibits the production of IFNγ [54]. In addition, N2 TAN recruit immunosuppressive regulatory T cells (Treg) into tumors through secretion of CCL17 (C-C Motif Chemokine Ligand 17) [55].
Granot Z. et al. Mediators of Inflammation; 2015
Figure 4. Neutrophil polarization. Neutrophils may be divided into N1 antitumor and N2 protumor cells.
TGFβ is a potent driver of the transition from N1 to N2 phenotype whereas IFN-β is a potent driver of the transition in the opposite direction.
Since we have no definitive markers yet, we do not know whether the N2 neutrophils within the tumors are actually granulocytic like MDSC or whether they are mature neutrophils converted to an N2 phenotype by the tumor microenvironment [51]. Therefore, the restrictive term MDSC may be re-evaluated because self-limiting. For this reason we consider MDSC as neutrophils with immunosuppressive capabilities (N2 neutrophils).
3. Mesenchymal stem cells (MSC) and Cancer associated fibroblasts (CAF)
MSC is a subset of non hematopoietic stem cells existed in bone marrow (BM) and originating from the mesodermal germ layer [56]. They have the ability to differentiate into multiple lineages such as chondrocytes, osteocytes, adipocytes, myocytes, and astrocytes; so MSC could be considered as a potential source of stem cells for cellular and genetic therapy [57].
MSC are identified by the absence of the CD34 and CD45 hematopoietic cell markers and expression of CD29, CD90 and CD105 [58]. MSCs express the major histocompatibility complex (MHC) class I but do not express MHC class II, B7-1, B7-2, CD40 and CD40L molecules [59].
MSC have been shown to have both stimulating and inhibiting effects on tumor progression. They, through a complex crosstalk with neighboring cells/factors, can inhibit many effector
functions of immune cells, thereby promoting an immunosuppressive state in the tumor microenvironment that allows tumor cells and their associated stroma to overcome the immune surveillance (fig.5) [60].
Han et al. Cell & Bioscience 2012
Figure 5. MSC have a tropism for tumors. MSC in tumor inflammatory microenvironment may be elicited of
immunosuppressive function, which will help tumor to escape from the immunity surveillance.
MSC can home and engraft to cancer, including breast [61-63], lung [64, 65], pancreatic [66], colon [67], ovarian [68] and prostate carcinomas [69, 70], melanoma [71], glioma [72], Kaposi's sarcoma [73] and osteosarcoma [74]. Their chemotactic responses resemble those of immune cells. MSC express chemokine receptors, growth hormone receptors, adhesion molecules and Toll-like receptors (TLR) [68]. Recently, it has been demonstrated a connection between the stimulation of specific TLR and MSC activation status. They are type-I transmenbrane glycoproteins that recognize ‘‘danger’’ signals leading to profound
cellular and systemic responses that mobilize innate and adaptive host immune cells [75]. MSC express several TLR and their ability to migrate, invade and secrete immune modulating factors was drastically affected by specific TLR-agonist engagement [76]. In the last few years, in a clear parallel with macrophage polarization, it has been demonstrated that MSC can polarize into two different types with distinct phenotypes defined MSC1 and MSC2 [77]. In particular, TLR4 stimulation polarizes MSC toward a pro-inflammatory MSC1 phenotype, while stimulation of TLR3 results in the polarization toward an immunosuppressive MSC2 phenotype. Accordingly, the in vitro co-culture of MSC1 with several cancer cell lines inhibited tumor growth, whereas co-cultures with MSC2 had opposite effects. Moreover, in immunecompetent models the treatment of tumors with MSC1 resulted in reduction of tumor growth and metastasis while an MSC2-treatment led to tumor growth [77].
It has been shown that engrafted MSC can develop into α-smooth muscle actin (SMA)-expressing myofibroblasts, usually recognized as cancer associated fibroblasts (CAF), in the tumor microenvironment [78]. In particular, BM-MSC co-cultured in vitro with cancer cells can be activated and may have a CAF-like phenotype. CAF have the capacity to promote tumor growth and metastasis, either via direct interaction with tumor epithelial cells or via the recruitment of inflammatory cells [79]. MSC and CAF show more similarities than differences including the expression of cell surface markers (HLA-DR, CD29, CD90, CD44, CD73, CD106 and CD117), expression of cytoskeleton proteins like vimentin, αSMA and nestin, and trilineage differentiation potential (to adipocytes, chondrocytes and osteoblasts) (tab.1) [80].
Panescu V. et al J. Cell. Mol. Med.; 2011
CAF and MSC exhibit major differences in their ultrastructural features. On the contrary of MSC, CAF have nuclei with lobulated morphology, few mitochondria, highly developed endoplasmic reticulum with dilated cisternae and lamellar content lysosomes [80]. The function of the peculiar lysosomal structures might be involved in the capture and sequestration of tumor derived antigens, thus becoming unavailable to the anticancer immune cells. In fact, CAF have potent immunosuppressive ability like MSC, with also pro-tumoral effects. Therefore, since the differences between CAF and MSC are only functional (i.e.
cytokines production, proliferation rate), CAF could be MSC bearing an activated status that better ‘serve’ the cancer cell.
Immune escape in haematological diseases
Hematological malignancies are cancers that affect blood, bone marrow and lymphonodes, thus maintaining a slight contact with immune system cells. Multipotent, hematopoietic stem/progenitor cells (HSC/HPC), which are the dominant hematopoietic population in the BM, possess both self-renewal and differentiation abilities; their growth and maintenance is dependent on cytokine and niche factors. BM microenvironment involved in regulation and control of maintenance of HSCs is called ‘niche’ [81]. It is a dynamic system with bidirectional signals that ensure the regulation of normal HSCs numbers [82] and maintenance of the quiescent long-term HSC pool [83].
Overall, leukemias are malignant disorders of hematologic cells that result in the overproduction of undifferentiated and immature leukocytes that function abnormally within the BM, the circulation and at extramedullary sites. HSC/HPC are the source of leukemic cells and immune evasion mechanisms play a central role supporting tumor microenvironment transformation [84].
As in a variety of solid cancers, MDSC have been shown to play a central role in anti-tumor immune response in hematological malignances including acute and chronic myeloid leukemia (AML and CML), chronic lymphocytic leukemia (CLL), multiple myeloma and lymphoma [85-90]. Moreover, our group demonstrated that neutrophils isolated from myeloma and CML patients are immunosuppressive cells indicating a common altered pathway of myeloid maturation [91].
Proliferation, survival and drug-resistance of leukemic cells are largely dependent on their interplay with the bone marrow (BM) microenvironment, in which mesenchymal stromal cells (MSC) are important components. Indeed, MSC favor or impede LSC expansion representing a possible target for treatment of leukemias [92]. Since BM is a store of undifferentiated MSC, tumor cells may affect MSC activity in the tumor niche favouring a deep cross-talk between LSC and MSC [93].
Into the tumor milieu, MSC also play an important role for their immunological regulation ability that can interfere with the immune recognition of tumor cells creating an “immune protection site” in the cell microenvironemnt. Indeed, MSC can interfere with the recognition of tumor cells by immune system producing and releasing immunoregulatory factors as TGFβ, prostaglandin E2 (PGE2), tumor necrosis factor α (TNFα), indolamine 2,3-dioxygenase (IDO), hemeoxygenase (HO), NOS2, ARG1-2, IL10 [94-96]. MSC express
programmed death ligand 1 (PD-L1) that after its engagement with PD-1 expressed on T lymphocytes lead to the inhibition of T cell activation and proliferation with an inefficient immune response [97].
1.1 Chronic myeloid leukemia
Chronic myeloid leukemia (CML) is a myeloproliferative disease that originates from a haemopoietic stem cell (HSC) as a result of the t(9;22) leading to the Philadelphia chromosome and expression of the oncogenic tyrosine kinase BCR/ABL [98, 99]. The oncoprotein is central to the pathogenesis of CML and is the target of tyrosine kinase inhibitors (TKI) used for CML treatment. These drugs have drastically changed the treatment outcome of CML patients. More than 85% of CML treated patients achieve a complete cytogenetic response and approximately 40% of these patients achieve a complete molecular remission (CMR) [100]. Imatinib was the first TKI approved and has been considered the standard of care. Although the therapy with Imatinib is considered a major advance in oncology, a significant group of patients still develops drug resistance. Second generation TKI, Dasatinib and Nilotinib, are highly effective in those who fail imatinib as well as in newly diagnosed patients [101]. RQ-PCR–based molecular monitoring of BCR-ABL transcripts is the most sensitive tool for assessing disease burden in patients with CML. The European LeukemiaNet and the National Comprehensive Cancer Network recommend RQ-PCR–based molecular monitoring every 3 months until a deep response (i.e., major molecular response [MMR] or CCyR) occurs and every 3–6 months thereafter [102]. Achieving MMR is extremely important in the course of CML in order to avoid relapse.
In CML patients, immune system is dysfunctional. CD4+ T cells which are central components of effective immune response against cancer cells, are anergic against leukemic cells [103, 104] showing the downregulation of the TCR-ζ chain [105]. Furthermore, the number of NK cells is decreased and their function is impaired [106]. T-reg are significantly increased in CML patients with intermediate or high-risk Sokal scores compared to the low risk patients [107]. In addition, CML myeloid cells (including also CD34+ stem cells) over-expressed programmed death receptor ligand 1 (PD-L1) that binding its receptor PD-1 expressed on T lymphocytes lead to inactivation of T cells [108]. Recently, we observed higher levels of G-MDSC and M-MDSC in patients at diagnosis which decreased to normal levels after treatment with Imatinib [91]. Their percentage did not correlate neither with age, nor with leukocytosis or Sokal risk. In addition, no correlation was observed between MDSC and the response to Imatinib. Both subpopulations expressed BCR/ABL confirming that they are part of the tumor clone. Expression of arginase 1 and its circulating levels in the serum
resulted higher in patients at diagnosis in respect to healthy controls and decreased during TKI treatment. Furthermore, the percentage of G-MDSC correlated with arginase 1 protein levels in the serum. We demonstrated also an immunosuppressive activity of CML neutrophils, suggesting a strong potential immune escape mechanism created by CML cells, which control the anti-tumor reactive T cells [91].
Although the therapy with TKI have drastically changed the treatment outcome of CML patients, the therapy is hampered by chronic mild toxicities that may have, especially in a long time frame, a significant impact on patient quality of life [109]. In recent years, several studies have been conducted to evaluate the safety of imatinib discontinuation in patients who have reached durable CMR [110, 111]. Campiotti et al reported that CML molecular relapse occurs mainly during the first 6 months after imatinib discontinuation. Fifty-five percent and 80% of cumulative molecular relapses occurred in the first 3 months and in first 6 months, respectively [109]. However, late molecular relapses, up to 22 months post discontinuation, were also observed. Molecular relapse is presumably due to the reactivation of dormant CML LSC that are resistant to TKI-induced leukemic cell ablation. Unfortunatly, there is a lack of specific prognostic factors and a follow-up strategy which could determine the restarting of the leukemic growth in imatinib-discontinuing patients [112]. There is increasing evidence suggesting that NK-cells are important in controlling the leukemic cells: increased NK-cell counts seem to correlate with the successful imatinib discontinuation [113]. It could be of interest the monitoring of MDSC in patients who have discontinued imatinib treatment in order to see if their increase could correlate with the restarting of the leukemic growth.
1.2 Multiple Myeloma
Multiple Myeloma (MM) is a malignant plasma cell disorder characterized by the accumulation of neoplastic plasma cells (PC) in the bone marrow (BM) and the presence of monoclonal immunoglobulin in the blood and/or urine. MM is the second most common hematological malignancy and constitutes 1% of all cancers and 13% of all hematological cancers. It is a multistep progressing disease starting with an asymptomatic monoclonal gammopathy of undetermined significance (MGUS) through smoldering Multiple Myeloma (SMM), up to the most aggressive, symptomatic MM and plasma cell leukemia. Clinical features of this disease include anemia, bone resorption, renal failure, frequent occurrence of infections and hypercalcemia [114]. Osteolytic lesions are caused by rapid bone turnover, which occurs as a result of increased osteoclastic resorption that is not accompanied by a comparable increase in bone formation [115].
The development of MM is due not only to uncontrolled proliferation of PC but also BM microenvironment play a crucial role in disease progression to symptomatic myeloma. Here PC are hosted in niches that maintain their long survival and exert a protective effect on drug-induced apoptosis [116, 117]. Immune cells and BM mesenchymal stromal cells (MSC) are important components of this microenvironment.
Within the microenvironment, the host immune system has a pivotal role for the PC growth, proliferation, survival, migration and resistance to drugs and is responsible for some clinical manifestations of MM. In fact, Dysfunction of immune system is an important feature of MM patients and leads to infections and increased tumor growth [118-120]. Dendritic cells (DC) express lower levels of human leukocyte antigen (HLA) molecules and a reduced capacity in stimulating T cells [121]. Furthermore, MM cells are able to inhibit DC function through the secretion of IL-6, IL-10, and TGF-β [122, 123]. Immune responses are also impaired by immunosuppressive cell subpopulations including regulatory T cells, tumor-associated macrophages (TAM) and MDSC [124]. Different authors demonstrated an increase of MDSC in both peripheral blood and BM of MM patients [125, 126]. In addition to their immunosuppressive activity, MDSC show the potential to differentiate in functional osteoclasts thus contributing to osteolytic lesions which are a recognized hallmarks of MM [127, 128].
As MDSC, also mature MM neutrophils (N) have immune suppressive ability supporting the hypothesis of a functional alteration of the whole myeloid lineage (Romano et al, in submission). MM-N overexpressed ARG1 inhibiting T cells activaction and the addition of an ARG1-specific inhibitor partially reversed this inhibition.
AIM
SECTION-1/AIM1
MONOCYTIC MYELOID DERIVED SUPPRESSOR CELLS (M-MDSC) AS PROGNOSTIC FACTOR IN CHRONIC MYELOID LEUKEMIA PATIENTS TREATED WITH DASATINIB
Recently, the prognostic role of MDSC accumulation has been documented for some hematological malignancies such as Hodgkin lymphoma, multiple myeloma, and acute leukemia patients, where they correlates with disease progression and persistence of minimal residual disease [15, 129]. This first study focused on defining the change of MDSC frequency in CML patients during therapy with imatinib (IM), nilotinib (NIL) or dasatinib (DAS). We also evaluated the ability of serum from CML patients and exosomes released from leukemic cells to generate CD14+HLADR- cells from healthy donor derived monocytes.
SECTION-2/AIM2
MESENCHYMAL STROMAL CELLS (MSC) AS KEY PLAYERS IN THE TUMOR MICROENVIRONMENT TRANSFORMATION
It is well known that MSC have a role in promotion of tumor growth, survival and drug-resistance. Recent reports indicated that granulocyte-like MDSC are increased in CML and MM patients and also mature neutrophils show immunosuppressive ability [34, 91]. Generally speaking, we name these myeloid immunosuppressive cells as neutrophils with a “N2” phenotype. To examine the role of MSC in promoting N2 polarization, we use a specific experimental model in vitro, co-culturing MSC with peripheral blood mononucleated cells (PBMC) from healthy individuals, in order to generate MSC-educated neutrophils and elucidate the different role of tumor-associated versus healthy MSC in promoting immune evasion.
MATERIAL AND METHODS
SECTION-1 (S-1)
(S-1) Patients and sample collection
This study has been approved by the local ethical committee (Azienda ospedaliero Universitaria Policlinico-Vittorio Emanuele, #34/2013/VE). After written informed consent, samples were collected from CML patients and age-matched healthy donors (HD) at Division of Hematology, AOU Policlinico – OVE, University of Catania. This study enrolled 59 CML patients and for 42 of them samples were collected at diagnosis too. Twenty patients were treated with IM (14 of whom evaluated also at diagnosis), 20 with NIL (15 evaluated at diagnosis) and 19 with DAS (13 evaluated at diagnosis). Among NIL treated patients, 6 were in second-line, while for DAS 5 patients were in second-line and 1 in third-line of treatment (all 6 patients changed TKI because of IM resistance). During treatment, all patients were followed with a monthly CBC count, molecular evaluation of the BCR/ABL transcript every 3 months and cytogenetic evaluation every 6 months, according to ELN guidelines. Clinical data of CML patients at diagnosis included in this study are shown in Table 2.
Patients Gender Age BCR/ABL transcript levels HGB (g/dL) WBC (103/µL) PLT (103/µL) LDH (mg/dL)
1 M 67 81,37 11,2 72,2 355 2087 2 M 77 105,84 14,2 54,6 391 1426 3 F 73 59,77 11,1 30,7 651 - 4 M 56 66,29 12 164 526 2418 5 F 69 58,002 12.1 34 607 - 6 M 84 45,1 14 50,3 285 873 7 M 51 41,59 12,5 38,4 368 - 8 F 56 20,41 12,6 95 463 668 9 M 62 79,85 11,3 331 96 - 10 M 59 39,74 12,4 152,24 527 - 11 M 59 25,14 15,3 22,8 20 - 12 F 48 81,88 8,1 288 458 1043 13 F 71 48,16 9,2 70,5 338 2230 14 M 70 349,51 13,5 71,2 370 715 15 F 66 126,73 12,9 68,4 294 888 16 M 38 65,61 13,6 28,4 232 - 17 M 54 74,22 12,7 58 201 - 18 M 21 126,51 14,2 144 107 1247 19 M 53 142,78 16,6 34 311 288 20 M 61 33,66 14,4 51,6 399 983 21 M 48 40,33 9,9 256 350 1074 22 F 64 28,21 10,6 128,4 531 1147 23 F 57 122,97 11.4 156,6 273 1124 24 M 36 56,24 10,8 55 208 1352
25 M 52 14,89 10,2 46 418 1820 26 F 58 150,04 10,7 122,5 361 1683 27 F 65 191,66 15,3 87 252 688 28 F 72 71,98 13 111 168 345 29 F 78 48,26 11,7 77 651 - 30 M 37 153,59 12,8 91,6 344 1635 31 M 60 47 11 70 368 873 32 M 53 23,8 13 44 343 1820 33 F 62 31,5 11 22 98 - 34 F 73 68,8 14 315 543 723 35 F 67 58,7 12,6 120 521 - 36 M 58 23,00 12,4 23 44 - 37 M 47 78,2 11,9 98 98 1043 38 M 47 63 13,3 195 345 668 39 M 55 21 12.1 54 430 - 40 F 63 120 10,7 70 370 1683 41 M 43 44,6 12 122 333 2230 42 M 69 328 9 71 370 715 Table 2 part I
Patients Liver (cm) Spleen (cm) blast count Sokal score HASFORD score M-MDSC (%) Gr-MDSC (%)
1 0 0 0 low int 5,3 86,9 2 0 0 0 intermediate low 31 85 3 0 0 0 low - 0,7 72,7 4 2 0 0 high intermediate 20,02 82 5 0 0 0 intermediate low 10,2 81,4 6 0 0 0 intermediate intermediate 23 79 7 0 0 0 low low 26,9 87 8 0 - 0 intermediate - 29,8 79,4 9 6 4 5 high intermediate 37,7 85,4 10 2 3,5 0 intermediate - 50 88,7 11 0 0 0 low intermediate 18,9 87 12 2 14 3 high intermediate 41 86 13 - - - intermediate intermediate 46,8 89 14 0 0 1 intermediate intermediate 81,2 79 15 2 3 0 intermediate intermediate 12,4 82 16 0 0 0 low low 28,5 83,4 17 - - - low low 14,7 82 18 0 6 1 low low 81,6 83,7 19 0 3 0 low intermediate 63 83 20 0 0 1 low low 25 81 21 7 14 1 intermediate low 41 90 22 0 2 1 intermediate intermediate 1 58,3 23 2 1 1 low intermediate 61 88 24 7 8 1 low low 42,4 87 25 0 2 1 low intermediate 25 78 26 0 3 1 intermediate intermediate 50 75 27 0 0 0 low low 91,2 50 28 4 2 2 intermediate intermediate 14,4 75
29 0 1 2 high intermediate 5,4 64 30 0 0 0 low low 2,8 82,5 31 0 0 0 intermediate intermediate 28 88 32 0 2 1 low intermediate 25 79 33 0 0 0 low low 25,8 72 34 6 4 5 high intermediate 55 75 35 2 2 0 intermediate - 50 83 36 0 0 0 low intermediate 16 87 37 2 0 3 high intermediate 46 86 38 0 2 0 intermediate - 44 86 39 0 0 0 intermediate low 11 78 40 2 3 1 intermediate intermediate 50 81 41 - - - intermediate intermediate 37 77 42 0 0 1 intermediate intermediate 83,2 84 Table 2 part II
Table 2. Clinical disease characteristics of CML patients. The frequency and the fuctional characteristics of
MDSC analyzed in the PB from CML patients at diagnosis. HD were age matched. (F, female; M, male; HGB, hemoglobin; WBC, white blood cells; PLT, platelets; LDH, lactate dehydrogenase. BCR/ABL transcipt levels are calculated as BCR-ABL/ABL).
(S-1) Flow cytometry analysis of MDSC phenotype
The amount of MDSC was evaluated in peripheral blood (PB). Analysis of MDSC was performed by multicolor FACS analysis using the following antibody (Beckman Coulter): CD14 PC5 (clone RMO52), HLADR ECD (clone IMMU-357), CD11b FITC (clone bear-1), CD33 PE (clone D3HL60, 251) and their respective isotype controls. Briefly, 1x10⁶ cells
were stained with 10 µl of each of the above listed Abs and incubated for 20 minutes in the dark at room temperature. After lysing red cells with ammonium chloride, cells were analyzed by flow cytometer (Cytomics FC 500, Beckman Coulter) and analysis was performed using CXP Analysis software. Using sequential gating strategy (supplementary figure 1), G-MDSC cells were identified as cells CD11b+CD33+CD14-HLADR-, while the M-MDSC as
CD14+HLADR-. The results were expressed as percentage.
(S-1) Functional characterization of MDSC
To evaluate the suppressive ability, G-MDSC and M-MDSC from CML patients and HD were first isolated using magnetic separation (CD66b-positive selection for G-MDSC and CD14-positive/HLA-DR-negative for M-MDSC, Miltenyibiotec) and then the purity and viability were tested by flow cytometry; viability was more than 90%. MDSC were co-cultured for three days with autologous Carboxyfluorescein succinimidyl ester (CFSE)-labeled T lymphocytes at ratio 1:4 [91]. For cell labeling, 5x10⁵ lymphocytes were incubated
at 37°C for 20 min in 1 ml PBS containing 1 µM CFSE (BD Pharmingen). T cells were stimulated with 5 mg/mL phytohemagglutinin (PHA) and incubated for 72 hours prior to flow cytometry. Controls included a positive T cell proliferation control (T cells plus PHA) and a negative one (T cells only). After three days, T cell proliferation was measured by CFSE dilution and analyzed using flow cytometry.
(S-1) Western Blot Analysis
Western Blot Analysis was performed according to the manufacturer‘s recommendations. The antibodies directed against the human Tsg101 and CD63 were obtained from Santa Cruz Biothecnology. The blots were scanned, and determinated using Scion Image software (New York, NY).
(S-1) Soluble factors and exosomes for the generation of M-MDSC
Purification of monocytes from PB of 4 HD was performed by a positive selection of these cells using a magnetic separation kit (EasySep, STEMCELL Technologies, Vancouver, BC, Canada). Cell purity was determined by flow cytometry and was >90%. Monocytes were cultured with RPMI-1640 medium with 1% penicillin-streptomycin supplemented with 20% FBS or HD (n=4) or CML sera (n=6). After 72 h of incubation, cells were stained with M-MDSC Abs for flow cytometry analysis.
HD monocyets were also cultured in the presence of exosomes (30 µg protein/106 monocytes)
isolated from 5 CML serum patients at diagnosis.
(S-1) Isolation of serum exosomes
Serum exosomes were isolated and purified by differential ultracentrifugation according to a standard protocol for isolation of exosomes from viscous bodily fluids [130]. Serum was derived from heparinised blood, diluted 1:2 with PBS (phosphate -buffered saline) and centrifuged for 30 min at 2,000 x g at 4 C°. The supernatant was transferred to ultracentrifuge tubes and centrifuged using a 13.1 JS rotor (Beckman Instruments, Inc., Fullerton, CA) for 30 min at 12,000 x g, 4 C°. Supernatant was carefully transferred into fresh ultracentrifuge tubes and centrifuged using a SW28 rotor (Beckman Instruments, Inc., Fullerton, CA) at 110,000 x g for 2 h at 4°C. The resulting pellet , resuspended in 1 ml of PBS, was diluted with PBS, filtered through a 0.22-μm filter (Millex GP filter unit, Millipore, Billerica, MA) into fresh ultracentrifuge tubes and centrifuged in a SW28 rotor at 110,000 x g for 70 min at 4°C. Then the tube containing the pellet was resuspended in 1 ml of PBS, filled with PBS and centrifuged at 110,000 x g for 70 min at 4°C. The crude exosomes were resuspended in
50-100 μl of PBS for their characterization by scanning transmission and immunoelectron microscopy.
(S-1) Scanning Electron Microscopy (SEM)
Exosomes (20 µl) were fixed in 80 µl of 2% glutaraldehyde-0.1 M phosphate buffer and fixed overnight at 4°C. A drop of suspension was layered on a sterile cover glass coated with 0,1% poly-L-Lysine, postfixed in 1% osmium tetroxide (Merck, Darmstadt, Germany) in the same buffer for 1h at 4°C and washed in phosphate buffer. After dehydrating in a graded ethanol and critical point drying, the samples were sputtered with a 5nm gold layer using an Emscope SM 300 (Emscope Laboratories, Ashford, UK) and then observed. A Hitachi S-4000 (Hitachi High-Technologies America, Inc., Schaumburg, IL) field emission scanning electron microscope was used for the observations.
(S-1) Transmission Electron Microscopy (TEM)
Exosomes (20 µl) were fixed in 80 µl of 3% formaldehyde-0.1% glutaraldehyde overnight at 4°C. 5 µl of the above suspension was layered on a formvar copper coated nickel grids (Electron Microscopy Sciences, Fort Washington, PA) and allow to dry for 20 min to absorb exosomes. The grids, washed in PBS, were negatively stained with 4% uranyl acetate for 5 min and viewed using a Hitachi H-7000 transmission electron microscope (Hitachi High-Technologies Europe GmbH, Krefeld, Germany). For immunogold labeling the grids were rinsed for 2x2 min with PBS and transferred in a TBS (Tris-buffered saline pH 7,4) solution containing 1% BSA (bovine serum albumin) (TBS/BSA) for 10 min at room temperature. Then the grids were incubated in blocking solution 5% BSA for 1,30 h at room temperature, rinsed with PBS, and incubated in a humid chamber overnight at 4°C with a mouse monoclonal antibody CD81 (Santa Cruz Biotechnology, Heidelberg, Germany) in a dilution 1:50 with TBS/BSA. After wash for 3x3 min with TBS/BSA, the grids were stained with a 10 nm gold-labeled secondary antibody Anti-mouse IgG (Sigma Aldrich) in a dilution 1:5 with
TBS/BSA at 37°C for 1h in the dark. The grids were rinsed 2x2 with TBS/BSA, 2x2 with water and fixed with 1,5% glutaraldehyde in PBS for 10 min at room temperature. After rinsed again with water the grids were post-stained with 4% uranyl acetate for 5 min and allow to air drying. Observations were carried out using the transmission electron microscope. Negative controls were prepared in the absence of primary antibody but with secondary antibody-conjugate.
SECTION-2 (S-2)
(S-2) MSC harvest, culture and characterization
After written informed consent, BM samples were collected from patients with diagnosis of CML (n=10), of MGUS (n=10), smoldering (n=6) or active MM at first diagnosis (n=11) or relapse (n=5), and age-matched HD (n=10). Also MM-MSC from 3 refractory patients were collected. Clinical data of MM and MGUS patients included in this study are shown in Table 3-4.
BM mononuclear cells were obtained after density gradient centrifugation on Ficoll and cultured in low-glucose Dulbecco’s modified Eagle’s medium supplemented with 10% heat-inactivated FBS, 100 U/ml penicillin, 100 mg/ml streptomycin and 1% L-glutamine. After 3 days in culture, non-adherent cells were removed, whereas MSC were selected by their adherence to the plastic-ware. The cultures were maintained at 7°C and 5% CO 2. MSC were expanded until the third or fourth passage and then trypsinized to be used for experiments. Selected MSC from both patients and HD at the third passage were also tested for MSC specific surface antigen expression (supplentary figure 2). Therefore, cells were labeled using combinations of monoclonal antibodies: anti-CD34-ECD (clone 581), anti-CD90-FITC (clone F15.42.1.5), anti-CD105-PE (clone 1G2) and anti-CD45-PC5 (clone J.33). The appropriate isotopic control was also included. Labeled MSC were acquired using a Beckman Coulter FC-500 flow cytometer.
Moreover, MSC osteogenic and adipogenic ability differentiation was confirmed in two CML-, MGUS-, MM- and HD-MSC. In brief, for osteoblastic and adipocytic differentiations, 80% confluent MSCs were grown in medium supplemented with 10mM b-glycerol phosphate (Sigma-Aldrich, St Louis, MO, USA), 50 mg/ml ascorbic acid and 10nM dexamethasone for osteoblasts, or with 10 μg/ml insulin, 0.5 mM dexamethasone, 0.5 mM isobutylmethylxanthine and 0.1 mM indomethacin for adipocytes [131, 132]. Osteocytic and adipocytic differentiation of MSC was evaluated using alkaline phosphatase and Oil-Red-O respectively (data not showed).
Table 3: Baseline clinical characteristics of patients included in the study.
ESR: Erythrocyte Sedimentation Rate; ISS: International Staging System.
Table 4: Summary of refractory MM patients.
Type: paraproteins IgG or IgA, κ-light chains κ or λ-light chains λ
(S-2) Induction and evaluation of neutrophils “N2” polarization
Human peripheral blood mononucleated cells (PBMC) were isolated from healthy volunteer donors after density gradient centrifugation on Ficoll. PBMC were cultured alone or co-cul- tured with MSC derived from healthy subjects, patients with CML or MM (1:100 ratio) [133]. MSC were seeded to achieve confluence by 7 days. After one week, PBMC were collected and neutrophils were isolated using anti-CD66b magnetic microbeads (MiltenyiBiotec). Their
MGUS (n=10) Newly-diagnosed MM (n=16) Relapsed MM (n=5) Smouldering MM (n=7)
Median age (range) 67 (49-70) 65 (45-68) 67 (38-75) 64 (49-77)
Males/Females 7/3 10/6 3/2 5/2 Isotype, n IgG 0 10 2 4 IgA 10 4 2 2 Light-chain only 0 2 1 1 Cytogenetcs, n Normal 8 8 1 4 del 13 1 1 2 2 del 17 0 5 0 1 t(4;14) 0 1 2 0 not performed/failed 1 1 0 0 Haemoglobin, g/dl (range) 12.8 (12-14.5) 10.6 (6.5-13.8) 9.8 (6.6-12.8) 12.3 (12-13.9)
Platelets 1000/uL (range) 219 (180-315)
221 (90-384) 123 (43-225) 206 (113-315)
Bone marrow plasmocytosis >50%, n (%)
0 5 3 2
C-reactve protein median, mg/l (range) 0.1 (0.01-4) 4.4 (0.001-8.5) 5.3 (0.05-9.6) 0.7 (0.01-5) LDH median, mm/h 195 (132-213) 209 (109-708) 240 (125-368) 198 (134-250) ESR median, mm/h 17 (0-26) 72 (6-134) 84 (10-138) 16 (0-32) STAGE ISS, n 1 N.A. 4 0 7 2 N.A. 8 4 0 3 N.A. 4 1 0
purity and viability were confirmed by cytofluorimetric analysis (supplentary figure 3). The immunosuppressive capacity of educated neutrophils (ed-N) was analyzed by evaluating T cell anergy when co-cultured with autologous CFSE-labeled T cells stimulated with 5 mg/mL phytohemagglutinin (PHA). T cells were isolated by magnetic cell separation using human CD3 microbeads (Miltenyi Biotec). For T lymphocytes labeling, 5x10⁵ lymphocytes were incubated at 37°C for 20 min in 1 ml PBS containing 1 μM CFSE. Controls included a positive T cell proliferation control (T cells plus PHA) and a negative one (T cells only). After three days T cell proliferation was analyzed by flow cytometry.
Bortezomib (BTZ, 5 nM), lenalidomide (LEN, 10 μM) and pomalidomide (POMA, 1 μM) were added during co-culture of PBMNC with MM-MSC (from patients at diagnosis or relapsed or refractory) to investigate the effects of proteosome ihibitor (BTZ) and immunomodulating drugs (LENA and POMA) on neutrophils polarization.
To evaluate their pro-angiogenic effect in vitro, educated neutrophils were co-cultured with Human Brain Microvascular Endothelial Cells (HBMEC) (1:2).
To investigate the ability of PC to activate healthy MSC in cells with the same immunological alteration of MM-MSC, commercially available stromal cell lines HS-5 cells and HD-MSC were incubated with human MM cell lines (U266, MM1S) for 24 h (1:10) before to performe co-culture with PBMNC.
(S-2) Real-time RT-PCR for gene expression of MSC and educated neutrophils
For gene expression studies, MSC were trypsinized from culture flasks both at Time 0 (cells at confluence incubated with standard medium only) and after 48 hours from start of co-culture experiments. In co-co-culture experiments, MSC and educated neutrophils were purified using respectively anti-CD271 and anti-CD66b magnetic microbeads (MiltenyiBiotec). After RNA extraction and reverse transcription, we evaluated expression of the following mRNA: ARG1, NOS2, PTGS2, TNFα, TGFβ, IL6, IL10, IL8, IL32 and IL1β. Their expression was assessed by TaqMan Gene Expression (Life Technologies) and quantified using a fluorescence-based real-time detection method by 7900HT Fast Start (Life Technologies). For each sample, the relative expression level of each studied mRNA was normalized using GAPDH as invariant controls.
(S-2) Western Blot analysis
Western Blot analysis was performed using antibodies directed against the human MyD88, TLR4 and β-actin. The blots were scanned and determinated using Scion Image software.
(S-2) Immunofluorescence
Cells were grown directly on coverslips before immunofluorescence. After washing with phosphate-buffered saline (PBS), cells were fixed in in 4% paraformaldehyde for 20 minutes at room temperature. After fixation, cells were three times washed in PBS for 5 minutes. Subsequently, the cells were incubated with primary antibody against IRF3 (anti-rabbit) and NFKB (anti-mouse) at dilution 1:100, overnight at 4°C. Next day, cells were three times washed in PBS for 5 minutes and incubated with secondary antibodies: TRITC (anti-rabbit) at dilution 1:200, and FITC (anti-mouse) at dilution 1:200 for 1h at room temperature. The slides were mounted with medium containing DAPI (4′,6-diamidino-2-phenylindole) to visualize nuclei. The fluorescent images were obtained using a Zeiss Axio Imager Z1 Microscope with Apotome 2 system and was performed by Image J Software.
(S-2) Zebrafish as in vivo model 1. Zebrafish husbandry
Adult (5–8 month-old) wild-type AB zebrafish (Danio rerio) were maintained under conditions according to the Organisation for Economic Cooperation and Development guidelines. Fish were kept in a flow-through system with a light/dark cycle of 14 h/10 h and were fed with SDS 400 food twice daily.
2. Xenotransplantation procedure
Zebrafish were anesthetized with 0.02% tricaine (Sigma-Aldrich) and injected with suspensions of MM cell lines (U266 or MM1S) mixed with HD- or MM-MSC in a 1:1 ratio [134, 135] in PBS (5x10⁴/5x104) using a borosilicate glass capillary and a MICROINJECTOR
system.
Prior to implantation, MM cells were labeled for coimplantation with MSC with DiIC18(5)-DS (1,1'-Dioctadecyl-3,3,3',3'-Tetramethylindodicarbocyanine-5,5'-Disulfonic Acid) (ThermoFisher) at a final concentration of 1 mmol/L for 5 minutes at 37°C in a 5% CO2 atmosphere and 15 minutes at 4°C.
We evaluated the tumor xenografts by tomography 6 days post-injection, measuring the tumor volume and intensity of fluorescence with ImageJ software [136].
3. Flow cytometry analysis
MM cell xenograft was determined by flow cytometry. Wild-type adult zebrafish were anaesthetized with 0.02% tricaine and the kidney/marrow and other extracted organs were dissected and placed in PBS as described. Single cell suspensions were generated by passing through a nylon mesh and stained with propidium iodide (Sigma) was to exclude dead cells. Staining with the human monoclonal antobodies against CD138 was performed. To evaluate
MSC xenograft, human CD90 antibody was also used. All These human mAb did not show cross-reactivity with Zebrafish cells.
4. Real time PCR
By using Trizol reagent, total RNA was extracted from kidney/marrow and total of organs. After reverse transcription, we evaluated expression of the following mRNA: TBX21, GATA3, INFγ, IL4, IL13. Their expression was assessed by TaqMan Gene Expression (Life Technologies) and quantified using a fluorescence-based real-time detection method by 7900HT Fast Start (Life Technologies). Expression was normalized to the expression of the housekeeping gene, GAPDH.
Statistical analysis
The data are expressed as mean ± SD. Statistical analysis was carried out by paired Student's t-test, ANOVA test or Mann-Whitney test. For correlation analysis, the Pearson’s correlation was assessed. A p value <0.05 was considered to indicate a statistically significant difference between experimental and control groups.
RESULTS
1. MONOCYTIC MYELOID DERIVED SUPPRESSOR CELLS (M-MDSC) AS PROGNOSTIC FACTOR IN CHRONIC MYELOID LEUKEMIA PATIENTS TREATED WITH DASATINIB (SECTION 1)
1.1 MDSC are increased in CML patients
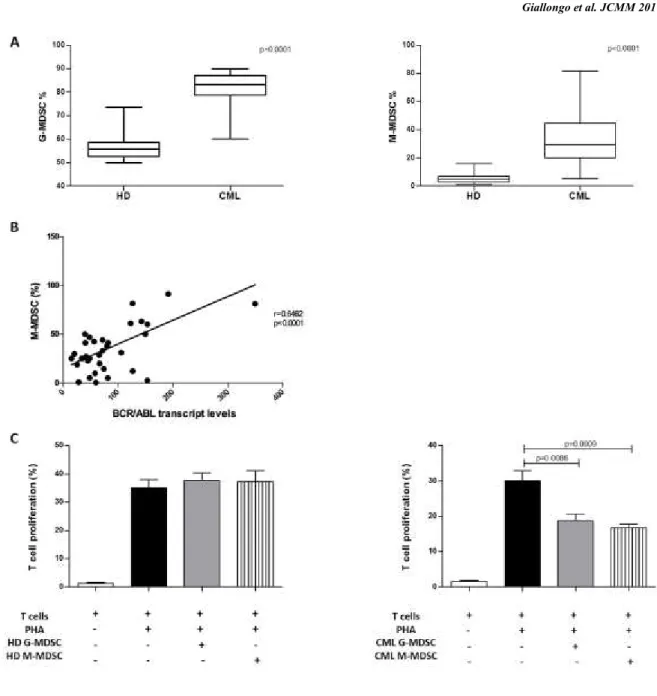
G-MDSC and M-MDSC percentages in CML patients at diagnosis were greater than HD subjects (respectively 84±9% vs 56.2±5.4% and 32±20% vs 5.9±4%, p<0.0001) (Figure 6A). Moreover, the frequency of M-MDSC significantly correlated with BCR/ABL transcript levels (r=0.64, p<0.0001) (Figure 6B). The percentages of G-MDSC and M-MDSC did not correlate neither with age, nor with leukocytosis or Sokal risk. To validate whether these increased myeloid subpopulations were MDSC cells, their immunosuppressive activity was investigated. For this purpose, we isolated by magnetic separation CD14-negative (representative of M-MDSC) and CD66b-positive (representative of G-MDSC) cells from both CML patients at diagnosis and healthy controls and incubated them with autologous CFSE-labeled T cells.
On the contrary of immature myeloid cells with G-MDSC or M-MDSC phenotype isolated from healthy donors, both G-MDSC and M-MDSC from CML patients were able to inhibit T cells proliferation in comparison to positive control (from 30±4.8% to 18.7±3.8% for G-MDSC, p=0.0086 and to 16.7±2.5% for M-G-MDSC, p=0.0009) (Figure 6C).
Giallongo et al. JCMM 2017
Figure 6. Increased frequency of MDSC in untreated CML patients. A. The percentages of circulating
G-MDSC and M-G-MDSC were quantified in the peripheral blood. Flow cytometry analysis was performed with gates set on either CD11b+CD33+CD14-HLADR- (G-MDSC) or CD14+HLADR- (M-MDSC) cell populations.
The bars represent the standard error of the mean. B. Correlation analyses of the peripheral M-MDSC count with BCR/ABL transcript levels calculated using the Pearson’s correlation analysis C. Granulocytic and monocytic MDSC mediated T cell suppression in autologous co-cultures. MDSC was previously tested for cell viability by using cytofluorimetric analysis. Mean frequency of CD3+CFSEdim cells±SD from four independent experiments
1.2 M-MDSC percentage correlates with MMR in dasatinb treated patients
CML patients were followed during therapy with IM, NIL or DAS. All TKI decreased the levels of G-MDSC at 3-6 months (from 82.5±9.6% to 55±17.3% after IM, to 60.9±9% after NIL and to 48.7±13% after DAS, p<0.0001) and 9-12 months (64±8% after IM, 61±6.3% after NIL and 32±15% after DAS, p<0.0001) of treatment (Figure 7A). The percentage of M-MDSC significantly decreased after DAS therapy only (from 33.6±19% to 6.8±12.6% at 6 months, p=0.014 and to 12±11.8% at 12 months, p=0.004). In fact, M-MDSC reduction was also observed but did not reach statistical significance after IM (22.2±24.5% and 20.8±18.6% respectively at 6 and 12 months) and after NIL treatment (21±19.9% and 19±17% at 6 and 12 months)with a great variability among patients.
MDSC accumulation correlates with disease progression and minimal residual disease in myeloma and leukemia patients [15, 129]. Therefore, we analyzed the correlation of MDSC with clinical response to TKI. On the contrary of IM and NIL treated patients (data not shown), we found a correlation between the MMR values and the number of persistent M-MDSC at 12 months. Indeed, a significant difference was observed comparing the percentage of M-MDSC in the MMR group (n=8) versus no MMR (n=11) (p=0.0025) (Figure 7B). Figure 7C shows the frequency of M-MDSC for patients evaluated both at diagnosis and after 12 months of treatment with dasatinib.
Giallongo et al. JCMM 2017
Figure 7. MDSC after TKI therapy. A. Changes in circulating G-MDSC and M-MDSC in CML patients
treated with IM, NIL or DAS. The bars represent the standard error of the mean. G-MDSC at 3-6 and 9-12 months after IM, NIL and DAS: p<0.0001. M-MDSC after 3-6 months of DAS therapy: p<0.05; after 9-12
months of DAS treatment: p<0.01. B. The percentage of M-MDSC was compared between the MMR and no MMR groups. The bars represent the standard error of the mean. Statistical difference was calculated using Mann-Whitney test. C. M-MDSC count for 15 patients at diagnosis and after 12 months of therapy with DAS. Lines with empty circle represent patients no in MMR at 12 months. MMR, major molecular response;
BCR-ABL is ≤0.1%.
1.3 CML cells are able to induce M-MDSC by secreting soluble factors
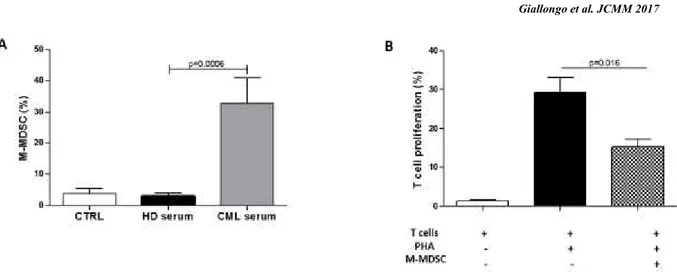
To evaluate whether leukemic cells were able to expand MDSC, we cultured monocytes isolated from healthy controls with sera from healthy subjects or CML patients at diagnosis. Monocytes displayed phenotypic conversion into CD14+HLADR- only in conditions with
CML sera where the percentage of M-MDSC increased by 29±13%, p=0.0006 (Figure 8A). No changes were observed by incubating monocytes with serum from healthy subjects. On the contrary, G-MDSC percentage did not change by addition of neither CML or healthy donor (HD) serum (data not showed). In line with their MDSC-like phenotype, CML serum-educated monocytes showed suppressive ability after incubation with autologous T lymphocytes (Figure 8B).
Giallongo et al. JCMM 2017
Figure 8. CML serum induces M-MDSC with T cell suppressive ability. A. Monocytes displayed phenotypic
conversion into CD14+HLADR- after incubation with CML serum for 3 days. Results represent the means of four independent experiment; error bars denote SD. B. Suppressive activity of CML serum-educated M-MDSC
(CML s-ed M-MDSC) was evaluated in co-culture experiments with CFSE-labeled autologous T lymphocytes. Mean frequency of CD3+CFSEdim cells±SD from four independent experiments in duplicate is shown.
1.4 CML-derived exosomes promote M-MDSC expansion
A number of studies have recently described tumor released exosomes as new key players in modulating the tumor microenvironment, promoting angiogenesis, tumor development and inhibition of immune cells [137, 138]. Exosomes isolated from CML serum satisfied the three major criteria as exosomes: the size of 50-100 nm in diameter (Figure 9A; a1-2), a density of 1.13 to 1.21 g/dl in a sucrose gradient and expressed CD80 (Figure 9A; a3), Tsg101 and CD63 proteins (Figure 9B). Incubating healthy monocytes with CML exosomes, we observed higher percentage of M-MDSC (from 9.4±2.7% in untreated condition to 17.4±5.5% in CML exosomes treated monocytes; p=0.006) (Figure 9C). We also demonstrated the immunosuppressive activity of CML Ex-educated M-MDSC in vitro (Figure 9D).
Giallongo et al. JCMM 2017
Figure 9. CML exosomes promote the generation of M-MDSC. A. a1: Representative TEM image of CML
serum exosomes (Ex). The exosomes show a characteristic “deflated football –shaped” of 60-100 nm in size (Bar= 120 nm). a2: A SEM image of CML exosomes at high magnification (x 30.000). a3: The exosomes are
Western blot analysis of protein extracted from exosomes. C. An increase of the percentage of CD14+/HLADR- cells was observed in vitro after incubation of HD monocytes with CML exosomes (p<0.05). Results represent the means of four independent experiment; error bars denote SD. D. Suppressive activity of CML exosomes-educated M-MDSC (CML Ex-ed M-MDSC) was evaluated in co-culture experiments with CFSE-labeled autologous T lymphocytes. Mean frequency of CD3+CFSEdim cells±SD from four independent experiments in
duplicate is shown.
2. Mesenchymal Stromal Cells (MSC) As Key Players in the Tumor Microenvironment Transformation (SECTION 2)
Since neutrophils from CML and MM patients are immunosuppressive and the levels of G-MDSC are increased, we investigated the role of MSC in the polarization of neutrophils toward a “N2” phenotype.
Figure 10. Model for education of neutrophils in vitro. After one week, PBMC were collected and neutrophils
were isolated using anti-CD66b magnetic microbeads. Their immunosuppressive capacity was analyzed by evaluating T cell anergy when co-cultured with autologous CFSE-labeled T cells stimulated with PHA.
2.1 CML-MSC activate immature myeloid cells (IMC) in immunosuppressive neutrophils
2.1.1 N2 polarization is driven by disfunctional MSC
Following the model reported in figure 10, we cultured PBMC of healthy subjects in medium alone or with HD- or CML-MSC. After one week, both HD- and CML-MSC accumulated similar amount of neutrophils (Figure 11A). After magnetic cell separation, we analyzed if educated neutrophils (ed-N) were converted in immunosuppressive “N2”, co-culturing them with autologous CFSE+ T cells. We found that only CML-MSCed-N inhibited T cell
proliferation (32±12% vs 63±5.9% observed in the condition with neutrophils isolated from PBMC cultured in medium alone) (p=0.003). On the contrary, HD-MSCed-N did not show any suppressive effect (Figure 11B).
Giallongo C. et al.; PlosONE 2016
Figure 11. CML-MSC-educated neutrophils are immunosuppressive. A. HD- and CML-MSC generate
similar amount of neutrophil-like cells. The figure shows a representative data from one experiment. Flow cytometry analysis was performed with gates set on CD11b+CD33+CD15+CD14-HLADR- cell population. B. MSCed-N were analyzed for their immunosuppressive activity against autologous T cells. Representative flow
cytometry dot-plots show the gating strategy for each experimental condition. The data represent mean±SD of all analyzed co-cultures in triplicate.
2.1.2 CML-MSC up-regulate immunomodulatory factors
It is well known that polarization of neutrophils in “N2” can be induced by multiple factors present in the tumor microenvironment. Immunomodulatory factors, including TNFα, TGFβ, IL6, IL10, IL1β, ARG1, NOS2 and COX2 are important to reprogram immature myeloid cells to become immunosuppressive neutrophils [23]. Therefore, we first analyzed their expression by MSC at Time 0. Despite a great variability among patients, we found a significant up-regulation of IL6 (5±2.8, p=0.04), COX2 (19±4.4, p=0.04) and TGFβ (6±3, p=0.01) by CML-MSC compared to HD- ones (Figure 12A). Expression of TNFα gene was down-regulated (0.55±1, p=0.027). After 48 h of co-culture with PBMC, CML MSC showed up-regulation of IL6 (54.3±23, p=0.003), TGFβ (4.8±3, p=0.04) and IL10 (5.6±2.8, p=0.03) expression (Figure 12B), suggesting that multiple mechanisms are involved in neutrophils polarization by CML-MSC.
Giallongo C. et al.; PlosONE 2016
Figure 12. Expression of immunomodulatory factors by CML-MSC. Compared to HD-MSC, CML-MSC
up-regulated IL6, COX2 and TGFβ at Time 0 (A) and overexpressed IL6, TGFβ and IL10 after 48 h of co-culture with PBMC (B). Calculated value of 2^-ΔΔCt in HD-MSC was 1.
2.1.3 Gene expression of immunomodulatory factors in CML-MSC educated-neutrophils To test whether the changes of gene expression in CML-MSC during co-culture also occurred in CML-MSCed-N, we examined the expression of the same genes in neutrophils isolated after co-culture. Compared to neutrophils educated in co-culture with HD-MSC, CML-MSCed-N showed higher levels of ARG1 (23.5±11.9, p=0.02), IL6 (33.8±13.9, p=0.004), IL1β (47.3±25.2, p=0.001), COX2 (20.7±10.9, p=0.002) and TNFα (20.8±19.3, p=0.006) (Figure 13).
Giallongo C. et al.; PlosONE 2016
Figure 13. Expression of immunomodulatory factors by MSC educated-neutrophils. Compared to HD-,
CML-MSCed-N expressed higher levels of ARG1, IL6, IL1β, COX2 and TNFα in respect with HD-MSCed-N. Calculated value of 2^- ΔΔCt in HD-MSCedG-MDSC was 1.
2.2 Mesenchymal Stromal Cells (MSC) as key players in promoting immunune escape and tumor microenvironment transformation from MGUS to Myeloma
2.2.1 MM-MSC polarized neutrophils versus a “N2” phenotype
Following the model reported in figure 10 and used to analyze CML-MSC, PBMC from healthy donors were co-cultured with healthy controls (HC)-, MGUS- or MM-MSC for one week. After magnetic cell separation, we found that only SN and MM-MSCed-N were able to suppress T cell proliferation (Figure 14A). MM-MSCed-No effects were observed after incubation of T lymphocytes with MGUS-MSCed-N or HC-MSCed-N or N control (isolated from PBMC cultured in medium alone). As MSC from patients at diagnosis, also MM-MSC from subject with refractory MM induced neutrophils to become immunosuppressive.
Adding Bortezomib, Lenalidomide or Pomalidomide during co-culture with MM-MSC, isolated neutrophils did not lose immunosuppressive ability (Figure 14C).
Before incubation with T cells, the expression of our set of immune modulatory factors was investigated in MM-, SMM- and MGUS-MSCed-N using HC-MSCed-N as control. On the contrary of MGUS-MSCed-N, SMM- and MM-MSCed-N significantly up-regulated ARG1, NOS2 and TNFα (figure 14B). Up-regulation of ARG1 and NOS2 is the main mechanisms of MDSC-induced immune-suppression [34], while TNFα has been shown to arrest differentiation of immature myeloid cells and increase neutrophils suppressive activity [139].
Figure 14. SMM- and MM MSC have the same immunological functional alterations. A. Only SMM- and
MM-MSCed-N exhibited suppressive effects compared to N control (isolated from PBMC cultured without MSC). CTRL+: T lymphocytes incubated only with PHA (positive control). B. Expresssion of immunomodulatory factors by neutrophils educated with MGUS-, SMM- or MM-MSC in respect with HC-MSC ed-N. Calculated value of 2^-ΔΔCt in control (HC-MSC educated-neutrophils) was 1. *p<0.05; **p<0.001. C.
Adding BTZ (5 nM), LENA (10 uM) or POMA (1 uM) during co-culture with MM-MSC, isolated neutrophils did not lose immunosuppressive ability.
2.2.2 Molecular regulators of MM-MSC-mediated neutrophils activation
In many cancers, it has been demonstrated that tumor-associated microenvironment produces a large amount of immune-modulating factors involved in reprogramming immature myeloid cells to become immunosuppressive neutrophils and to attract them at the tumor sites. These immunomodulatory factors include PTGS2, TGFβ, NOS2, IL10, TNFα, IL1β, and IL6. Therefore, we analyzed their expression by MM-MSC in respect with HD-MSC at Time 0. A great variability of expression was observed among the patients, but no up-regulation of the genes above described was observed (Figure 15A). On the contrary after 48h from the start of co-culture with PBMC, MM-MSC showed higher expression of PTGS2 (5.8±5, p=0.018), TGFβ (27.8±34, p=0.03), NOS2 (20±25.8, p=0.04) and IL6 (20.7±22, p=0.02) expression (Figure 15B), suggesting that MM-MSC are functionally different from HD-MSC and are able to produce higher amount of immunomodulatory factors that could be involved in neutrophils activation versus a “N2” phenotype.
Giallongo et al.; Oncotarget 2016
Figure 15: Expression of immune-modulatory factors by MM-MSC at Time 0 (A) and after 48 h of co-culture with PBMC (B). Only after incubation with PBMC, MM-MSC showed statistically signicant up-regulation of PTGS2, TGFβ, NOS2 and IL6 expression (p<0.05) compared with HD-MSC (calculated value of 2^-ΔΔCt in HD-MSC was 1).
2.2.3 MM-MSC educated neutrophils promote angiogenesis in vitro
A clinically relevant aspect of multiple myeloma BM microenvironment is neovascularization, a constant hallmark of disease progression. In addition to soluble factors directly secreted by the tumor cells, myeloma plasma cells also induce angiogenesis indirectly via recruitment and activation of stromal inflammatory cells such as macrophages and mast cells which secrete their own angiogenic factors [140]. In addition to suppress immune response, neutrophils with pro-tumor phenotype could promote tumor development by promoting angiogenesis. Therefore, we next investigated in vitro the pro-angiogenic effect of MM-MSCed-N and observed the increase of both tube length and meshes number compared to N control (isolated from PBMC cultured in medium alone) (p<0.05) (Figure 16). Also neutrophils isolated from co-culture with MSC obtained from refractory MM patients showed pro-angiogenic effects. Adding BTZ, LENA or POMA during co-culture with MM-MSC, isolated neutrophils lose their pro-angiogenic capacity.
Figure 16. MM-MSCed-N have pro-angiogenic activity in vitro. IHBMEC were plated on Matrigel in the absence (1, control) or presence of VEGF-A (2, positive control), of MM-MSCed-N (3), MM-MSCed-N isolated from co-culture with BTZ (4) or LENA (5), refractory MM-MSCed-N (6) or refractory MM-MSCed-N isolated