What-if Scenario Analysis for IT Services in
Hybrid Cloud Environments with BDMaaS+
Walter Cerroni
∗, Luca Foschini
†, Genady Ya. Grabarnik
‡, Larisa Shwartz
§, Mauro Tortonesi
¶ ∗ Department of Electrical, Electronic and Information Engineering, University of Bologna, Bologna, Italy†Department of Computer Science and Engineering, University of Bologna, Bologna, Italy
‡Department of Mathematics and Computer Science, St. John’s University, Queens, NY, USA
§Operational Innovation, IBM TJ Watson Research Center, NY, USA
¶ Department of Mathematics and Computer Science, University of Ferrara, Ferrara, Italy
Abstract—The high sophistication of IT services, more and more often operated over distributed hybrid Cloud environments, makes it extremely difficult to evaluate the impact of changes at the business level over service architecture before deploying them. The performance assessment of possible alternative deployments calls for decision support tools to enable what-if scenario analysis, which requires also to adopt realistic Cloud network models, currently not available. To fill that gap, this paper illustrates the potential of our Business-Driven Management as a Service Plus (BDMaaS+) support that eases management operations in the above context, and presents a thorough experimental evaluation of our solution. Collected results demonstrate how a service provider can leverage BDMaaS+ to explore the potential of high-level business Service Level Agreement (SLA) changes and data center additions to optimize the performance of an enterprise class IT service deployed, in a realistic hybrid Cloud environment, before (re-)enacting them.
Index Terms—Cloud Computing, Optimization, Simulation.
I. INTRODUCTION
Technological advances and aggressive commercial offer-ings in Cloud computing are pushing an ever growing number of companies to migrate part of the IT services hosted in their private data centers to the Cloud. Along this direction, Cloud bursting, namely, the practice of temporarily leveraging Cloud-based virtual resources to deal with computationally very expensive tasks or significant spikes in request loads, is becoming more and more commonly adopted in privately hosted IT services. These phenomena are opening brand new research issues to govern in a dynamic fashion the man-agement of complex services deployed in highly intermixed and distributed public-private virtualized Cloud environments, namely, hybrid Cloud scenarios [1].
Hybrid Cloud scenarios present service providers with com-pelling opportunities to optimize their IT architecture, e.g., by moving some components to different Cloud data centers or switching to Service Level Agreements (SLAs) that are
more convenient from both the service provider’s and the end customer’s perspectives. However, the high sophistication of modern IT services and the complexity of hybrid Cloud environments make it extremely difficult, at the business level, to evaluate the impact of changes to an IT service architecture before deploying them [2]. The performance assessment of possible alternative deployments calls for new and sophisti-cated service management tools that provide what-if scenario analysisfunctions. Those tools should be capable of exploring alternative IT service architectures and of evaluating their per-formance through a comprehensive business level behavioral analysis, with the purpose of identifying the most convenient one.
However, the realization of similar management tools presents significant challenges in IT service modeling and evaluation. First, the complex nature of modern hybrid Cloud IT services, that implement a large number of workflows on top of many software components of different types deployed in heterogeneous environments, makes it difficult to estimate the impact of (even simple) reconfigurations of the IT service architecture. Second, at the current stage, there is still no widely recognized standard-de-facto observatory of the per-formances provided by main Cloud players, e.g., in terms not only of unit costs, but also of provided service levels, such as response time, network delay in the core Cloud network, both within the same or between different data centers (intra-/inter-data center latency). Third, while a number of studies and theoretical models have been proposed that effectively address the service placement problem [3] [4] [5], only few simulation tools are available [6] and to the best of our knowledge none of them is able, at the same time, to: i) provide a realistic model for the Internet and inter-data center delays in a hybrid Cloud scenario; ii) take into account complex business-level specifications; and iii) provide realistic templates of complex multi-tier application workflows.
To overcome all those open issues, we propose a novel
solution called Business-Driven Management as a Service Plus (BDMaaS+) that significantly evolves our previous BDMaaS proposal [7] by showing several new elements of technical novelty. First, it supports the placement of realistic multi-tier services consisting of complex workflows made by multiple application components of different types (e.g., Web Server, App Server, Relational Databases, Transaction Servers and Queue Managers). Such a placement is based on real network measurements and monetary costs for a large-scale Cloud computing environment, implemented on top of 6 different Amazon EC2 data centers and 2 private Clouds. Second, BDMaaS+ leverages our experience in both service/system modeling and inter-data center network delay modeling to feed our novel simulator with realistic characterizations, to be accounted for by the dynamic re-adaptation of component deployment at runtime [8]. Third, it adopts a simulative approach to reenact IT services under different configurations to accurately capture peculiar behavior of real-life IT services, and it adopts an innovative optimization solution based on a memetic algorithm to enable robust and resilient exploration of the large and challenging search space, thus realizing an effective what-if scenario analysis tool [9]. Fourth, BDMaaS+ has been implemented and used to collect a wide set of exper-imental results that show the benefits and original aspects of our proposal demonstrating the effectiveness of our solution; we also make BDMaaS+ available to the community working in the field1.
II. DEPLOYMENT OFCOMPLEXIT SERVICES OVER
HYBRIDCLOUDENVIRONMENTS
To evaluate our techniques and tools, we devised a realistic case study capturing the behavior of an enterprise-class IT service deployed on a large scale for customers with global presence. More specifically, we considered a Money Manage-ment and Transfer System IT service (MMTS in the following) that allows users to manage their bank accounts and to submit money transfer request. We believe MMTS represents an interesting case study which raises non-trivial challenges from the optimal software component placement perspective. In fact, this type of IT services often leverage legacy software components that cannot be easily migrated, and other software components that implement sensitive functions and whose deployment thus has to withstand security constraints; in both cases they must be deployed in a local private Cloud.
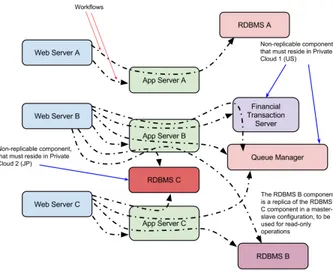
MMTS consists of 3 applications, which we label A, B, and C. A is an ASP.NET application running on Microsoft Windows, B is a Web application based on the LAR (Linux, Apache, Ruby on Rails) stack, and C is a LEMP (Linux, Nginx, MySQL, PHP) application. The architecture of the applications, depicted in Fig. 1 along to the 12 different workflows implemented by MMTS, mostly follows the classic 3-tier paradigm, with a Web Server, an Application Server and 1For more information about the BDMaaS+ software, installation,
config-uration language, experimental results, etc., we refer the reader to the project home page: https://de.unife.it/dsg/research-projects/BDMaaS.
a DataBase Management System (DBMS). However, the 3-tier paradigm is extended by some components, such as the Financial Transaction System and the Queue Manager that represents the interface to a reporting system based, e.g., on PDF document generation and submission through an e-mail Server. Let us briefly note that the reporting function represents an external support system for MMTS, and thus we do not consider it in the software component placement. In addition, applications B and C share the same replicated DataBase: a MySQL DBMS configured with master/slave replication.
Fig. 1. Architecture of distributed, multi-tier service case study.
For MMTS deployment, we consider a federation of 8 different Cloud facility locations. More specifically, we con-sider 6 public Cloud data centers, namely Amazon EC2’s us-west-1, us-east-1, eu-us-west-1, southeast-2, sa-east-1, and ap-southeast-1 data centers, and 2 private Cloud data centers, respectively located in northwestern USA and in Japan.
We also consider a few deployment constraints. The MySQL master component, identified as RDBMS C in Fig. 1, must reside in private Cloud data center 1 (US) for security reasons and cannot be migrated to any other data center. The Financial Transaction System component is implemented by a legacy system, residing in private Cloud data center 2, which cannot be migrated to another data center. All the other software components can be allocated to any data center.
We consider a customer with global presence, with one divi-sion in each of the following locations: East Coast USA, West Coast USA, South America, Asia, Europe. The divisions are of varying sizes and account for a different share of requests: 11.1%, 16.6%, 27.8%, 33.3% and 11.1% respectively.
The service provider offering MMTS to its end customers might want to explore alternative configurations through what-if scenario analysis. For instance, it might want to understand what would happen if the customer moved one (or a part) of its divisions somewhere else. Or, it might want to understand if stipulating a different SLA with its customers could lead to significant savings that allow to propose a particularly convenient pricing for its IT service, or which kind of pricing
to offer in case a customer asked for a new SLA. Our contribution is a tool that enables service providers to simulate different configurations within what-if scenarios to identify the most convenient one from the business perspective.
III. BDMAAS+IN ANUTSHELL
Before delving into the details of the what-if analysis sup-port originally presented in this paper, let us briefly overview our BDMaaS+ framework; for more details, we refer interested readers also to [7].
For the sake of simplicity and generalization, BDMaaS+ currently focuses on Web Services (WSs) as the basic building blocks for the realization of complex IT services as workflows of WSs composed according to the WS Business Process Execution Language (WS-BPEL) standard. In other words, BDMaaS+ conceptually operates at the Platform-as-a-Service (PaaS) level with the main goal of finding the best placement configuration of the WSs in the distributed Cloud environment.
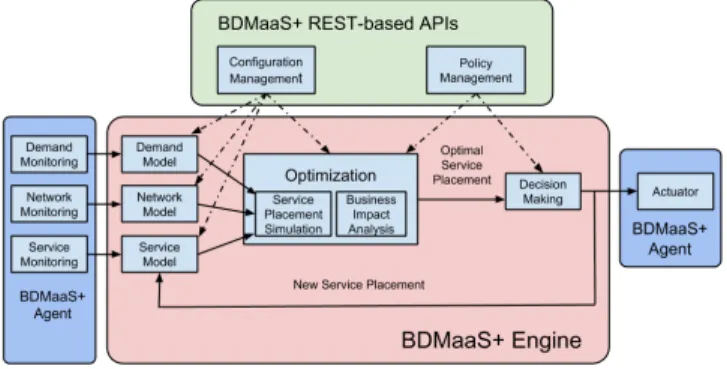
Fig. 2. The internal architecture of the BDMaaS+ support.
As regards the internal architecture of the BDMaaS+ frame-work, we organized it in several components addressing each needed management aspect. The API component, namely, BD-MaaS+ REST-based APIs, allows service providers to interact with the BDMaaS+ engine and includes two subcomponents, namely, Configuration Management and Policy Management. These subcomponents allow service providers to enter a con-figuration of the Cloud computing environment (e.g., number of data centers, service model, etc.), to select the optimization policies to apply (e.g., business objectives, parameters for the optimization algorithm, etc.), and to express in a declarative way through the definition of high-level business goals the what-if objectives to explore.
Focusing on the BDMaaS+ engine, it consists of three main stages that work in a pipeline, namely, modeling, optimiza-tion, and decision making. At the modeling stage, Demand Model, Network Model, and Service Model are the three main components. They provide, respectively, the functions for: i) building the models of the service user service request arrival process (e.g., customers’ locations, distributions of service request inter-arrival times, etc.); ii) gathering network measurements collected on-the-field by local measurement agents deployed at all private/public Cloud data centers to
draw realistic network models; iii) and emulating IT service execution and deployment (e.g., service time distribution, ser-vice component placement, etc.). These three modules are fed by their respective monitoring agent twins on the leftmost part of the figure that integrate with existing Cloud platforms to gather monitoring information about the infrastructure (virtual resources) and applications component levels by updating the parameters of the service execution model as better detailed in the next section.
The optimization stage consists of the Optimization macro-component and represents the core part of BDMaaS+. It is in charge of reenacting the Cloud computing IT service and of evaluating possible alternative service placement configura-tions over the hybrid Cloud environment. First, the Service Placement Simulation component mimics possible service placements among those generated by the modeling stage, leveraging the sisfc simulator that we realized and made available to the community working in the field2. Then, the
Business Impact Analysis component implements the per-formance analysis of the simulated configurations using the comprehensive business level evaluation techniques described in Section IV-D. More specifically, the component assigns an overall cost (namely, business impact) to each of these possible configurations by exploring them according to the current modelled/monitored context.
At the third stage, the Decision Making component se-lects the best IT service placement configuration, namely, the one minimizing the business impact, according to the user preferences, current network conditions, and the output data provided by the Optimization component. Finally, BDMaaS+ was designed to be easily integrated with existing Cloud-based IT services through lightweight BDMaaS agents in-stalled at each data center. Each agent includes three relatively simple and implementation-specific “connector” components: Demand Monitoring, Service Monitoring, and Actuator, de-picted in green in Fig. 2. Finally, the Actuator component is capable of automatically putting the new service configuration in place as required by the Decision Making component.
IV. IT SERVICEMODELING ANDEVALUATION
BDMaaS+ builds on top of modeling and business-driven evaluation concepts specifically designed to accurately reenact the behavior of IT services in hybrid Cloud environments for what-if scenario analysis purposes. More specifically, those concepts enable BDMaaS+ to measure how the whole service performance is affected by component reallocation to a differ-ent data cdiffer-enter. We believe that this model allows to capture the behavior of a large part of real-life IT service architectures and to easily challenge them through the definition of high-level what-if assertions.
2sisfcis a discrete event simulator that we specifically designed to
reen-act large scale Cloud services at the single service request granularity. sisfc is open source and can be downloaded at https://github.com/mtortonesi/sisfc.
A. Service Request/Response and Execution Models
We consider an IT service as a collection of (distributed) service entry points. Each entry point represents a simple Web service available to the customer, implementing a business process according to the WS-BPEL workflow semantics [10]. Since in our model the basic unit of load on the data center is a request for a workflow, it is essential to accurately model the request generation process and the service component execution. To enable a request generation model that is capable of accurately reenacting dynamic request loads considering the different service customers, we separately model the requests arriving from each customer (or from different customer divisions in case of large customers with global presence).
We assume that service requests are routed through a number of software components, according to the workflow definition specified in BDMaaS+’s configuration file. Software components are entities that are instantiated in a VM. BD-MaaS+ considers different sizes of VMs, with a corresponding amount of virtual (CPU, RAM, etc.) resources, and modulates the performance of a software component performance accord-ing to the size of the VM it is instantiated on.
In turn, service component execution is modeled using G/G/si FCFS queues. BDMaaS+ allows to specify either
parametric (e.g., Poisson, Gaussian, lognormal, etc.) or em-pirical (e.g., built from the analysis of service logs of real life software components) distributions for the modeling of each (software component, VM size) tuple, thus enabling the accurate modeling of a wide range of software components. B. Latency Model
One of the critical aspects that any hybrid Cloud service placement technique should take into account is the impact of the underlying network infrastructure, interconnecting the relevant private and public Cloud data centers. In particular, given the importance of modeling interactions among service components geographically distributed on remote data centers, we decided to focus our attention on network latency as a significant component of service responsiveness.
In order to come up with a realistic model of inter-data center latency, we adopted a statistical estimation methodology based on real-life delay measurements [8]. More specifically, our model builds on a data set of round-trip time (RTT) values measured by an extensive “ping” campaign performed between each pair of Amazon Elastic Compute Cloud (EC2) data center locations [11], [12]. A thorough analysis of the data set revealed that, besides the RTT measured in the campaign, another relevant parameter reported by the ping application is the value of the time-to-live (TTL) field in the IP header of the ping reply. In fact, for a given data center pair, we found some kind of correlation between significant variations of the RTT and the corresponding reported TTL value, which could probably mean that different network paths were taken by packets during the measurement interval. Such a path variability can have a significant impact on latency, because most of the RTT is due to processing and queuing time at intermediate nodes.
According to the aforementioned considerations, we devised an approximation model of the inter-data center latency based on the following Gaussian mixture formula, which estimates the RTT probability density function:
fRT T(t) = n X i=1 aie −(t−bi) 2 c2 i (1)
where t is the RTT expressed in milliseconds; ai= wi/p2πc2i
is the amplitude coefficient of the i-th Gaussian component, incorporating the weight wi and variance c2i coefficients; bi
is the mean (or shift) coefficient; ci is the standard deviation
coefficient.
Analyzing the collected data, we were able to identify the mixture model parameters with high accuracy (adjusted R2 ≥ 0.945) of all data center pairs. More specifically, we
built accurate latency models for 35% of the data center pairs using common fitting tools and 4 Gaussian compo-nents. Raising the number of Gaussian components to 8 allowed us to capture an additional 15% data center pairs. For the remaining data center pairs, we had to consider 2-dimension models: computing separate Gaussian mixtures for different TTL values we applied a weighted sum based on the proportion of ping replies measured with a given TTL value, capturing another 38% of data center pairs. For the remaining 12% of data center pairs we devised and applied the Relaxed Boxed Approximation (RBA) algorithm [8], which corrects the tendency towards either overfitting or underfitting in the Gaussian mixture models produced by common fitting tools by introducing bounding box constraints for each of the model parameters, according to domain-specific heuristics, while allowing the fitting algorithm some room for local optimization.
The approximation model described above allows us to generate very realistic instances of inter-data center latency to be used in the simulation of the BDMaaS+ framework, by also enabling the definition of advanced what-if analysis. C. Service Level Agreement (SLA) Model
BDMaaS+ adopts a simple but flexible Service Level Agree-ment (SLA)model. First, we define a Service Level Objective (SLO) as a tuple of workflow ID, metric measure, metric function, and target objective:
SLOi= (W Fi, µi, fi, θi)
where the metric measure µi and target objective θi are
either univariate or multivariate quantities. If the value fi(µi)
obtained for the metric does not fall within the target objec-tive value θi, an SLO violation occurs. We then define an
SLA SLAC stipulated with a customer C as a set of SLA
components SCj, each one represented by an SLO, violation
penalty, and time interval tuple:
BDMaaS+ allows a significant flexibility in the definition of SLOs, as well of custom metric measures and functions, of SLA components, and of SLAs through a dedicated domain specific language.
We believe that this model is generic enough to represent a wide range of SLAs used in real-life situations, as it enables to define SLO violation conditions that go beyond the trivial semantics of threshold comparison for metric and SLAs that consider multiple SLOs, even in non-trivial combinations. D. Business Impact Analysis of IT Service Configurations
BDMaaS+ performs the business-driven evaluation of a given configuration x for an IT service through a model that considers 3 subcomponents: IT spending cost evaluation, SLA violation penalties estimation, and performance drift assessment [7].
The first component calculates the operational costs caused by running system with configuration x according to the fees for all considered Cloud data centers. In hybrid Cloud envi-ronments, we need to consider both the pay-per-use pricing offering typically proposed by public Cloud platforms as well as dedicated cost models to that quantify IT related spending for virtual resource acquisition in private Cloud data centers. To this end, BDMaaS+ adopts the cost models discussed in [9].
The second component considers the cost of operating the IT service in configuration x from the contracting perspec-tive. To this end, BDMaaS+ evaluates the amount of SLO violation penalties that running the IT service in configuration x would cause the service provider to incur, analyzing the corresponding simulation logs. More specifically, referring to the SLA model discussed in Section IV-C, for each SLA component BDMaaS+ evaluates whether the corresponding SLO is met at every time interval. When there is an SLO violation, BDMaaS+ simulate its cost effect by transferring to service provider the corresponding penalty amount.
Finally, the third component calculates the costs related to performance regressions, risk management, and reconfig-urations for operating the IT service in configuration x with respect to the current configuration x0. These effects are not
fully captured by the previous 2 components alone, so we define a function to specifically address them.
V. EXPERIMENTALRESULTS
To demonstrate the effectiveness of our techniques and tools, we used BDMaaS+ to evaluate the realistic case study introduced in Section II for what-if scenario analysis purposes. In all the experiments we assume that the 2 private Cloud data centers have the same location as Amazon EC2’s us-west-2 and ap-northeast-1 data centers. The latency between their different locations is modeled according to the Gaussian mixture approximation presented in Section IV-B. We also assume that the latency for message transfers within a single location is significantly smaller than the inter-data center latency, and can thus be safely ignored.
We assume that the aggregated flow of request has a con-stant intensity - and whose interarrival times can be modeled with a Pareto distribution with location 1.2E-4 and shape 5, corresponding to 6,666.66 requests per second. The requests emanating from each division will be automatically forwarded to the closest Cloud data center. (This is a common practice, as for instance Amazon allows to do with its Route 53 system.) We configured BDMaaS+ to reenact the MMTS IT service in different configurations for 60 seconds of simulated time, plus 10 seconds of simulation warmup time, roughly corre-sponding to the processing of 400,000 service requests, and evaluate the performance of each configuration.
Finally, given the problem size and complexity, we config-ured BDMaaS+’s memetic optimization algorithm [9] to use a 40-particle swarm and a contraction-expansion coefficient α = 0.75 in the outer Quantum-inspired Particle Swarm Op-timisation algorithm and adopted an 8-sample random search for the inner simplified VM allocation algorithm.
A. Baseline Experiment
First, we ran a baseline experiment, in which we adopted a simple SLO penalty model based on considering a predefined penalty for each (customer division, workflow) couple in case the corresponding measured Mean Time To Resolution (MTTR) for service requests exceeded a predefined threshold. The penalty amounts we used are identical for each customer division, and are shown in Table I.
TABLE I
SLOPENALTY MODEL USED IN THE BASELINE EXPERIMENT. Workflows Trigger condition Penalty amount WF01-02 M T T R > 200ms 200 $/day WF03 M T T R > 200ms 300 $/day WF04 M T T R > 220ms 300 $/day WF05 M T T R > 300ms 300 $/day WF06 M T T R > 350ms 300 $/day WF07 M T T R > 180ms 400 $/day WF08 M T T R > 210ms 400 $/day WF09-12 M T T R > 330ms 400 $/day
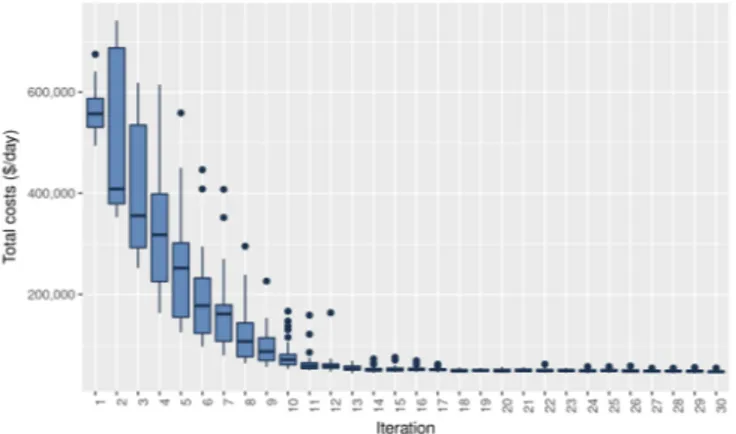
The results we obtained from applying BDMaaS+ to the case study described above are presented in Figs. 3-6. More specifically, Fig. 3 displays the total cost required to run the MMTS IT service in each of the different configurations explored by BDMaaS+. The total cost includes the IT cost and the SLO violation penalties, shown in Figs. 4 and 5 respectively. For completeness, we also show in Fig. 6 the per-formance penalty component, additionally taken into account by BDMaaS+ during the optimization process, as discussed in Section IV-D.
As it can be seen, in a very few iterations of the memetic algorithm, each one corresponding to the evaluation of 320 different IT service configurations, BDMaaS+ is capable of finding the optimal configuration for the system, reducing the
Fig. 3. Distribution of total costs for the evaluated configurations of MMTS at each iteration of the optimization algorithm in the baseline experiment.
total daily costs down to 43,306 $/day3.
Fig. 4. Distribution of IT costs for the evaluated configurations of MMTS at each iteration of the optimization algorithm in the baseline experiment.
Fig. 5. Distribution of SLO penalties for the evaluated configurations of MMTS at each iteration of the optimization algorithm in the baseline experiment.
3The strict document lenght constraints prevent us from including the
pictorial representation of the optimal allocation produced by BDMaaS+ in the manuscript. We refer the reader interested in that information to the https://de.unife.it/dsg/research-projects/BDMaaS/a-case-study Web page.
Fig. 6. Distribution of performance penalties for the evaluated configurations of MMTS at each iteration of the optimization algorithm in the baseline experiment.
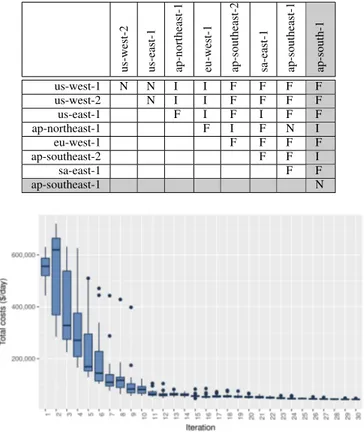
B. Validation of simplified latency model
To support the definition of deployment scenarios in BD-MaaS+ that consider data center locations for which no RTT information is available and hence no accurate latency model can be built, we devised a simplified version of the latency model in Section IV-B. More specifically, starting from the model based on real locations we used in the baseline experiment, we identified 3 levels of distance between data centers from the network latency perspective: near (N), intermediate (I), and far (F). Then we modeled the respective latency according to the Gaussian mixture obtained for the two Amazon EC2 data center pairs with the smallest (N case) and largest (F case) average latency, and then chose a third pair with an intermediate value between them (I case). The inner portion of Table II, i.e., excluding the cells with a gray background, shows the distances between the data centers considered in this scenario according to the simplified model. To validate this simplified latency model, we ran an exper-iment in which we considered the same 5 customer division and 8 data center locations of the baseline experiment but used the simplified latency model instead of the full one. The total costs for running the MMTS IT service in this case study are presented in Fig. 7. As one can see, the optimal configuration for the IT service corresponds to a total cost of 39,696 $/day. This means that the adoption of the simplified latency model in place of the accurate one introduces an 8.3% inaccuracy, a small but significant difference that demonstrates the importance of using a latency model that is as realistic as possible for the evaluation of IT services in hybrid Cloud scenarios.
C. Addition of a customer and data center location
We then ran a third experiment in which we consider the “what-if” scenario in which 1/3 of the requests from the Asia division of the customer located in Tokyo (next to private Cloud data center 2) moved to Mumbai, India. To support the changed needs of the customer’s Asia division, we extend the deployment scenario considered in the previous experiment to include Amazon EC2’s ap-south-1 data center.
TABLE II
SIMPLIFIED LATENCY MODEL FORCLOUD DATA CENTERS BASED ON THE
3IDENTIFIED DISTANCE LEVELS(N:NEAR, I:INTERMEDIATE, F:FAR).
us-west-2 us-east-1 ap-northeast-1 eu-west-1 ap-southeast-2 sa-east-1 ap-southeast-1 ap-south-1
us-west-1 N N I I F F F F us-west-2 N I I F F F F us-east-1 F I F I F F ap-northeast-1 F I F N I eu-west-1 F F F F ap-southeast-2 F F I sa-east-1 F F ap-southeast-1 N
Fig. 7. Distribution of total costs for the evaluated configurations of MMTS at each iteration of the optimization algorithm in the simplified latency model validation experiment.
Since we have no RTT data available for ap-southeast-1, we extrapolate an extended version of the simplified model that also considers the portion of Table II with gray background (bottom line and rightmost column).
The total costs for running the MMTS IT service in this case study are presented in Fig. 8. As one can see, BDMaaS+ is capable of optimizing the MMTS IT service for this extended scenario as well, reducing the costs to 43,378 $/day. This value is 9.3% higher than the one obtained from the previous experiment. This means that switching to a configuration of the MMTS IT service that considers a customer division in India would be expensive for the service provider, which should consider contracting a higher service price with its customer. D. Modified SLA model
As a second “what-if” experiment, we considered the adop-tion of a different SLO penalty model, using the accurate latency model as in the baseline experiment. More specifically, we defined an SLA in which the fundamental metric to con-sider for SLO violations is not the observed mean (MTTR) but the observed 99-percentile (99p) of request processing times. To this end, we adopted the SLO objectives and penalties defined in Table III, also applied in an identical fashion to each customer division as the previosly adopted SLO penalty model.
Fig. 8. Distribution of total costs for the evaluated configurations of MMTS at each iteration of the optimization algorithm in the 9 data centers and 6 customer divisions experiment.
TABLE III
SLOPENALTY MODEL USED IN THE MODIFIEDSLAEXPERIMENT. Workflows Trigger condition Penalty amount WF01-02 99p > 500ms 300 $/day WF03-04 99p > 500ms 500 $/day WF05-06 99p > 750ms 500 $/day WF07-08 99p > 500ms 800 $/day WF09-12 99p > 750ms 800 $/day
The total costs for running the MMTS IT service in this case study are presented in Fig. 9. As one can see, BDMaaS+ is capable of optimizing the MMTS IT service for this extended scenario as well, reducing the costs to 30,120 $/day. This is a considerably lower value (30.4%) than the one obtained from the baseline experiment. This means that the SLO penalty model in Table I is significantly more aggressive than the one in Table III, and that stipulating a contract that implements the switch from the former to the latter SLO penalty model would give the service provider a considerable leeway to lower the MMTS service pricing.
Fig. 9. Distribution of total costs for the evaluated configurations of MMTS at each iteration of the optimization algorithm in the modified SLA experiment.
E. Final remarks
In light of the 4 experiments presented above, we can formulate a few interesting conclusions. First, the memetic
optimization algorithm adopted by BDMaaS+ consistently exhibited a very good performance in terms of convergence speed, roughly reaching the optimum after just 11 iterations. We speculate that this is due to the adoption of the Quantum-inspired Particle Swarm Optimisation algorithm, which signif-icantly outperforms the solution based on genetic algorithms that we had adopted in earlier versions of BDMaaS+ [7].
Secondly, the experiments demonstrate the importance of evaluating an IT service using an accurate latency model as opposed to an approximated one. However, the adoption of a simplified latency model represents a quick way to extend a known deployment scenario to consider other data center / customer locations for which no RTT data is available, and to draw a first round of important lessons before investing resources to prepare a more realistic latency model. In any case, the results obtained with a simplified latency model should be confirmed by using an accurate latency model before putting in practice any corrective action on real world systems. In addition, the significant cost differences obtained in the first and last experiments seem to indicate that there is a large space for exploration for SLA definition with customers. What-if solutions such as BDMaaS+ can be instrumental in finding out more convenient configurations from the service provider perspective, that can allow to formulate particularly convenient pricing for end customers.
Finally, a consideration about the execution times of BD-MaaS+. Each of the experiments presented above took roughly one day to run in a workstation equipped with an 8-core Intel i7-3770 CPU and 16 GB RAM and running Arch Linux (kernel version 4.18.5), Java 10.0.2 and JRuby 9.2. In each experiment, 9600 different configurations for the IT services and 3.8 billion service requests were evaluated.
Given the consistent fast convergence exhibited by BD-MaaS+’s memetic algorithm and its capability to run unmodi-fied with a much larger parallelism, we speculate that a more recent computer (or VM) equipped with a 24-core or 32-core CPU would be fully capable to run those results in a few hours - thus enabling the continuous re-evaluation of complex IT services overnight. Let us also note that the simultaneous use of multiple computers to further increase the parallelism in “what-if” experiments would require only minor changes to the current version of BDMaaS+ and could significantly bring down the execution times - to the order of magnitude of one hour.
VI. RELATEDWORK
Early efforts in service placement in Cloud environments focused on load-balancing related objectives. Significant re-search addressed this topic at the infrastructure level by considering mainly internal IT objectives such as SLAs for service providers and technical requirements (e.g., physical host’s CPU, memory, etc.). A number of good surveys are also available in this field [13] [14]. In [15], the authors investigate load balancing in Cloud data centers with server and storage virtualization facilities while considering multiple
layers like servers, storage, and switches solving it using multi-dimensional knapsack. Network-aware VM placement while reducing the aggregate traffic into the data center (e.g., by co-locating VMs that highly communicate) is considered in [16]. Resilient to dynamic traffic time-variations VM placement, i.e. minimize the number of VM relocations, considered in [17].
Another another avenue of research considered the man-agement of large scale Cloud services with the objective of maximizing either service performance, Cloud provider revenues, or both. In a seminal work [18], Hagen and Kemper investigated the management of IT service and infrastructure changes to achieve SLOs and minimize costly business disrup-tions, focusing on a compelling real case study. Other works investigated the offering of resources and services in the form of Virtual Data Centers (VDCs). One of the most interesting is VDC Planner, which implements a migration framework to simultaneously minimize VM migration costs and optimize the success rate of VDC mapping requests [3]. Other works considered service component placement optimization using many different objectives and/or criteria such as dimensioning [19], job completion time [20], VM consolidation [21] [22], and energy saving [23] [24]. More recently, sophisticated autoscaling solutions emerged [25].
Compared to those works, the present manuscript belongs to a complementary area of research, which adopts a ser-vice provider-centric perspective. More specifically, BDMaaS+ adopts a comprehensive service cost model that, beyond virtual resource acquisition, also considers SLO violations and risk related aspects. In addition, our solution adopts a realistic latency model (that we recently presented in [8]) that improves existing similar works in the literature, such as [26]–[28], by considering both Round-Trip Time (RTT) and Time-To-Live (TTL) parameters to obtain more realistic values.
VII. CONCLUSIONS ANDFUTUREWORKS
The performance optimization of large IT service deploy-ments over hybrid Cloud environdeploy-ments can be extremely complex and calls for what-if-analysis-ready Cloud manage-ment tools. This paper presented BDMaaS+, a robust and comprehensive business-driven evaluation solution for service provider able to reproduce the behavior of real-life IT support organizations with a very high degree of accuracy. The exper-imental evaluation we conducted considering a realistic use case and several what-if scenarios demonstates the BDMaaS+ effectiveness in exploring alternative IT service configurations that maximize service provider overall revenues.
Encouraged by these results, we are now working on various future research directions. On the one hand, we are further refining the core modeling parts to obtain accurate evalu-ations integrating BDMaaS+ within stateof-the-art container orchestration technologies, to ease the deployment of workflow across different Cloud platforms; further evolving our meta-heuristics to be able to exploit different types of computing instances, including also on-demand and spot instances; im-plementing a permanent observatory for inter-/intra-datacenter network delays for all main public Cloud providers.
REFERENCES
[1] K. Bai, N. Ge, H. Jamjoom, E. Ea-Jan, L. Renganarayana, and X. Zhang, “What to Discover Before Migrating to the Cloud,” in Integrated Net-work Management (IM 2013), 2013 IFIP/IEEE International Symposium on. IEEE, 2013, pp. 320–327.
[2] A. Keller, “Challenges and directions in service management automation,” Journal of Network and Systems Management, vol. 25, no. 4, pp. 884–901, Oct 2017. [Online]. Available: https://doi.org/10.1007/s10922-017-9437-9
[3] M. F. Zhani, Q. Zhang, G. Simona, and R. Boutaba, “VDC Planner: Dynamic migration-aware Virtual Data Center embedding for Clouds,” in 2013 IFIP/IEEE International Symposium on Integrated Network Management (IM 2013), May 2013, pp. 18–25.
[4] Q. Zhang, Q. Zhu, M. F. Zhani, R. Boutaba, and J. L. Hellerstein, “Dynamic Service Placement in Geographically Distributed Clouds,” IEEE Journal on Selected Areas in Communications (JSAC), vol. 99, p. pp, 2013.
[5] W. Li, P. Sv¨ard, J. Tordsson, and E. Elmroth, “Cost-optimal cloud service placement under dynamic pricing schemes,” in 2013 IEEE/ACM 6th International Conference on Utility and Cloud Computing, Dec 2013, pp. 187–194.
[6] R. N. Calheiros, R. Ranjan, A. Beloglazov, C. A. F. De Rose, and R. Buyya, “Cloudsim: A toolkit for modeling and simulation of cloud computing environments and evaluation of resource provisioning algorithms,” Softw. Pract. Exper., vol. 41, no. 1, pp. 23–50, Jan. 2011. [Online]. Available: http://dx.doi.org/10.1002/spe.995
[7] M. Tortonesi and L. Foschini, “Business-driven service placement for highly dynamic and distributed cloud systems,” IEEE Transactions on Cloud Computing, pp. 1–1, 2016.
[8] W. Cerroni, L. Foschini, G. Y. Grabarnik, L. Shwartz, and M. Tortonesi, “Estimating delay times between cloud datacenters: A pragmatic mod-eling approach,” IEEE Communications Letters, vol. 22, no. 3, pp. 526– 529, March 2018.
[9] ——, “Service Placement for Hybrid Clouds Environments based on Realistic Network Measurements,” in 2018 International Conference on Network and Service Management (CNSM 2018) - miniconference track, November 2018.
[10] C. Ouyang, E. Verbeek, W. M. van der Aalst, S. Breutel, M. Dumas, and A. H. ter Hofstede, “Formal semantics and analysis of control flow in WS-BPEL,” Science of Computer Programming, vol. 67, no. 2–3, pp. 162 – 198, 2007. [Online]. Available: http://www.sciencedirect.com/science/article/pii/S0167642307000500 [11] P. Bailis, A. Davidson, A. Fekete, A. Ghodsi, J. M. Hellerstein, and
I. Stoica, “Highly available transactions: Virtues and limitations,” in Proc. of Very Large Data Base Endowment, vol. 7, no. 3, Nov. 2013, pp. 181–192.
[12] “AWS ping traces repository,” https://github.com/pbailis/aws-ping-traces, [Online; retrieved on April 5, 2017].
[13] M. Mishra, A. Das, P. Kulkarni, and A. Sahoo, “Dynamic resource management using virtual machine migrations,” IEEE Communications Magazine, vol. 50, no. 9, 2012.
[14] A. Thakur and M. S. Goraya, “A taxonomic survey on load balancing in cloud,” Journal of Network and Computer Applications, vol. 98, pp. 43 – 57, 2017. [Online]. Available: http://www.sciencedirect.com/science/article/pii/S1084804517302825 [15] A. Singh, M. Korupolu, and D. Mohapatra, “Server-storage
virtualiza-tion: integration and load balancing in data centers,” in Proceedings of the 2008 ACM/IEEE conference on Supercomputing. IEEE Press, 2008, p. 53.
[16] X. Meng, V. Pappas, and L. Zhang, “Improving the scalability of data center networks with traffic-aware virtual machine placement,” in INFOCOM, 2010 Proceedings IEEE. IEEE, 2010, pp. 1–9.
[17] O. Biran, A. Corradi, M. Fanelli, L. Foschini, A. Nus, D. Raz, and E. Silvera, “A stable network-aware vm placement for cloud systems,” in Cluster, Cloud and Grid Computing (CCGrid), 2012 12th IEEE/ACM International Symposium on. IEEE, 2012, pp. 498–506.
[18] S. Hagen and A. Kemper, “Facing the unpredictable: Automated adap-tion of it change plans for unpredictable management domains,” in 2010 International Conference on Network and Service Management, Oct 2010, pp. 33–40.
[19] K. Salah, K. Elbadawi, and R. Boutaba, “An analytical model for estimating cloud resources of elastic services,” Journal of Network and
Systems Management, vol. 24, no. 2, pp. 285–308, Apr 2016. [Online]. Available: https://doi.org/10.1007/s10922-015-9352-x
[20] A. Ponraj, “Optimistic virtual machine placement in cloud data centers using queuing approach,” Future Generation Computer Systems, vol. 93, pp. 338 – 344, 2019. [Online]. Available: http://www.sciencedirect.com/science/article/pii/S0167739X18304692 [21] A. Fatima, N. Javaid, T. Sultana, W. Hussain, M. Bilal, S. Shabbir,
Y. Asim, M. Akbar, and M. Ilahi, “Virtual machine placement via bin packing in cloud data centers,” Electronics, vol. 7, no. 12, 2018. [Online]. Available: http://www.mdpi.com/2079-9292/7/12/389 [22] T. Mahdhi and H. Mezni, “A prediction-Based VM consolidation
approach in IaaS Cloud Data Centers,” Journal of Systems and Software, vol. 146, pp. 263 – 285, 2018. [Online]. Available: http://www.sciencedirect.com/science/article/pii/S0164121218302140 [23] M. A. Kaaouache and S. Bouamama, “An energy-efficient vm placement
method for cloud data centers using a hybrid genetic algorithm,” Journal of Systems and Information Technology, vol. 20, no. 4, pp. 430–445, 2018. [Online]. Available: https://doi.org/10.1108/JSIT-10-2017-0089 [24] F. Alharbi, Y.-C. Tian, M. Tang, W.-Z. Zhang, C. Peng, and
M. Fei, “An ant colony system for energy-efficient dynamic virtual machine placement in data centers,” Expert Systems with Applications, vol. 120, pp. 228 – 238, 2019. [Online]. Available: http://www.sciencedirect.com/science/article/pii/S0957417418307498 [25] C. Qu, R. N. Calheiros, and R. Buyya, “Auto-scaling web
applications in clouds: A taxonomy and survey,” ACM Comput. Surv., vol. 51, no. 4, pp. 73:1–73:33, Jul. 2018. [Online]. Available: http://doi.acm.org/10.1145/3148149
[26] S. Secci, P. Raad, and P. Gallard, “Linking virtual machine mobility to user mobility,” IEEE Transactions on Network and Service Management, vol. 13, no. 4, pp. 927–940, Dec 2016.
[27] L. M. Vaquero, S. S. Lor, D. Audsin, P. Murray, and N. Wainwright, “Sampling ISP Backbone Topologies,” IEEE Communications Letters, vol. 16, no. 2, pp. 272–274, February 2012.
[28] T. Mizrahi and Y. Moses, “On the behavior of network delay in the cloud,” in 2016 IEEE Conference on Computer Communications Workshops (INFOCOM WKSHPS), April 2016, pp. 875–876.