The purpose of this Rapid Communications section is to provide accelerated publication of important new results in the fields regularly covered by Journal of Materials Research. Rapid Communications cannot exceed four printed pages in length, including space allowed for title, figures, tables, references, and an abstract limited to about 100 words.
Anomalous crystallization of hydrogenated amorphous silicon
during fast heating ramps
J. Farjas, J. Serra-Miralles, P. Rouraa)
GRMT, Department of Physics, University of Girona, Campus Montilivi, E17071-Girona, Catalonia, Spain
E. Bertran
FEMAN, Departament de Física Aplicada i Optica, Universitat de Barcelona, E08028-Barcelona, Catalonia, Spain
P. Roca i Cabarrocas
LPICM (UMR 7647 CNRS) Ecole Polytechnique, 91128 Palaiseau Cedex, France (Received 14 July 2004; accepted 28 October 2004)
Thermal crystallization experiments carried out using calorimetry on several a-Si:H materials with different microstructures are reported. The samples were crystallized during heating ramps at constant heating rates up to 100 K/min. Under these conditions, crystallization takes place above 700 °C and progressively deviates from the standard kinetics. In particular, two crystallization processes were detected in conventional a-Si:H, which reveal an enhancement of the crystallization rate. At 100 K/min, such enhancement is consistent with a diminution of the crystallization time by a factor of 7. In contrast, no systematic variation of the resulting grain size was observed. Similar behavior was also detected in polymorphous silicon and silicon nanoparticles, thus showing that it is characteristic of a variety of hydrogenated amorphous silicon materials.
Crystallization of amorphous silicon (a-Si) is a subject that has been studied extensively during the last three decades. It improves the electrical conductivity substan-tially,1
making the resulting polycrystalline silicon useful for a number of applications, such as thin film transistors (TFT), liquid crystal displays (LCD), and image sen-sors.2
The kinetics of this process follows the nucleation and growth steps with rate constants characterized by transmission electron microscopy.3–6The relative values of nucleation and growth rates determine the final grain size that can be controlled through the crystallization temperature or by ion irradiation during crystallization.4 The temperature range in the published results seldom extends above 700 °C because of the difficulty in reach-ing the isothermal conditions without any incipient crys-tallization taking place during the heating ramp. This difficulty is partially overcome by calorimetric experi-ments where the material is heated at a constant rate.
From the heat that evolves the crystallization rate can be obtained. Kinetic studies using calorimetry have only been performed during the epitaxial crystallization of thin a-Si films obtained from rapid solidification.7
With the exception of our preliminary work,8
no systematic studies on hydrogenated a-Si (a-Si:H) have been pub-lished. In this paper we extend the temperature range during the heating ramps above 700 °C up to 100 K/min. Under these conditions, an unexpected and substantial enhancement of the crystallization rate was observed. Besides the intrinsic interest of characterizing a new phe-nomenon, our study can be useful to understand the crys-tallization that occurs during rapid thermal annealing (RTA) processes.1
Three samples have been grown by plasma-enhanced chemical vapor deposition (PECVD). The first one (a-Si:H) is a device-quality material of composition Si1H0.12, grown from a pure silane plasma. The second one (pm-Si:H), with a higher H-content (Si1H0.16), corre-sponds to a new grade of amorphous silicon, called “polymorphous silicon,” obtained from silane diluted in hydrogen to 2%. A number of structural analyses have revealed that polymorphous silicon has a higher degree
a)
Address all correspondence to this author. e-mail: [email protected]
of medium-range order than the conventional amorphous material.9,10Both samples have been deposited onto the walls of the reaction chamber, which was maintained at 250 °C during 10 h. This long deposition time results in thick layers of around 10m. The third sample consists of hydrogenated silicon nanoparticles (np-Si:H). They were grown in a pure silane plasma at room temperature (for details see Ref. 11). The typical particle diameter ranges from 20 to 100 nm. These particles are very re-active with oxygen12 and become partially oxidized when in contact with air at room temperature. Therefore, they are in fact an amorphous suboxide of hydrogenated silicon. By making an elementary analysis, complemented with the mass gain measured after complete oxidation,13 their composition was determined to be Si1H0.45O0.15.
Thermal crystallization was carried out inside the cy-lindrical furnace of a differential thermal analyzer (DTA) at several constant heating rates ranging from 25 to 100 K/min in argon. Small amounts of the sample (<10 mg) were introduced in an alumina pan with a 6-mm diameter. The pan was sustained near the axis of the furnace over a thin platinum disk. A thermocouple measured the temperature at the underside of the disk. Any exothermic reaction results in a slight increment of the measured temperature compared to the programmed one. This difference (the DTA signal) is proportional to the heat power, which can be determined after proper calibration. For this purpose, we measured the melting peaks of highly pure aluminum and silver samples under the experimental conditions. Due to the time response of the apparatus (about 10 s), the crystallization peaks be-come broader and are shifted to higher temperatures. This effect has been corrected by standard procedures in all the results reported in this paper. The peak positions can be established within an error bar narrower than ±2 °C. The reliability of the thermal signal has been tested by repeating the experiment at 100 K/min with a platinum pan. In spite of the differences in heat transport from the sample to the thermocouple, compared with the alumina pan, the crystallization peak was identical. Fi-nally, one additional experiment was done with a con-ventional furnace around 750 °C. The sample was intro-duced inside the furnace where its temperature increased very quickly until an isothermal period was reached. A thermocouple measured the evolution of the pan tem-perature. In this experiment, the heating rate near the isotherm was higher than 200 K/min, and the sample remained at 741 °C for less than 15 s.
In all the experiments, an exothermic peak appears above 700 °C. For the a-Si:H sample, an average en-thalpy of 14.0 J/g was obtained which is slightly higher than the reported values of the crystallization enthalpy7 (11.9 ± 0.7 J/mol). At a lower heating rate of 2.5 K/min, the thermogram measured by differential scanning calorimetry (DSC) gave an enthalpy of 10.9 J/mol. The
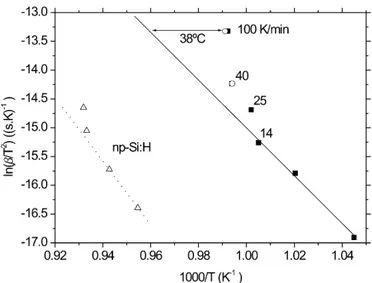
higher value obtained by DTA probably reflects the lower accuracy of this semiquantitative technique. In Fig. 1, several representative DTA thermograms of a-Si:H are plotted. Two features should be noted: (i) although crystallization is a thermally activated proc-ess, the peaks at 40 and 100 K/min appear at similar temperatures and (ii) a low-temperature component be-comes more relevant at higher heating rates. Figure 2 is the conventional Kissinger plot for crystallization at the constant heating rates14of our measurements (symbols). In addition, from the values of the kinetic parameters that are broadly accepted4–6,8 corrresponding to homoge-neous nucleation, the solid line predicts the expected be-havior for a three-dimensional (3D) crystallization proc-ess. Below 25 K/min, the agreement is excellent for a very large range of heating rates (see the whole set of measurements in Ref. 8) that corresponds to a tempera-ture range from 600 to 720 °C. Above 25 K/min, the experimental points clearly deviate from the values expected according to linear extrapolation. At 100 K/min, crystallization should occur at 771 °C (Fig. 1). That is, 38 °C above the experimental peak temperature. In Fig. 2 the results for pm-Si:H and np-Si:H are also included. In both materials the same behavior is clearly observed: as the heating rate increases, the crystallization peak appears at a temperature that is lower than expected. Before discussing the physical origin of this anoma-lous crystallization behavior, let us analyze the result obtained in the experiment carried out with the conven-tional furnace. According to the standard kinetics, after 15 s at 741 °C, the crystalline fraction should be of 2.2%. The actual experimental value was 87%. Therefore, the enhancement of the crystallization rate is confirmed by this independent experiment.
FIG. 1. Thermograms showing the crystallization peaks of the a-Si:H sample at several heating rates. Except the peak at 14 K/min, which was measured by DSC, the peaks have been measured by DTA. The dotted curve corresponds to the crystallization peak calculated with the standard crystallization parameters.
The anomalous behavior, identified in the Kissinger plot of Fig. 2, can be interpreted either in terms of an unexpected enhancement of the nucleation (rn) or of the growth (rg) rates. In Avrami’s elementary crystallization model,8the crystallization time, tc, in the normal regime is given approximately by tc≈ 共rg 3⳯ r n兲 −1Ⲑ4 , (1) where4 rg ⳱ .8 10 13 e−3.1eV/kT (m/s) and rn ⳱ .15 × 1026e−5.3eV/kT(m−3s−1) and T is the peak temperature. In view of Fig. 2 the thermogram at 14 K/min follows the standard kinetics with a peak temperature of 722 °C. For the experiment at 100 K/min the enhanced values of rg and rn can be modeled by the constants A and B, respectively
tc共100 KⲐmin兲 ≈ 共A3r3g ⳯ Brn兲−1Ⲑ4 , (2) where the peak temperature is now 734 °C.
The experimental results in Fig. 1 indicate that the width at half maximum of the 14 K/min peak is similar to that of the high temperature peak of the 100 K/min thermogram (⌬T ⳱ 15 °C). This means that the crystal-lization time at 100 K/min is reduced by a factor of 100/14≈ 7
tc共100 KⲐmin兲 ≈ tc共14 KⲐmin兲Ⲑ7 . (3) Introducing Eqs. (1) and (2) into (3) delivers the fol-lowing relationship
A3B= 268 , (4)
for the enhancement factors. It is possible to know the relative variation of the growth and nucleation rates by looking at the grain size. According to Ref. 5, for a 3D crystallization, the grain diameter is given by
d ≈
冉
rg rn冊
1Ⲑ4
. (5)
In Fig. 3, the grain size at 100 K/min is known to be equal to that obtained at lower heating rates. One con-cludes, then, that A≈ B and, from Eq. (4) one obtains an enhancement factor of 4.0 at 100 K/min.
Most of the experiments so far published reporting crystallization times shorter that expected are concerned with heterogeneous nucleation on surfaces4
or on pre-existing nuclei in bulk.4,15In our case, this explanation must be discarded for two reasons. First, it does not explain why the growth rate increases, too. Second, in contrast with our results, the contribution of heterogeneous nucleation would be more important at low temperature.
Once the kinetics of the anomalous crystallization has been characterized, we will analyze the possible influ-ence that structural relaxation could have on our crystal-lization results. In contrast with crystalcrystal-lization, structural relaxation is a homogeneous structural transformation. FIG. 2. Kissinger plot of the crystallization peaks measured in three
samples ( is the heating rate): (a) conventional a-Si:H (squares), (b) polymorphous silicon (circles), and (c) silicon nanoparticles (tri-angles). The solid line is predicted from the standard kinetics. For Si nanoparticles, the slope increases at high heating rates, too.
FIG. 3. Micrographs of the surface of a-Si:H samples obtained by scanning electron microscopy (SEM) after complete crystallization at (a) 5 and (b) 100 K/min. (The grain structure has been revealed by chemical etching.17)
This means that, as a result of relaxation, no new phase appears, but the amorphous phase evolves continuously towards states of lower energy. If heating is fast, then relaxation could result in local deviations from the mean relaxation rate. Thus, small nanometric regions could have a higher energy than their surroundings and become nuclei that could initiate crystallization more quickly than if the material were more homogeneous. To test this hypothesis, the following experiment was carried out. The a-Si:H sample was previously heated at a mod-erate rate (20 K/min) up to the crystallization threshold (660 °C) and then cooled quickly. In this way, we made sure that the amorphous state was relaxed homoge-neously. This pre-heated sample then crystallized at 100 K/min. The result is shown in Fig. 4 and compared with the crystallization of the as-grown sample. The most apparent difference is the absence of the low-temperature component. Therefore, we can relate this crystallization process with inhomogeneous relaxation. We came to the same conclusion after carrying out isothermal crystalli-zation experiments at 670 °C on the same sample.8 A crystallization peak appeared at shorter times than ex-pected and became more apparent when the isothermal period was reached after high heating rates. The double peak observed in the as-grown sample indicates that the crystal grains formed at lower temperatures do not crys-tallize the whole volume of the sample, but on the con-trary, their growth slows down before complete crystal-lization is achieved. This phenomenon has already been reported in the literature16
for crystallization of a-Ge:H. In accordance with our results, the total heat that evolved was the same (i.e., the crystallization enthalpy) for the double-peak as well as for the single-peak thermograms. Finally, we return to the main crystallization peak. After pre-heating, the sample crystallizes with a single
peak that almost coincides with the high-temperature component of the as-grown sample and is similar to the peak corresponding to the as-grown polymorphous sample (Fig. 4). Therefore, it is difficult to ascribe the enhancement of the crystallization rate of the high tem-perature component to the inhomogeneous relaxation mechanism. Although the standard kinetic parameters used to plot the solid line in Fig. 2 are consistent with experiments done on a variety of materials (hydro-genated LPCVD6 and PECVD8 and dehydrogenated a-Si4,5), very few experiments have tested their validity at T > 700 °C. To our knowledge, only Spinella et al.4 have measured the kinetic parameters above this tem-perature (at 740 and 780 °C), and they agree with the standard kinetics. Our anomalous results at these high temperatures could be due to the differences in sample structure (hydrogenated versus dehydrogenated), on the thermal conditions (constant heating rate versus isother-mal), or on a combination of both. It is well known4that both nucleation and growth rates increase with the con-centration of defects (dangling bonds). During high heat-ing rates, the defect density in hydrogenated materials resulting from thermal dehydrogenation can be anoma-lously high because the time left for their recombination becomes shorter. This effect would be more important during heating than under isothermal conditions.
In conclusion, two anomalous crystallization processes were detected in hydrogenated amorphous silicon, which result in an overall enhancement of the crystallization rate. On one hand, inhomogeneous relaxation of the amorphous network explains the appearance of a low-temperature crystallization process. On the other hand, the enhancement of the crystallization rate could be re-lated to the transient high density of defects that arise from dehydrogenation at the high heating rates of the experiments.
ACKNOWLEDGMENT
This work has been supported by the Spanish Pro-grama Nacional de Materiales under Contract Nos. MAT-2002-04236-C04-01 and -02.
REFERENCES
1. J.F. Pierson, K.S. Kim, J. Jolly, and D. Mencaraglia: Crystalliza-tion of n-doped amorphous silicon PECVD films: Comparison between SPC and RTA methods. J. Non-Cryst. Solids 270, 91 (2000).
2. Technology and Applications of Amorphous Silicon, edited by R.A. Street (Springer, Berlin, Germany, 2000).
3. M.K. Hatalis and D.W. Greve: Large grain polycrystalline silicon by low temperature annealing of low-pressure chemical vapor deposited amorphous silicon films. J. Appl. Phys. 63, 2260 (1998). 4. C. Spinella, S. Lombardo, and F. Priolo: Crystal grain nucleation
in amorphous silicon. J. Appl. Phys. 84, 5383 (1998). FIG. 4. Comparison of the crystallization thermograms of the
as-grown a-Si:H and pm-Si:H samples with that of the pre-treated a-Si:H sample.
5. R.B. Iverson and R. Reif: Recrystallization of amorphized poly-crystalline silicon films on SiO2: Temperature dependence of the
crystallization parameters. J. Appl. Phys. 62, 1675 (1987). 6. Y. Masaki, P.G. LeComber, and A.G. Fitzgerald: Solid phase
crystallization of thin films of Si prepared by plansma enhanced chemical vapour deposition. J. Appl. Phys. 74, 129 (1993). 7. E.P. Donovan, F. Spaepen, D. Turnbull, J.M. Poate, and
D.C. Jacobson: Heat of crystallization and melting point of amor-phous silicon. Appl. Phys. Lett. 42, 698 (1983).
8. J. Farjas, C. Rath, P. Roura, and P. Roca i Cabarrocas: Crystalli-zation kinetics of hydrogenated amorphous silicon thick films by plasma enhanced chemical vapour deposition. Appl. Surf. Sci. 238, 165 (2004).
9. P.M. Voyles and J.R. Abelson: Medium-range order in amorphous silicon measured by fluctuation electron microscopy. Sol. Energy
Mater. Sol. Cells 78, 85 (2003).
10. E. Bertran, S.N. Sharma, G. Viera, J. Costa, P. St’ahel, and P. Roca i Cabarrocas: Effect of the nanoparticles on the structure and crystallization of amorphous silicon thin films produced by RF glow discharge. J. Mater. Res. 13, 2476 (1998).
11. E. Bertran, J. Costa, G. Sardin, J. Campmany, J.L. Andújar, and A. Canillas: Effects of plasma processing on the microstructural properties of Si powders. Plasma Sources Sci. Technol. 3, 348 (1994).
12. D. Das, J. Farjas, P. Roura, G. Viera, and E. Bertran: Enhance-ment of oxidation rate of a-Si nanoparticles during dehydrogena-tion. Appl. Phys. Lett. 79, 3705 (2001).
13. D. Das, J. Farjas, P. Roura, G. Viera, and E. Bertran: Thermal oxi-dation of polymer-like amorphous SixCYHWOz nanoparticles.
Diamond Relat. Mater. 10, 1295 (2001).
14. D.E. Henderson: Thermal-analysis of non-isothermal crystalliza-tion kinetics in glass forming liquids. J. Non-Cryst. Solids 30, 301 (1979).
15. H. Kumomi and T. Yonehara: Transient nucleation and manipu-lation of nucleation sites in solid-state crystallization of a-Si films.
J. Appl. Phys. 75, 2884 (1994).
16. W. Paul, S.J. Jones, and W.A. Turner: Studies on the structure of a-Ge:H using differential scanning calorimetry, gas evolution on heating and TEM. Philos. Mag. B 63, 247 (1991).
17. F. Secco d’Aragona: Dislocation etch for (100) planes in silicon.