TABLE OF CONTENTS
ABSTRACT 3
1. SYNOPSIS 3
2. THE NECESSITY OF GLOBAL BIO-OPTICAL MEASURES 5
3. TOPICS AND OBJECTIVES 7
4. THE INTERNATIONAL CONTEXT 9
4.1 European environmental policy 9
4.2 Ocean observatories initiatives 11
5. DEVELOPMENT AND INNOVATION IN MARINE SCIENCE 18
5.1 State of the art 18
5.2 Design and Application of New Low-Cost Instruments for Marine
Environmental Research 19
5.3 T-FLaP advances: instrumental and operative implementation 36 5.4 A new approach to assess the effects of oil spills on phytoplankton
community during the “Serious Game” experiment (MEDESS-4MS Project) 48
6. WORK IN PROGRESS: REMOTE SENSING APPLICATION 68
7. CONCLUSIONS 73
8. BIBLIOGRAPHY 75
ABSTRACT
Oceans play a fundamental role in the climate balance and change both physically, through heat transport and water masses exchanges, and chemically, interacting in the carbon cycle through the photosynthesis and the biological pump. Knowledge and understanding are the keys to sustainable development and good ocean governance, as required by international organizations and european maritime policy. Everyday new technologies emerges in all marine science sectors to facilitate the understanding of marine life, to promote traditional maritime sectors and to provide solutions to prevent and forecast climate change and marine pollution. Unfortunately there is a structural lack of observational networks for open oceans and coastal seas and a limit to physical domain. The knowledge of the oceans is stringly limited by the observational capacity, consequently the development of new sensors and platforms contributes to the extension of measuring capacity of marine phenomena. My research work shows new low-cost sensors and probes developed to measure marine temperature, conductivity, chlorophyll a and CDOM fluorescences, turbidity, focusing both on sensing strategies, general architecture and laboratory trials and on the different application during several oceanographic surveys in the Mediterranean Sea. These technological solutions were designed for the implementation of oceanographic monitoring networks to contribute to the understanding of physical and biological marine processes.
1. SYNOPSIS
The ocean covers 71% of the Earth's surface, and is linked to human living in many ways. From its role in influencing the climate to how it provides a variety of socio-economical, cultural and environmental benefits, the ocean contributes greatly to human wellbeing.
In a context of growing demand for resources and maritime services, demonstrating the potential of seas and oceans, is critical to turning this potential into an asset with long-lasting economic, social and environmental benefits.
For this reason the EU defined her Integrated Maritime Policy based on these cross-cutting policies: blue growth; marine data and knowledge; maritime spatial planning; integrated maritime surveillance and sea basin strategies.
Identifying seas and oceans as the main drivers for the European economy, the Blue Growth is the long-term strategy to support sustainable progress in the marine and maritime sectors as a whole, achieving the goals of the Europe 2020 strategy for smart, sustainable and inclusive growth.
physically, through the heat transport and through the water masses exchanges, and chemically, interacting in a decisive way in the carbon cycle through the photosynthesis and the 'biological pump'.
For this reason a detailed understanding of ocean climate and ecosystems, as well as human impacts and vulnerabilities, requires the coordination of a continuous and long-term system of ocean observations. Unfortunately there is a structural lack of observational networks for open oceans and coastal seas, the opposite of what yalready exists for atmosphere and terrestrial systems.
For the study and the monitoring of the oceans physical features, low-cost measurement technologies have been developed to measure temperature, currents and partially salinity.
Integrating satellite observations and mathematical models, the new low-cost technologies have allowed the IOC (Intergovernmental Oceanographic Commission) to launch some observational programs in worldwide oceans (GOOS) such as the Global Drifter Program (GDP) and ARGO. With regard to the measures of fundamental biological variables to study the carbon cycle, as the photosynthetic pigments and CDOM, the available tools are still too expensive. This fact inhibits the capability to integrate the long-term global scale observational programs by measuring also biological varibles such as chlorophyll a and CDOM in order to calibrate and integrate satellite measurements and mathematical climate models.
Indeed the knowledge of the oceans is stringly limited by our observational capacity, consequently on the development of new sensors and platforms, which provide multi-disciplinary datasets, advanced sampling strategies and contribute to the expansion of temporal and spatial coverage of our measuring capacity of marine phenomena.
These devices must be able to be used for several applications, ranging from vertical profilers to stand-alone systems, and can be installed on different platforms (buoys, Voluntary Observing Ships, underwater vehicles, etc.). In this way the availability of low-cost biological instruments will enable the implemantation of extended observatory networks for the study of marine physical and biological processes carrying out an important step forward an integrated approach for in situ observations, forecasting models and remotely sensed data.
My research work shows new low-cost sensors and probes developed to measure marine temperature, conductivity, chlorophyll a and Chromophoric Dissolved Organic Matter fluorescence, turbidity, focusing both on sensing strategies, general architecture and laboratory trials and on the different application during several oceanographic surveys in the Mediterranean Sea.
2. THE NECESSITY OF GLOBAL BIO-OPTICAL MEASURES
'Ecological monitoring aims at inferring causes of ecosystem changes, by measuring ecosystem state variables in space and time' (Yoccoz 2012).
In a context of growing demand for marine resources and maritime services the study of ecological and environmental characteristics of marine ecosystems is fundamental to understand and forecast natural and non-natural variations.
Along these lines, the Ecosystem-based Management method proposed by the Marine Strategy Framework Directive (MSFD) (2008/56/EC) requires an integrated approach composed of in situ observations, forecasting models and remotely sensed data for the monitoring and assessment of the environmental status of marine ecosystems. The Marine Strategy Directive constitutes the environmental pillar of the European maritime policy, which puts greater emphasis on the need to collect large amounts of in situ data during observational monitoring programmes for the correct management of marine ecosystems.
A significant amount of effort has been invested studying marine dynamics and processes, and there are different scientific programs focused on measuring physical, chemical and biological variables. But the knowledge of the oceans is stringly limited by our observational capacity (Petersen 2014), consequently on the development of new sensors and platforms, which provide multi-disciplinary datasets, advanced sampling strategies and contribute to the expansion of temporal and spatial coverage of our measuring capacity of marine phenomena.
Marine measurements provide a long story of improvement in instrumentation capacity, and the different technological advances obtained in the course of time have produced new ways to observe and monitor the ocean.
Operational oceanography and remote sensing studies currently represent the biggest part of the ocean sciences that provide high-quality models and observational data for research and practical applications, but critically depends on the near-real-time availability of a large amount of in situ data collected with sufficiently dense spatial and temporal sampling. This issue directly influences the robustness of ocean forecasting models and remote sensing observations through data assimilation and validation processes (Pinardi et al. 2003, 2010).
Like physical models and remote data, ecological once must be developed and validated. Examples of such ecological uses could be the description of the distribution and abundance of the phytoplankton community and the advancement to the study of the ocean carbon cycle and assimilation (Irwin & Finkel 2008). The ocean carbon cycle and ecosystem research relating to climate change are strictly connected to the estimation of phytoplankton biomass and to those
factors which influence the rates of primary production and the export of organic carbon to the deep ocean. In particular, the chromophore-containing components of dissolved organic matter (CDOM) can reduce the photosynthetically active radiation available to phytoplankton, as well as degrade the accuracy of chlorophyll measurements by satellite colour sensors (Carder et al. 1989, 1991) due to their strong absorption of ultraviolet light and the blue region of the light spectrum. In addition the study and the prediction of phytoplankton response to climate changes are fundamental to forecast the potential variation of the capacity of oceans to act as a carbon sink. With regard to phytoplankton biomass distribution, the main investigation tools are both traditional oceanographic methods, which are expensive and spatially and temporally limited, and the ocean-colour satellite observations, which lack information about the deep chlorophyll maximum (DCM).
Chlorophyll a fluorometry remains the principal method to study phytoplankton biomass along the water column and on the marine surface, because together with CDOM is one of the most optically active components of the oceans (Roesler et al. 1989, Babin et al. 2003). However, the high costs of commercially instrumentation have made these measures unavailable for extensive use.
To meet these challenges, in the last decades the use of low-cost instrumentations have gained greater attention (Manzella et al. 2003). The scientific community has made much effort towards modelling marine dynamics, and there are now exhaustive scientific programmes and novel technological developments (e.g. the Argo system and gliders) for monitoring physical variables; however, there remains a lack of biological monitoring programmes and technologies. The existing technologies allow to deploy sensors and probes on many kind of platforms, but are too expensive for extensive utilization.
The Ship Of Opportunity Programme and the Voluntary Observing System represent the most important world initiatives based on low cost technologies. These programmes are based on the possibility to use merchant ships that join to the programme, in routinely strategic shipping routes. The basic instrumentation can be divided in two main branch: the expendable probes and the Ferrybox. Since the 1960s, XBTs (eXpendable BathyThermographs) have been successfully adopted as an easy way to collect temperature profiles using commercial ships. Nowadays the XBT remains the most effective method for low-cost and simple acquisitions of temperature profiles, although the quality of the data must be checked (Reseghetti et al 2006). Despite the extensive use of this kind of sensors to provide data of the physical variables of the oceans, a big gap remains in the estimation of biological ones (e.g., phytoplankton biomass, CDOM). For what concerns the Ferrybox concept it has been developed in partnership with scientists and with companies that operate ferries in Europe. From 2003 to 2005, the European-funded FerryBox project was initiated to further develop the use of the FerryBox systems for automated measurements and water sampling
by ships of opportunity (Petersen 2014) and the core parameters were temperature, salinity, turbidity, and chlorophyll a fluorescence. Non-standard sensors have been additionally tested such as currents, pH, oxygen, nutrients, and algal species. This system has shown a promise in reducing this cost thanks to the use of SOOP or VOS platforms , but the instrumentation is still basically too expensive.
For this reason a significant effort has been undertaken to develop a system that enables both high performance measurements of physical and biological variables and high flexibility despite the low costs of the production compared with traditional instruments, in order to have the possilbility to realize extended observatory networks for the study of marine physical and biological processes.
3. TOPICS AND OBJECTIVES
My research work shows new low-cost sensors and probes developed to measure marine temperature, conductivity, turbidity, chlorophyll a and CDOM fluorescences, focusing both on sensing strategies, general architecture and laboratory trials and on the different application during several oceanographic surveys in the Mediterranean Sea.
The general objectives of this research are to meet the specific measurement requirements and lack that the ocean observing international programs identify like priorities.
Even now the demand of new technologies for the measurement of marine biological variables is one of the problems that scientific community has to face as response to the 2015-2019 general objective of the Global Ocean Observing System (GOOS) Biology & Ecosystem Panel. The only possibility to realize global observational networks is to realize new low-cost technologies, which is one the principal requirements of the last and future EU Horizon 2020 research and innovation framework programme. In addition the development of new technologies to implement low cost coastal observational nets including biological variables is a priority of the Marine Strategy Framework Directive.
In this general context the objective of my research was to realize a technology that could be adapted in different measuring platforms, in different observative systems as identified by GOOS and also in coastal monitoring systems to provide continuous data collection on both physical and biological characteristics of marine environment. Furthermore I tried to identify, test and verify the potential use of the developed technologies in different operating modes, from different measurement platforms and to apply them in specific research projects to contribute to mathematical models data assimilation and remote sensing data validation.
The original technology T-FLaP (Temperature Fluorescence Launchable Probe) was created as an expendable probe (Marcelli et al. 2007; Marcelli et al. 2008) for profiling vertical temperature and chlorophyll a fluorescence from moving ships. Subsequent experimental activities conducted in the last years have led to further improvements, including both an increased sensitivity of the chlorophyll a fluorescence sensor and strucure modularity and the realisation of two new low-cost sensors (conductivity and CDOM fluorescence). These improvements allowed to reach the new applications: the recoverable vertical profiler and the Spectra mini-ferrybox system (Marcelli et al. 2014, Marcelli et al. 2016, Fiori et al 2016).
In this work I present the low-cost technology and its applications through different research papers and works, which contains the development phases, the upgrades, the in situ surveys and the data.
4. THE INTERNATIONAL CONTEXT
A sustainable use of marine environment involves a work on long-term basis directed towards a safe and uncorrupted ocean able to maintain resources and a productive habitat.
In this direction the political priorities of the marine environmental policy are based on the main principles of the prevention, the precautionary and of the sustainable management.
The marine environmental policy is principally driven by international agreements, particularly at the level of the European Union, which guarantees a constant in the functioning of the Marine Environment service.
4.1 European environmental policy
The main pillar of the last ten years within the international policy context is represented by the Marine Strategy Framework Directive (MSFD, Directive 2008/56/EC), (Tunesi et al. 2013). The main objective of the MSFD is to achieve or maintain the Good Environmental Status (GES) in the marine environment by the year 2020. The GES is the core of the MSFD and is defined as: “The environmental status of marine waters where these provide ecologically diverse and dynamic oceans and seas which are clean, healthy and productive” Article 3. The GES is achieved using 11 descriptors and using a number of criteria and indicators associated to each descriptor.
In the last decades awareness has raised that “pressure on natural marine resources and the demand for marine ecological services are often too high and that the European Community needs to reduce its impact on marine waters regardless of where their effects occur”. On the other hand, “The marine environment is a precious heritage that must be protected, preserved and, where practicable, restored with the ultimate aim of maintaining biodiversity and providing diverse and dynamic oceans and seas which are clean, healthy and productive” (EC, 2013). To meet these needs, the European Parliament and the Council of the European Union, on 17th June 2008, enacted the Marine Strategy Framework Directive 2008/56/EC (MSFD); Italy, as due by all Member States, transposed it in its national legislation through the Legislative Decree n. 190 of 13th October 2010. The Directive promotes the integration of environmental considerations into all relevant policy areas and constitutes the environmental pillar of the future Integrated Maritime Policy (IMP) for the European Union (Casazza et al., 2007; Tunesi et al., 2008). The Directive applies to all marine waters, seabed and subsoil of areas where Member States have and/or exercise jurisdictional rights, which entail an integral part of different marine regions and subregions.
environmental policy, including monitoring procedures and methods for data collection. The assessment or the achievement of GES cannot exclude the analysis of ecosystems characteristics, pressures and impacts providing elements for assessing ecological status and the assessment of environmental targets achievement. To do this a medium- or long-term observation system must be implemented to track factors involved in observed changes and to provide long-time series on functioning of complex ecosystems.
Together with the MSFD the European Commission seeks to provide a more coherent approach to maritime issues, with increased coordination between different policy areas, focusing on different issues which do not fall directly under a single sector-based policy. In particular they developed and adopted the Blue Growth which is the long-term strategy to support sustainable growth in the marine and maritime sectors. In a context of growing demand for resources and maritime services including transport, sustainably capturing and demonstrating the potential of seas and oceans is critical to turning this potential into an asset with long-lasting economic, social and environmental benefits for Europe. Targeted innovation in our seas and oceans and an optimal use of research infrastructures available can play a key role in tackling global challenges such as the scarcity and vulnerability of strategic resources, while providing valuable ecosystem services factoring in climate change. However, a risky environment, insufficient knowledge, data, data access are critical barriers to overcome. It is important that European Commision intervenes to create the conditions for mobilising investment in testing and demonstration projects for new technologies, bringing them ‘from lab to market' and avoiding the costly duplication of work. Within Horizon 2020 a focus area is dedicated to the Blue Growth work programme which is pointed to bring technologies to the readiness level needed for commercial applications and to improve current European marine observing, surveyin and monitoring capabilities in order to increase the knowledge of marine environment processes and its interaction with human activities. One the main objective of the Blue Growth strategy is valorising the Mediterranean Sea Basin: the objective is to deepen knowledge on the Mediterranean marine ecosystems and their services and to strengthen the European ocean observing, surveying and monitoring capabilities and related technologies necessary for accelerating the production of high-resolution maps and assessments. The Mediterranean environment is rapidly changing to the natural and non-natural pressures so that it is difficult to establish a suitable situation provide the progress of a blue economy.
In this context many organizations and institutions coordinates observations around the global ocean to support the research and the objectives suggested by the international policy.
From the origin of the climate studies, oceanographic measures has been acquired by ships, the only available platforms to survey the oceans. Although there are now several other platforms (i.e. satellites, drifting buoys, floatings and radar) ships still play a very important role providing sea truth for the calibration of satellite observations and because of they allow measurements not yet obtainable by other means, such as air temperature and dew point (www.bom.gov.au/jcomm/vos/). The World Meteorological Organization (WMO) within Intergovernmental Oceanographic Commission (IOC) of UNESCO, the United Nations Environment Program (UNEP), and the International Council for Science (ICSU) sponsor the Global Ocean Observing System (GOOS) that is the oceanographic component of GEOSS, the Global Earth Observing System of Systems. WMO members directly participate in the GOOS, providing in situ and satellite observations. Since 1999, the marine activities of WMO, as well as those of IOC, have been coordinated by the Joint Technical Commission for Oceanography and Marine Meteorology (JCOMM - www.jcomm.info). The creation of this Joint Technical Commission results from a general recognition that worldwide improvements in coordination and efficiency may be achieved by combining the expertise and technological capabilities of WMO and IOC. The Observations Program Area of JCOMM is primarily responsible for the development, coordination and maintenance of moored buoy, drifting buoy, ship-based and space-based observational networks and related telecommunications facilities. In this framework it was created a Ship Observations Team (SOT) which coordinates two programs: the Voluntary Observing Ship Scheme (VOS) and the Ship of Opportunity Program (SOOP).
4.2 Ocean observatories initiatives
VOS (Voluntary Observing Ships) and SOOP (Ship Of Opportunity Program)
The World Meteorological Organization (WMO) Voluntary Observing Ships' (VOS) scheme is based on ships, which are recruited by National Meteorological Services (NMSs) and ply the various oceans and seas of the world for taking and transmitting meteorological observations. The SOOP is based on the possibility to use merchant ships that join to the programme, in routinely strategic shipping routes for taking oceanographical and hydrological data. The basic instruments used in these programs are the Expendable Bathythermographs (XBTs) and the Ferrybox. At predetermined sampling intervals, Expendable Bathythermographs (XBTs) are launched to acquire temperature profiles in the open ocean in order to be assimilated into operational ocean models. SOOP plays a relevant role as it serves as a platform for other observational programmes, communicating closely with the scientific community. In this way, SOOP assumes a big relevance to seasonal an interannual climate prediction. The programme is managed by the SOOP
Implementation Panel (SOOPIP). Along the strategic shipping routes, SOOPIP identifies and coordinates the measuring necessities in terms of type of instruments, their use modality and deployment. So, thanks to the use of different instruments, it is possible to obtain long measuring series of physical, chemical and biological parameters. Moreover SOOP looks at new instrumental technological development and coordinates the exchange of technical information; in particular: functionality, reliability and accuracy, and recommended practices about relevant oceanographic equipment and expendables.
The main important aspect of VOS and SOOP programs deals with the possibility of collect data in a cost effective way.
Within these programs (VOS and SOOP), many international initiatives are presently carried out in order to develop new observing devices and systems, suitable to be utilized from as many vessels as possible. New expendable probes and devices (low cost and user friendly) represent the ultimate effort of oceanographic technological development in order to collect even more accurate measurements and to enhance the range of variables to be measured in automatic way, particularly for the biological ones.
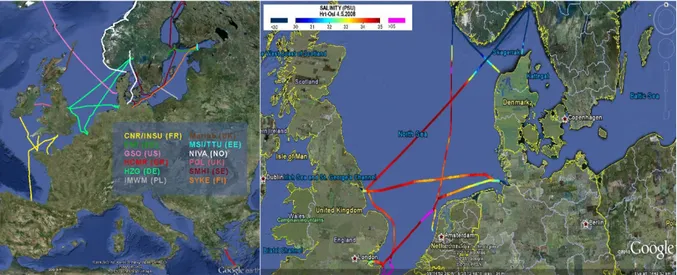
Fig. 1 On the left an example of Ferrybox routes; on the right a map for seasurface salinity obtained by Ferrybox data
The Global Ocean Observing System (GOOS - http://www.goosocean.org)
One of the main problem is that the information needed by administrations, governments, industry, science and the public to deal with marine related issues, including the effects of the ocean upon climate, needs to be supported by a unified global network that systematically acquires, integrates and distributes oceanic observations, and generates analyses, forecasts and useful products.
the United Nations Conference on Environment and Development (Rio de Janeiro, 1992), the Intergovernmental Oceanographic Commission (IOC) created the Global Ocean Observing System (GOOS) in March 1991 (Dexter et al. 2010). GOOS (www.ioc-goos.org) was designed to provide observations of the global ocean, related analysis and modelling, supporting operational oceanography and climate change predictions. Through Regional Alliances and dedicated linked programmes, GOOS allows all data to become accessible to the public and researchers by standard and simple shared methods to produce products useful to a wide range of users. In this way GOOS should sustain the management of marine and coastal ecosystems and resources, supporting human activities like mitigate damage from natural hazards and pollution, protect life and property on coasts and at sea and suggest scientific research activities.
GOOS is:
- a sustained, coordinated international system for gathering data about the oceans and seas;
- a system for processing data to enable the generation of beneficial analytical and prognostic environmental information services;
- the research and development on which such services depend for their improvement. The GOOS id divided in two main branches: the open ocean and the coastal one. The open ocean component of the GOOS is designed to:
- monitor, describe and understand the physical and biogeochemical processes that determine ocean circulation and its effects on the carbon cycle and climate variability;
- provide the information needed for ocean and climate prediction, including marine forecasting; - provide observational requirements;
- ensure that the designs and implementation schedules are consistent and mutually supportive and working as planned; and
- ensure that the system benefits from research and technical advances. Coastal GOOS has six goals for the public good. These are to:
- improve the capacity to detect and predict the effects of global climate change on coastal ecosystems;
- improve the safety and efficiency of marine operations;
- control and mitigate the effects of natural hazards more effectively; - reduce public health risks;
- protect and restore healthy ecosystems more effectively; and - restore and sustain living marine resources more effectively.
The main difficulty of the present observing system is the lack of global coverage, the need for autonomous and remote instruments for the whole variables list, the need for expanded and more
effective data and product systems, and the need for long-term continuity of national efforts along with international coordination. For this reason a continued research is needed to improve and develop observing capabilities for some variables and to make systems more robust and cost-effective.
Examples of phenomena of interest from the coastal ocean (Dexter et al. 2010)
Sea state Forces
on structures Coastal flooding Currents Sea level
Shoreline change Seabed topography change Chemical contamination of seafood Human pathogens in water and shellfish Habitat modification and loss Eutrophication, oxygen depletion Change in species diversity Biological response to pollution Harmful algal
bloom events Invasive species
Water clarity
Disease and mass mortality in marine organisms Chemical contamination of the environment Harvest of capture fisheries or of aquaculture Abundance of exploitable living marine resources
Mediterranean Operational Network for the Global Ocean Observing System (MonGOOS - http://www.mongoos.eu)
The Mediterranean Operational Network for the Global Ocean Observing System has been established in 2012 to further develop operational oceanography in the Mediterranean Sea. MONGOOS shall engage in activities related to the production and use of operational oceanography services in furtherance of four principal objectives:
- Improved Fitness for Purpos: continuously advance the scientific understanding and technological development upon which the Services are based.
- Greater Awareness: promote the visibility and recognition of the Services with governmental agencies and private companies, encourage their integration at national, regional, European and global levels.
- Increased Downstreaming: enhance the usability of the Services and their usefulness for policy implementation, societal needs and science.
operational oceanography and promote the participation of non-EU Mediterranean countries in producing the Services.
One the main activity is to contribute to the international planning and implementation of the Global Ocean Observing System and to coordinate and harmonize the development of a sustainable Integrated Observing System at the basin and shelf/coastal scales.
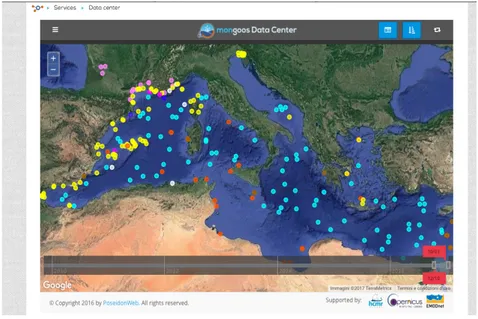
Fig. 2 MonGOOS data center
European Programme for the establishment of a European capacity for Earth Observation (Copernicus - http://www.copernicus.eu)
Copernicus consists of a complex set of systems which collect data from multiple sources: earth observation satellites and in situ sensors such as ground stations, airborne and sea-borne sensors. It processes these data and provides users with reliable and up-to-date information through a set of services related to environmental and security issues.
Copernicus, previously known as GMES (Global Monitoring for Environment and Security), is the European Programme for the establishment of a European capacity for Earth Observation. The services address six thematic areas: land, marine, atmosphere, climate change, emergency management and security. They support a wide range of applications, including environment protection, management of urban areas, regional and local planning, agriculture, forestry, fisheries, health, transport, climate change, sustainable development, civil protection and tourism.
In situ data means observation data from ground-, sea-, or air-borne sensors as well as reference and ancillary data licensed or provided for use in Copernicus. The Copernicus services and the space component need sustainable and reliable access to in situ data to produce, validate, and calibrate
products, and to establish reliable information services required by end users. For this reason the Copernicus in situ component is implemented in different tiers, with particular attention to the marine environment monitoring services, which provides regular and systematic information on the physical state, variability and dynamics of the ocean and marine ecosystems for the global ocean and the European regional seas. The service also contributes to the protection and the sustainable management of living marine resources in particular for aquaculture, fishery research or regional fishery organisations. The continuous acquisition of physical and marine biogeochemical components is necessary for water quality monitoring and pollution control, for exampel the sea surface temperature is one of the primary physical impacts of climate change and has direct consequences on marine ecosystems. As a result of this, the service supports a wide range of coastal and marine environment applications.
European Marine Observation and Data Network (EMODnet - http://www.emodnet.eu)
The European Marine Observation and Data Network (EMODnet) consists of more than 160 organisations assembling marine data, products and metadata to make these fragmented resources more available to public and private users relying on quality-assured, standardised and harmonised marine data which are interoperable and free of restrictions on use. EMODnet is currently in its second development phase with the target to be fully deployed by 2020.
The main purpose of EMODnet is to unlock fragmented and hidden marine data resources and to make these available to individuals and organisations, and to facilitate investment in sustainable coastal and offshore activities through improved access to quality-assured, standardised and harmonised marine data. In particular EMODnet Biology contributes to the knowledge about abundance and diversity of life, from large species to the microscopic marine algae that form the base of the marine food chain. So the data portal allows users to search for datasets by theme such as biomass and pigments.
Citizen Observatories (CO)
As Liu (2014) defined a CO is: “the citizens’ own observations and understanding of environmentally related issues and in particular as reporting and commenting on them within a dedicated ICT platform”.
Citizen observatories aim to involve people into a collective monitoring of the territory, thus contributing to a better appropriation of the territory by users and a better understanding of issues affecting it.
In particular the CO promotes communication and supports the sharing of technological solutions (e.g., sensor and sensor platforms, mobile apps, web portals) and community participatory governance methods (e.g., aided by various social media streams) among citizens. This definition shows three core components that underpin some of its objectives, i.e., raising the citizens’ environmental awareness; enabling dialogue among citizens, scientists and policy- and decision-makers; and supporting data exchange among citizens, scientists and other stakeholders. It also promotes a more active role for the community concerning understanding the environment, since citizens are traditionally considered as consumers of information services at the very end of the information chain and not as data providers.
Numerous examples of citizen observatories have been reported in the last years, while I will report some of the most significant in the Mediterranean basin. One is the Jellyfish Spotting platform, which was created within the framework of the PERSEUS Jellyfish Spotting campaign. It aims at improving knowledge about jellyfish distribution patterns by integrating observations from all users. This platform is opened to everybody and anybody can contribute by reporting a sighting. The other one is the MedObs-Sub observatory, which aims to initiate a citizen dynamic by giving stakeholders a key role in monitoring and by raising awareness about environmental issues related to coastal uses. Any diver or fisherman (fishing from the shore, from a boat or spearfishing) can become a watchman and report sightings about: underwater landscapes, alien species, pollutions, biological diversity and uses.
5. DEVELOPMENT AND INNOVATION IN MARINE SCIENCE
One of the most relevant issue in marine sciences concerns the data availability, quality and accessibility. The employment of traditional methods limits data collection because of the high costs of surveys, fixed installations and instruments. Remote sensing only partially meets these difficulties such as it provides information only of the marine surface layer and lacks an adequate spatial and temporal resolution to study coastal seas, and in turn needs to be calibrated and validated by in situ data.
As already described, within the international projects knowledge necessities, it is fundamental the development of innovative technologies according to requirements of high performances, data quality and low-cost. Even if data provided by models, by high resolution remote sensing and by the new autonomous sampling platforms are increasing temporal and spatial sampling capabilities (Dickey & Bidigare, 2005), however, there is still a lack of operational, multidisciplinary, in situ observing systems. This fact is particularly related to the biological variables that need to be observed in situ more than the physical once. Especially in the mid-high latitudes, a complete upper layer observation of the water column is needed, because of the typical distribution of phytoplanktonic biomass (Mann &Lazier, 1991).
Traditional methods (water sampling, storage and laboratory analysis) are too expensive and do not allow to have enough measures to describe variability of marine natural phenomena with sufficient temporal and spatial detail. Therefore, bio-optical measures, used to study the main environmental characteristics, such as phytoplankton biomass, CDOM (Coloured Dissolved Organic matter), turbidity, can be integrated in new technological developments to give continuous measures. In such a context our aim was to answer to all the above issues, developing new user friendly technologies, based on low cost materials and suitable to different configurations (Moored, stand alone, expendable, continuous and towed). In order to face the necessity of the world oceanographic observations, and of the coastal marine observatories, we identified the main development necessities: low cost flexible modular instrument, to be used like profiler, expendable, stand alone and instrumental payload to be integrated in other platforms.
5.1 State of the art
This paragraph points out the state of the art relevant to my contribution and to the specific developments topics, as evidenced by the articles shown below.
Expendable probes
Expendable probes (such as XBT – eXpendable BathyThermograph), represent an approach to ocean measurements in which the high accuracy of measurements may be sacrificed considering lower costs and operational expediency (Thorpe, 2009). Relating to operational oceanography, this kind of technology derives from the needs of adequate spatial sampling on timescales commensurate with temporal variability. These probes can provide measures of temperature quickly as they can be used by a ship moving up to 20-30 knots. This technique also provides standard results and it became the central component of programmes such as the Global Ocean Observing System (GOOS). Current expendable probe capabilities include also the measurements of sound speed, conductivity, ocean current and (most recently) optical irradiance (Thorpe, 2009). Such expendable measurements could be fundamental for satellite data calibrations and for programmes such as Marine Forecasting System (MFS). Despite the development and extensive use of this kind of sensors to provide near real-time analysis of the principal physical variables, gaps remain in the estimation of certain biological variables (e.g., phytoplankton biomass, Chromophoric Dissolved Organic Matter), which instead play a key role, particularly at mid-low latitudes, in the ocean carbon cycle and ecosystem research relating to climate change.
Multiparameter Profilers
One of the most useful instruments developed for determining seawater properties during the last four decades has been the CTD (conductivity, temperature, depth) (Thorpe 2009). This device has supplanted the traditional hydrocast using Nansen and Niskin bottles and reversing thermometers that was standard physical oceanographic practice from about 1910 to 1970. The computations of properties such as depth, salinity, density, speed of sound, and potential temperature have been greatly facilitated by having the measurements of conductivity, temperature, and pressure in digital format for direct entry into standard formulas. However nowadays the term CTD is often used to describe a package that includes the actual CTD as well as auxiliary sensors to measure other parameters, such as dissolved oxygen, pH, turbidity, fluorescence of pigments.
Traditionally a profiling CTD measures water parameters as it travels through the water, whether lowered over the side of a ship with a winch to take measurements of a vertical column of water, but it can be also integrated with an autonomous vehicle or glider, or in a fixed station.
Today a wide variety of probes are available for sale, but normally these sensors are fabricated using costly components. Current commercially available CTD instruments range in cost from 2000s to 10000s dollars depending on the application, the accuracy and the manufacturer. Instruments that are packaged for deep deployments (1000 + m) are costlier than others due to the
housings used, where as the average cost of a coastal water system is 5500 dollars (Broadbent et al. 2007). The costs become higher when the user wants to integrate other sensors to measure chemical and biological variables.
For this reason a multiparameter probe produced with low cost components and which provides accurate, precise and highly resolved measurements comparable to those obtained using commercially available instruments.
FerryBox
Until recently a serious hindrance to understanding and forecasting the state of marine systems has been the lack of monitoring systems that provide on-line data, and observations with sufficient spatial coverage and temporal resolution to give a true view state and change. To overcome this hindrance developments have been pursued in measurement technologies, data logging and ship-shore communications. It is now possible for scientists and governmental (environmental) agencies to work with merchant shipping companies to collect this much needed data autonomously in a cost effective manner (Hydes 2010). FerryBox (http://www.ferrrybox.org) is about a partnership between scientists and the companies operating the large numbers of ferries around the world - 800 in European seas. The name signifies (1) the use of a ferry (or other commercial ship), (2) boxes of autonomous equipment (3) the ability of data collected on regular route not only to provide much needed time series data but also boundary conditions for numerical models boxing in an area of sea or ocean. The coastal carbon system needs to be better monitored in respect to the overall carbon cycle issues and natural carbon sequestration processes. The FerryBox approach is probably the only way that can provide the needed monitoring coverage of carbon import and export in shelf seas and acidification in the coastal zone cost effectively.
5.2 Design and Application of New Low-Cost Instruments for Marine Environmental Research
Adapted from:
Marcelli M., Piermattei V., Madonia A., & Mainardi U. (2014). Design and application of new low-cost instruments for marine environmental research. Sensors, 14(12), 23348-23364.
Introduction
Marine ecosystem monitoring is nowadays a main concern in the worldwide scientific community (Albaladejo et al. 2012). A significant amount of effort has been invested modelling marine dynamics and processes, and there are exhaustive scientific programs and technological developments, e.g., Argo floats (Roemmich et al. 2009) and Expendable BathyThermograph (XBTs) probes (Hannon 2000), to measure physical and biological variables. Ocean sciences are strictly dependent on the development of new sensors and platforms, providing multi-disciplinary datasets, advanced sampling strategies and the expansion of temporal and spatial coverage of our measuring capacity of natural phenomena. Ocean measurement provides a long story of improvement in instrumentation capacity, from the accuracy, precision and resolution, until quality control and precision manufacture (Steele et al. 2009). Technological advances in oceanographic measurement capabilities have produced new ways to observe and monitor the ocean that improve operational and forecasting oceanography. Operational oceanography currently represents a part of the ocean sciences that provides high-quality observational data and models for research and practical applications (Pinardi et al. 2003, Pinardi et al. 2010), but critically depends on the near-real-time availability of a large amount of in situ data collected with sufficiently dense spatial and temporal sampling. This issue directly influences the robustness of ocean forecasting models and remote sensing observations through data assimilation and validation processes. Extended observatory networks represent an important new field in the study of global phenomena, through the development of cheap, small and integrated smart sensors (Johnstone et al. 2008).
Along these lines, the use of low-cost instrumentation from ships of opportunity, promoted by international research programs, is gaining more and more attention. This instrumentation makes it possible to reduce the costs of oceanographic surveys and, at the same time, to improve data spatial density and coverage and collect relevant data about studied phenomena (Trevathan et al. 2012). Furthermore, the new emerging Ecosystem-based Management method proposed by the Marine Strategy Framework Directive (MSFD) (2008/56/EC) (European Commission 2008) requires an integrated approach composed of in situ observations, forecasting models and remotely sensed data for the monitoring and assessment of the environmental status of marine ecosystems. Although the existing technology allows to deploy sensors and probes on buoys, mooring and many other kind of platforms (Kröger et al 2009) the MSFD objectives cannot be achieved with current marine measurement technologies, which are too expensive for extensive utilization.
The Ship Of Opportunity Programme and the Voluntary Observing System represent the most important world initiatives that largely rely on (XBTs) (Manzella et al. 2003, Goni et al. 2009).
Since the 1960s, XBTs have been successfully adopted by oceanographers as an easy way to collect temperature profiles using commercial ships. Even now, XBT remains the most effective method for low-cost and simple acquisitions of temperature profiles, although the quality of these data must be checked (Reseghetti et al. 2006). Despite the development and extensive use of this kind of sensors to provide near real-time analysis of the ocean temperature, gaps remain in the estimation of certain biological variables (e.g., phytoplankton biomass, Chromophoric Dissolved Organic Matter). Observation and study of the distribution of biological variables plays a key role, particularly at mid-low latitudes, where a deep observation of the water column is needed because of the typical distribution of phytoplankton biomass (Mann and Lazier 1991). chlorophyll a (Chla) fluorometry is the principal method to study phytoplankton biomass in the ocean. However, the high costs of commercially instrumentation have made it unavailable for extensive use (Leeuw et al 2013). Dissolved organic matter (DOM) in the oceans is one of the largest reserves of reactive organic carbon on Earth (Hedges et al. 1992) controlling the concentration of CO2 in the atmosphere and affecting global climate change (Hedges et al. 2002). CDOM, also known as gelbstoff or yellow substance, is that component of DOM that absorbs light over a broad range of visible and UV wavelenghts, having a strong impact on the availability and spectral quality of light in photosynthesis (Kirk 1983). The emission fluorescence of CDOM covers a wide spectral range at blue-green wavelengths, allowing to estimate its concentration in natural waters. Furthermore, together with phytoplankton, CDOM is one of the most optically active components of the oceans (Roesler et al. 1989, Babin et al. 2003), representing a key parameter in primary production estimates with bio-optical models. A significant effort has been undertaken recently to develop a system that enables both high-performance measurements of physical and biological variables and high flexibility and low costs of the production compared with traditional instruments. Our aim was to realize a technology that could be adapted for use in different monitoring systems to provide continuous data collection (Glasgow et al. 2004).
In this paper, we present a new low-cost system for marine temperature, conductivity, Chla and CDOM measurement developed by the University of Tuscia Laboratory of Experimental Oceanology and Marine Ecology, the last upgrades and in situ tests.
Low-cost Technology
With the aim of adding biological profiling measurements to the physical measurements performed by commercial XBTs, in 2003 Temperature-Fluorescence Launchable Probe (T-FLaP) technology was developed and the first 30 prototypes were tested in the frame of the Mediterranean Forecasting
System: Toward Environmental Prediction (MFS-TEP) project (Pinardi et al. 2003, Manzella et al. 2003, Marcelli et al.2010). T-FLaP is an expendable fluorometer designed to obtain vertical temperature and fluorescence of Chla profiles along the water column by moving ships. The probes provided real-time temperature and Chla fluorescence profiles up to a depth of 500 m with an accuracy of 0.1 °C and 0.1 mg/m3, respectively.
T-FLaP technology has recently been refined and improved. The new advances can be summarized in the following points:
replacement of Chla fluorescence and temperature sensors with more sensitive devices (temperature accuracy: 0.01 °C; Chla accuracy: 0.01 mg/m3);
integration of a miniature 500 dBar pressure transducer, of a triaxial accelerometer and a gyroscope (optional) for the study of the dynamic behavior of the probes following the release; development of new sensors for the measurement of conductivity and CDOM fluorescence; improvement of miniaturized electronic devices;
realization of a modular measuring cell;
reduction of light-reflection phenomena inside the measuring cell by means of an anodic oxidation treatment with a matte black covering on the mechanical components.
Thanks to these innovations, it has been possible to improve the expendable probe and develop two additional new applications usable and adaptable to different scientific and operational needs: the recoverable vertical profiler T-FLaPpro, for use as a CTD (Conductivity Temperature Depth) probe from research vessels, and the stand-alone system Spectra, working as a mini-ferrybox for surface mapping of the bio-physical properties of seawater.
Main Goals
Ease of use, low cost and modularity are the basic principles of this technology, which is ideal for
deployment from voluntary boats, even by non-specialized operators. A significant effort was dedicated to the selection of low-cost components, in order to realize a technology that could be implemented in extended monitoring systems. Despite the low-cost philosophy, all of the sensors were made with the aim of identifying, with good accuracy, the physical structures and biological phenomena of the oceans (thermocline, pycnocline, Deep Chlorophyll Maximum (DCM), etc.). The
modularity of the measuring cell allows us to combine the sensors depending on specific needs: the
system has been designed to be flexible and customizable enough to address heterogeneous operative demands and oceanographic platform installation. Furthermore, much effort has been expended to ensure the miniaturization of electronic components and a reduction in packaging,
which allows us to increase the internal volume available for the inclusion of new features in the future.
General Architecture
The new expendable, vertical profiler and stand-alone instruments present different external cases with technical characteristics adapted to their operative use (submersible, waterproof, expendable etc.). Nevertheless, they share a standard internal measuring cell (Fig. 3a–c).
The measuring cell is a flow-through tubular cell where the water flows. As discussed above, the measuring cell has a modular structure. The modules are aluminium cubes 40 × 40 × 40 cm, placed in sequence and perforated to allow the water to flow. The design of the measuring cell has been studied in order to ensure that the sensors are in direct contact with the volume of water passing through the probe.
Fig. 3 a) Possible combinations of the sensors inside the measurement cell. b) Modules of the measurement cells. c) A prototype of the measurement cell.
Each of the modules can accommodate up to three cylindrical, interchangeable supports containing all of the possible elements for physical and biological sensing. Each probe can house the following configurations:
temperature sensor; pressure sensor;
excitation/detection devices of Chla fluorometer; excitation/detection devices of CDOM fluorometer.
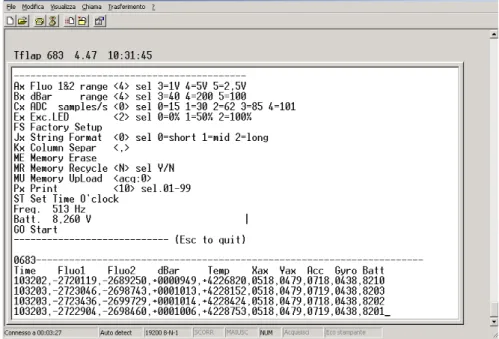
The probes can be easily taken out of the cell to facilitate optics cleaning or replacement operations in the case of biofouling. All of the mechanical components are completely anodized and covered with a matte black deposit to reduce scattered light emitted within the cell. Batteries and electronic boards are placed on the external part of the measuring cell. A specific battery package makes the instrument totally autonomous, depending on the operative time required for each application. The electronic boards are placed around the measuring cell, allowing for the management of the power supply and the modulation of light sources, and the control of the the sensor signal, the signal conditioning, the digital conversion functions and the data transmission. The firmware of the instrument allows it to communicate in real time with a user through a remote terminal, in order to switch on and configure the instrument with the best measurement conditions. In particular, the program makes it possible to set and control a series of configurations and information, including the operative ranges of the parameters, LED excitation, battery and memory status. An example of the terminal screen before and during acquisition is illustrated in Figure 4.
Fig. 4 Terminal screen showing the different instruments and sensor configurations and controls.
Sensors
Temperature and Pressure Sensors
The temperature microsensor consists of a sensitive bulb (1.5 mm in diameter), located on the top of a quartz stem 10 mm in length. The sensitive part is a thermistor inserted into the glass bulb. Given its minimum dimensions, this sensor has the sensitivity to detect temperature variations of 0.01 °C
with a response time of 0.05 ms (Marcelli et al. 2007). Depth is measured through a submersible pressure transducer (KELLER AG für Druckmesstechnik).
Chlorophyll a Fluorometer
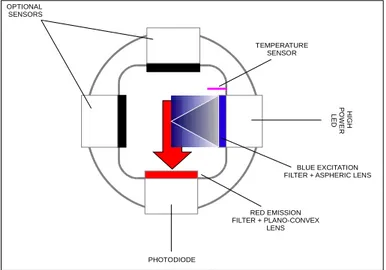
The Chla fluorometer is composed of an emitter and a detector positioned orthogonally to each other, in order to reduce the amount of excitation light scattered to the detector (Figure 5). The emission module is equipped with a blue high-power LED light source (430–470 nm), an optical short-pass filter and an aspheric lens. Blue light excites Chla pigments of phytoplankton cells passing through the measuring cell. The detection module, composed of a red optical band-pass filter, a plano-convex lens and a silicone photodiode, receives the fluorescent signal produced by the excited cells, and selects, focuses and amplifies the red peak between 682 and 685 nm, as shown in Figure 6. The insertion in the emission/detection modules of optical windows with high transmission to incident radiation constitutes a useful tool for the maintenance of the sensors, particularly for making sure that the optics of the instrument do not become biofouled.
H IG H P O W E R LE D PHOTODIODE RED EMISSION FILTER + PLANO-CONVEX LENS BLUE EXCITATION FILTER + ASPHERIC LENS OPTIONAL
SENSORS
TEMPERATURE SENSOR
Fig. 5 The new fluorimetric cell
obtained by Ocean Optics QE65000 spectrometer.
CDOM Fluorometer
The CDOM fluorometer has the same structure as the Chla fluorometer, with orthogonal emission and detection modules, except for using LED and optical filter wavelengths. The excitation source produces ultraviolet radiation (370 nm) and the receiving device selects the CDOM fluorescent signal (400–500 nm), transmitting it to the photosensitive element, as shown in Figure 7.
Fig. 7 Transmission spectra of CDOM optical filters in the excitation (violet curve) and detection (blue curve) modules obtained by Ocean Optics QE65000 spectrometer.
Conductivity Sensor
The conductivity sensor consists of a specific cylindrical module containing four platinum rings placed on the flow line. The outer rings generate an electric current and the inner rings measure the potential difference that is determined by the induced current. Using an electronic control circuit, the potential difference is kept constant in time. The current generated by the outer rings is controlled and measured by the electric circuit of the reaction in such a way that it increases and decreases proportionally, depending on variations in the conductivity.
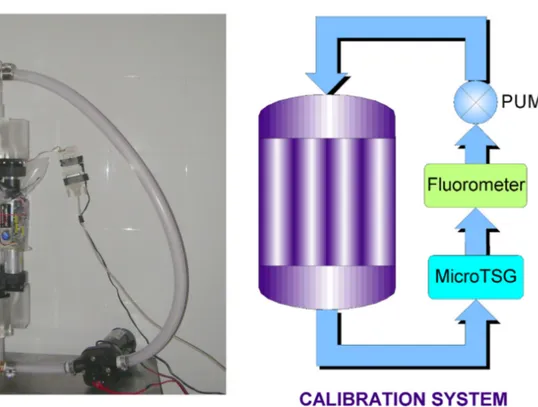
Calibration System
The calibration procedure is a very important step in the development of new technologies. In order to convert the electrical outputs of each sensor to physical values, we designed and realized an automatic calibration system that allows us to calibrate the instruments in the laboratory, before their use. The calibration system is a closed hydraulic circuit composed of a calibration chamber that can house eight probes at a time, a circulation heat exchanger, a pump for the water flow and the control sensors (Figure 8).
The calibration chamber has a modular construction including a manifold, flow distributors and pipelines. All components were realized by subjecting two plexiglass bocks to laser manufacturing to produce the smoothest possible finish and to ensure flow uniformity and a minimum loss of pressure. The manifold was produced to simultaneously distribute both water and pressure inside the system.
Fig. 8 The calibration system
Above the upper manifold, a Millipore two-way vacuum valve makes it possible to inject the specific standard solutions for the calibration of the Chla and CDOM fluorometers (phytoplankton cultures or Quinine Sulphate dissolved in H2SO4 0.05 M solutions) into the system (Coble 1996). The water flow is regulated by a high-capacity, low-velocity pump located adjacent to the control sensors. The outflow pump goes through the temperature conditioning system and upper manifold via the eight probes and is collected in the lower manifold before the water flows through the control sensors and ultimately returns to the pump. The flow is closed and hermetic.
The control sensors system forms a collateral circuit. Temperature and conductivity were measured by a MicroTSG (MicroThermosalinograph) SBE 45 Sea-Bird Electronics (temperature resolution: 0.0001 °C; conductivity resolution: 0.0001 mS/cm) and fluorescence was controlled by a flow
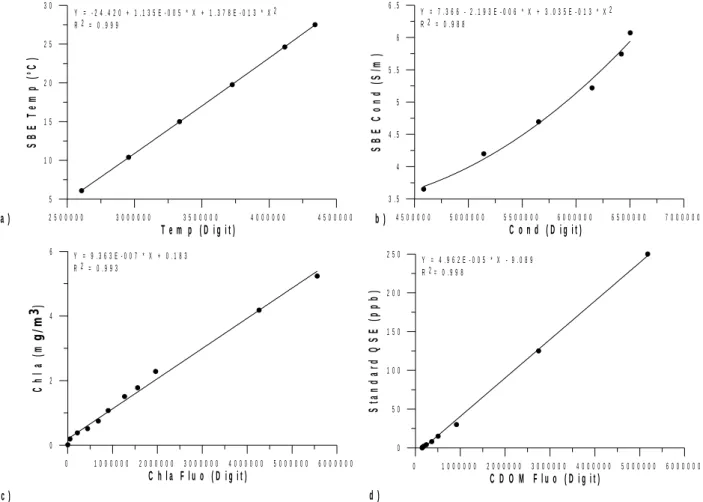
analysis system (FIAlab Instruments by Ocean Optics, spectral range 310–750 nm; photomultiplier based for ultra-low fluorescence). In Figure 9, we show the calibration curves of temperature, conductivity and the Chla and CDOM fluorescence sensors. Concentration abundances of phytoplankton solutions used for the calibration of Chla fluorometers were also analyzed with the standard spectrophotometric method reported in (ISO10260 1992, Jeffrey and Humphrey 1975).
Y = - 2 4 . 4 2 0 + 1 . 1 3 5 E - 0 0 5 * X + 1 . 3 7 8 E - 0 1 3 * X 2 R 2 = 0 . 9 9 9 4 5 0 0 0 0 0 5 0 0 0 0 0 0 5 5 0 0 0 0 0 6 0 0 0 0 0 0 6 5 0 0 0 0 0 7 0 0 0 0 0 0 C o n d ( D i g i t ) 3 . 5 4 4 . 5 5 5 . 5 6 6 . 5 S B E C o n d ( S /m ) Y = 7 . 3 6 6 - 2 . 1 9 3 E - 0 0 6 * X + 3 . 0 3 5 E - 0 1 3 * X 2 R 2 = 0 . 9 8 8 0 1 0 0 0 0 0 0 2 0 0 0 0 0 0 3 0 0 0 0 0 0 4 0 0 0 0 0 0 5 0 0 0 0 0 0 6 0 0 0 0 0 0 C D O M F l u o ( D i g i t ) 0 5 0 1 0 0 1 5 0 2 0 0 2 5 0 S ta n d ar d Q S E ( p p b ) Y = 4 . 9 6 2 E - 0 0 5 * X - 9 . 0 8 9 R 2 = 0 . 9 9 8 0 1 0 0 0 0 0 0 2 0 0 0 0 0 0 3 0 0 0 0 0 0 4 0 0 0 0 0 0 5 0 0 0 0 0 0 6 0 0 0 0 0 0 C h l a F l u o ( D i g i t ) 0 2 4 6 C h l a ( m g /m 3) Y = 9 . 3 6 3 E - 0 0 7 * X + 0 . 1 8 3 R 2 = 0 . 9 9 3 a ) b ) c ) d ) 2 5 0 0 0 0 0 3 0 0 0 0 0 0 3 5 0 0 0 0 0 4 0 0 0 0 0 0 4 5 0 0 0 0 0 T e m p ( D i g i t ) 5 1 0 1 5 2 0 2 5 3 0 S B E T e m p ( °C )
Fig. 9 Calibration curves of a) temperature, b) conductivity, c) Chla fluorescence and d) CDOM fluorescence sensors.
Prototype Applications
New T-FLaP: the Expendable Probe
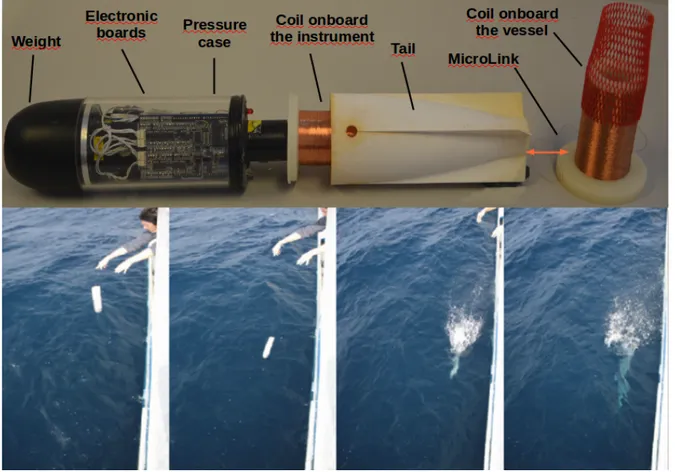
As discussed previously, the basic application of this technology has been the expendable one. Improvements to the first T-FLaP started with the Adriatic Sea Integrated Coastal Areas and River Basin Management System Pilot Project in 2008 (Castellari et al. 2006). Unlike earlier prototypes, the new T-FLaP has a modular cell that can be used to change the configuration of the sensors. The probe is equipped by a specific tail designed and realized to spin the probe during a fall; the rotation allows the coil to correctly unroll itself. As shown in Figure 10, digital data transmission is
assured by twin copper wires wrapped on two reels: one in the probe tail and the other onboard the ship. This setup ensures a connection with the computer until the signal interrupted by a broken wire. Data transmission is provided by an RS-485 serial interface and the communication rate is 19,200 baud, no parity check, one bit stop and no flow control. Data can be acquired on a pc through a serial converter RS-485/232 and a terminal as Windows® HyperTerminal, following the information transmitted by the connected device.
Fig. 10 A new T-FLaP prototype with a transparent case for electronic visualization and the launch during ADR0208 survey
Field Tests
The ADR0208 Oceanographic Cruise coordinated by the Institute of Atmospheric Sciences and Climate of the Italian National Research Council (SAC-CNR) departed on 17 October 2008 from the Port of Bari and ended on 28 October of the same month. The research area consisted of the Southern Adriatic Sea, the Montenegro and Albanian coastal zone and the Boka Kotorska Bay. The Adriatic Sea is a high productivity area and estimates based on the Coastal Zone Color Scanner (CZCS) confirm that the Adriatic Sea has the highest pigment biomass and primary production of all Mediterranean sub-basins (Bohm et al. 2003, Antoine et al. 1995). This dynamic area was
chosen to test the sensors’ responses at different trophic conditions. Five new T-FLaPs were launched along the Dubrovnik-Bari transect at the end of the survey. In each T-FLaP station, standard CTD casts and water sampling were performed using a standard SBE 911 CTD probe with a Chelsea Aquatraka III fluorometer and a rosette sampling system. Since we did not use T-FLaP from a moving ship, we were able to compare the T-FLaP fluorescence measurements with in situ Chla, as shown in Figure 11 a.
Fig. 11 Comparison between T-FLaP (dashed dark line) and Chelsea Aquatraka III (solid grey line) fluorescence profiles and b) Comparison between T-FLaP (dashed dark line) and SBE911 (solid grey line) temperature profiles.
In the first 5–10 m of the water column, depending on the lighting conditions, the T-FLaP fluorometer response can be unreliable due to the saturation of the photodiode; the response becomes consistent at deeper depths. The vertical temperature profiles show how T-FLaP can resolve the structures detected by the CTD with good resolution (Fig.11 b). Although the T-FLaP temperature sensor has an accuracy of 0.01°C with a dynamic response time of 1.5 ms/°C, the sensor performances are obviously lower than that of SBE (Hedges 2002). The main differences between the two probe profiles are more evident in the zone of rapid temperature changes. In fact, even if the accuracy and the response time of the sensor are sufficient for expendable use, the
relation between the falling velocity and data transmission rate is the most important operational aspect, with the T-FLaP now capable of producing data information at every meter of depth.
T-FLaPpro: the Vertical Profiler
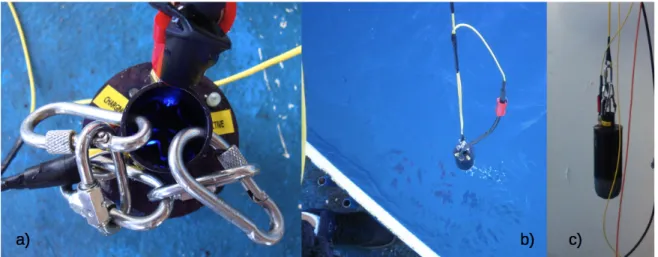
Based on previous applications, a non-expendable vertical profiler (T-FLaPpro) was realized, in order to create a small and low-cost multiparametric probe that can be easily used onboard coastal and smaller vessels. The largest differences are found between the transmission system and the launching methods. In particular, the probe was provided with an underwater connector and a cable developed ad hoc for this application, which allows for real-time data transmission and visualization.
Fig. 12 The T-FLaPpro: a) blue LEDs inside the measure cell, b) the probe during the launching, c) a wide-angle view of the probe.
Field Tests
A series of tests were carried out during the phytoplankton bloom period in order to observe the DCM structure. For this purpose, a survey was conducted off the shore of Civitavecchia (Tyrrhenian Sea, Latium, Italy) coastal area on April 16, 2013.
A vertical profile along the water column was performed by T-FLaPpro and, at the same time, by the IDRONAUT OCEAN SEVEN 316 Plus probe, which was equipped with a temperature sensor and the Seapoint fluorometer. Therefore, it was possible to compare the profiles, as shown in Figure 13 a, and to analyze the capability and sensitivity of T-FLaPpro to detect the DCM structure.
Fig. 13 a) Comparison between T-FLaPpro (dashed dark line) and Seapoint (solid grey line) fluorescence profiles and b) Comparison between T-FLaPpro (dashed dark line) and IDRONAUT OCEAN SEVEN 316Plus (solid grey line)
temperature profiles.
An analysis of the distribution of variables along the water column shows an almost-complete overlap between the profiles acquired with the TFLaPpro and the probe IDRONAUT OCEAN SEVEN 316Plus. In particular the Chla fluorescence profile shows an intense DCM, reaching concentrations of 1 mg/m3.
Spectra: the Stand-alone System
The last prototype, derived from the original technology, is an in-line measuring system, which provides continuous real-time information about the physical and biological states of the surface waters through which the vessel passes. It was developed to be used onboard both coastal, smaller vessels and ships of opportunity such as ferries and commercial ships. The philosophy that inspired this instrument is therefore that of Ferrybox, but with miniaturization of components and a considerable reduction in costs.
This system, called Spectra, is composed of three main modules:
the electronic unit dedicated to the data acquisition, transmission and storage (Fig. 14); the control unit (Fig. 15);
the hydraulic and measuring unit (Fig. 16).
The first unit includes the computer, with a waterproof touch-screen display to manage the acquisition and visualization of data via customized software, and the GPS, essential for measuring position.
Fig. 14 The electronic unit: the scheme (left) and the realized prototype (right)
The control unit, placed under the electronic unit, manages the turning on and off of the devices and the signals of all the payloads; the control unit also controls the pump velocity. The hydraulic and measuring unit houses the flow through the system composed of the diaphragm pump and the two modular measurement cells, equipped with temperature, conductivity, Chla and CDOM fluorescence sensors.
Fig. 16 The hydraulic and measure unit: on the left the scheme the measure units area closed, on the right the same are open
Field Tests
The field tests of the stand-alone application were performed along the Civitavecchia (Central Tyrrhenian Sea, Italy) coast on February 4, 2014. Spectra was fixed on the poop deck of a small coastal vessel and equipped with an input/output pipe system able to transfer water from the sea surface to the internal measuring cells (Fig. 17). The stand-alone application was extremely versatile and the integrated pumping system allowed for installation on different types of vessels. This area was chosen because of the presence of urban discharges and effluents that can be characterized by a high variability in both physical and biological parameters. Temperature and conductivity isosurface maps, shown in Figure 18, exhibit lower values in the southern area, characterized by the presence of the Scarpatosta River. Chla and CDOM fluorescence results are inversely correlated, with lower Chla abundances and higher CDOM levels in the southern study area, indicating the relevant intake of urban water masses, strongly connected to the heavy precipitations that occurred in the previous days.
Fig. 17 Spectra system installed on board a coastal vessel
Fig. 18 In situ Spectra acquisitions: a) temperature, b) conductivity, c) Chla and d) CDOM fluorescence isosurface maps.
Conclusion and Future Directions
We have presented an advanced technology for marine bio-physical measurements. The sensors and the probes that we have developed allow integrated and distributed low-cost marine environmental monitoring. The cost of the prototypes (not engineered) ranges from 1200 Euros for the expendable application (a corresponding probe is not available on the market), 2500 Euros for the T-FLaPpro up to 5000 Euros for the Spectra, far below the cost of the equipment that is currently on the market. The typical investment costs of this kind of instrumentations is much higher: a standard oceanographic fluorometer cost approximately between 1900 and 9000 Euros, while a FerryBox starts at 25,000 Euros.