The association between personal income and smoking
among adolescents: a study in six European cities
Julian Perelman
1, Joana Alves
1, Timo-Kolja Pfoertner
2, Irene Moor
3, Bruno Federico
4,
Mirte A. G. Kuipers
5, Matthias Richter
3, Arja Rimpela
6, Anton E. Kunst
5& Vincent Lorant
7 Escola Nacional de Saúde Pública, Universidade NOVA de Lisboa, and Centro de Investigação em Saúde Pública, Portugal,1Institute for Medical Sociology, Health Services Research, and Rehabilitation Science (IMVR), Faculty of Human Sciences and Faculty of Medicine, University of Cologne, Cologne, Germany,2
Institute of Medical Sociology, Martin Luther University Halle-Wittenberg, Germany,3Department of Human Sciences, Society and Health, University of Cassino and Southern Lazio, Italy,4
Department of Public Health, Academic Medical Center, University of Amsterdam, the Netherlands,5
Department of Adolescent Psychiatry, Tampere University Hospital, Finland6
and Institute of Health and Society, Université catholique de Louvain, Belgium7
ABSTRACT
Aims This study investigates the link between personal income and smoking among adolescents, and aims to answer the following questions: (i) to what extent is personal income related to smoking, independent of family socio-economic status (SES) and (ii) does the association between personal income and smoking apply to different subpopulations?
Design Cross-sectional study.Setting Six cities from European countries (Amersfoort, the Netherlands; Coimbra, Portugal; Hannover, Germany; Latina, Italy; Namur, Belgium; Tampere, Finland) in 2013.Participants A school-based sample of 10 794 adolescents aged 14–17 years.Measurements We modelled smoking experimentation, weekly smoking, daily smoking and (among daily smokers) smoking intensity as function of personal income, adjusting for age, sex, family SES, parental smoking and country. We tested interactions between personal income and covariates. Strati fica-tion analyses were performed for the variables for which interacfica-tions were significant.Findings Adolescents in the highest income quintile were more likely to be smoking experimenters [odds ratio (OR) = 1.87; P< 0.01], weekly smokers (OR = 3.51; P< 0.01) and daily smokers (OR = 4.55; P < 0.01) than those in the lowest quintile. They also consumed more cigarettes per month (β = 0.79; P < 0.01). Adjusting for family SES did not modify the significance of relationships, and increased the magnitude of the association for daily smoking. None of the interactions between covariates and per-sonal income was significant for smoking measures. For the intensity of smoking, the interaction was significant for SES. The stratified analysis showed a non-significant association between smoking intensity and personal income among the oldest adolescents and those with the lowest SES background, while significant among younger and higher SES back-grounds.Conclusion In the Netherlands, Portugal, Germany, Italy, Belgium and Finland, adolescents’ personal income is related positively to smoking behaviours independent of family economic status (SES). However, among low socio-economic status adolescent daily smokers, the association between the intensity of smoking and personal income is weaker.
Keywords Adolescents, bans, incentives, personal income, smoking, socio-economic status.
Correspondence to: Julian Perelman, Escola Nacional de Saúde Pública, Avenida Padre Cruz, 1600-560 Lisbon, Portugal. E-mail: [email protected] Submitted 7 November 2016; initial review completed 6 February 2017;final version accepted 23 June 2017
INTRODUCTION
The literature provides evidence on higher smoking prevalence rates among adolescents with a higher personal income [1–8]. This association was observed in middle-income countries such as China [3] and India [1,4], and high-income countries and regions such as England [5], Scotland [8] and the United States [7]. The relationship was also observed for various indicators such as current
smoking [3,4,7,8], heavy smoking [5] and amount spent on cigarettes [6].
However, the relationship between adolescents’ income and smoking is likely to be heterogeneous, because personal income during adolescence reflects complex dimensions. Although we may think that youths from more advantaged social backgrounds have higher personal incomes, West et al. [9] show that adolescents from lower social classes, from single-parent families and from more
deprived areas have higher personal incomes. This may translate into greater consumerist attitudes and consumer possessions. West et al. [9] discuss whether personal income possibly reflects a greater orientation in lower classes toward immediate (versus deferred) gratification and permeability to consumer pressures compared with individuals in higher classes. The association between adolescents’ personal income and their smoking behaviour may therefore reflect the impact of their family’s socio-economic status (SES), such as parental education, occupation or income, rather thanfinancial resources that they have at their disposal.
Also, personal income may have a different impact on demographic subpopulations, defined in terms of age, sex or SES [10–12]. It was observed, in particular, that the relationship was lower among adolescents from low SES families, attributed potentially to the greater access to cigarettes from non-commercial sources and illegal trade [8]. We may also expect the link to be greater among older adolescents who earn more money and are more likely to be addicted, and may thus rely more heavily upon cigarettes from commercial sources. Finally, smokers who obtain their cigarettes from commercial sources may be more influenced by their financial means than those who obtain them from non-commercial ones.
This paper aimed to contribute to our understanding of the relationship between personal income and smoking by answering the following questions: (i) to what extent is adolescent personal income associated with smoking behaviour, independent of family SES; and (ii) is an associ-ation between personal income and smoking observed from different subpopulations? This paper uses data from 14–17-year-old adolescents from six European cities. METHODS
Design and study population
We used data from the SILNE project (Tackling socio-economic inequalities in smoking: learning from natural experiments by time trend analyses and cross-national comparisons), which surveyed adolescents aged 14–17 years. The data were collected at 50 schools in six cities from six European countries (Namur, Belgium; Tampere, Finland; Hannover, Germany; Latina, Italy; Amersfoort, the Netherlands; and Coimbra, Portugal) through self-administered questionnaires applied between January and November 2013.
The cities were selected because of their size, income and employment rate being close to the national average. In each city, stratified sampling was performed to select schools from low and high socio-economic contexts and different school types. In all schools, all students from two grades in secondary education, corresponding to the targeted age groups, were invited to participate. The
participation rate of this survey was 79.0%. The final sample included 10 794 adolescents. The questionnaire included questions on several dimensions of socio-economic status, life-style and wellbeing at school. For more information on this survey, including design, sample size and ethical approval, see Lorant et al. [13].
Measures Outcomes
We modelled smoking behaviours using a four-category variable representing increasingly regular smoking (never smoker, experimenter, weekly smoker and daily smoker) and a continuous variable (smoking intensity). All variables related to smoking were based on Mayhew et al. [14]. Smoking behaviour was measured with three questions. All respondents were asked:‘Have you ever tried cigarette smoking, even just a few puffs?’ (‘yes’ or ‘no’). Then, those answering ‘yes’ were asked: ‘How many cigarettes have you smoked altogether until now?’ (four categories ranging from ‘only one’ to ‘more than 100’) and‘How many cigarettes have you smoked during the last 30 days?’ (eight categories ranging from ‘none’ to ‘more than 30 cigarettes per day’).
Experimenters included those who reported having ever tried cigarette smoking and/or those having smoked more than one cigarette in their life, including one or two cigarettes during the last 30 days. Weekly smokers were respondents who reported having smoked one or two cigarettes per week during the last 30 days. Daily smokers included those who reported smoking at least one cigarette per day during the last 30 days. Each smoking variable was mutually exclusive; that is, the experimenters did not include the weekly and daily smokers, and the weekly smokers did not include the daily smokers.
The intensity of smoking among daily smokers was defined as the number of cigarettes smoked in the last 30 days, based on categories ‘1–5 per day’, ‘6–10 per day’, ‘11–20 per day’, ‘21–30 per day’ or ‘more than 30 per day’ (note that the eight original categories were reduced to five because we only considered those corresponding to daily smoking). We calculated the total number of cigarettes per month using the mid-interval values for each category, which we multiplied by 30. For the upper category, the value wasfixed using the method proposed by Parker & Fenwick [15]. This resulted in a value of 38 cigarettes per day among daily smokers.
Predictor
Personal income was determined by asking: ‘About how much money do you usually get each week to spend on yourself or to save from pocket money (allowances) and jobs like babysitting, delivering papers, etc.?’. Answers
included six categories: ‘zero’, ‘less than €5’, ‘€6–10’, ‘€11–20’, ‘€21–50’, ‘€51–100’ and ‘more than €100’. In order to obtain cross-country comparable categories, this variable was recoded into country-specific quintiles. For Italy thefirst quintile corresponded to the first category (zero); in Portugal and Belgium to the twofirst categories (zero or less than€5); in the remaining countries to the three first categories (up to €10). The fifth quintile corresponded to the last two categories (above€50) in all countries except Portugal and Italy, where it corresponded to the last three categories (above€20).
Covariates
Potential confounders included age, sex, parental smoking status, country and family SES. These potential confounders were selected because of their expected influence on both smoking and personal income. Parental smoking status was assessed by the question:‘Does any member of your household smoke cigarettes?’, with ‘mother’ and ‘father’ among the possible answers to be selected. We created two separate binary variables for maternal smoking and paternal smoking (yes = 1, no = 0). A recent study using data from the SILNE survey demon-strated the strong link between parental and adolescent smoking [16], in line with previous evidence [17].
Family SES was measured using three variables in order to capture different dimensions of SES; namely: (i) Family Affluence Scale (FAS) [18], (ii) Subjective Social Status (SSS) [19] and (iii) paternal and maternal education level. The FAS represents the material wealth of the family, and ranges between 0 (lowest) and 7 (highest) [18]. It was designed to reflect material living conditions, and its link with adolescents’ health and health behaviour, including with smoking, was observed [18,20]. The SSS was conceived to capture the subjective internalized perception of social status [19], and was shown to be linked strongly to several health measures among adolescents [21], including smoking [22]. SSS was measured with responses on a 10-category scale to the question:‘Imagine that this ladder depicts how country society is made up. Fill in the circle that best represents where your family would be on this ladder’. Finally, parental education is the most commonly used objective SES indicator, showing a robust relationship with adolescent smoking [23]. In this study parental education was grouped into low, middle and high categories, corresponding to primary, secondary and tertiary education, respectively.
As variable of interest for the stratification analysis, we distinguished cigarette buyers and non-buyers dichoto-mously with the question:‘During the past 30 days, how did you usually get your own cigarettes?’. Adolescents answering exclusively:‘I bought them in a shop’, ‘I bought them from a vending machine’ or ‘some other(s) person(s)
bought them for me’ were considered ‘buyers’. Those who did not choose any of these options, or jointly ticked other options, were considered ‘non-buyers’ (i.e. those who responded having obtained their cigarettes from parents, siblings or friends or having stolen them). As a large proportion of young smokers do not buy their cigarettes but obtain them from social sources (more than 60%, according to a study in the United States [24]), especially as a response to strict bans on tobacco sales to minors, we expect the impact of personal income on smoking to be greater among those who buy their cigarettes.
Statistical analysis
We used random-effect multinomial logistic regressions to model the likelihood of being an experimenter, a weekly smoker and a daily smoker. The model used never-smokers as the reference category for the dependent variable in multinomial logistic regressions, thereby contrasting those who experimented smoking with those who never smoked, those who smoke weekly with those who never smoked and those who smoke daily with those who never smoked.
Random-effect models were used to account for random school clustering effect. We also attempted tofit a random effect for country to allow a wider inference to other similar countries. This model did not converge, and we therefore included countries as afixed effect. This has the effect of restricting our results to only the six countries studied.
Smoking intensity (number of cigarettes) was modelled using random-effect generalized linear models assuming a gamma distribution and a log-link. We tested several distributions using the Akaike information criterion (AIC). The lower the AIC value, the better the goodness-of-fit, according to which the gamma was selected (AIC = 7.9 for gamma, 11.9 for normal, 112.7 for Poisson, 8.0 for negative binomial distribution).
All analyses were performed, in a first model, as function of the personal income, adjusting for age, sex, parental smoking and country. To test whether the relationship between personal income and smoking was due to personal income being a proxy of family SES, in a second model we analysed further the extent to which the personal income–smoking link was confounded by adding the family SES variables as covariates.
In order to evaluate the consistency of results throughout subpopulations, we tested the significance of interactions between the personal income variable and several factors; namely, age, sex, family SES and country. For smoking intensity, we also tested the interaction between personal income and the cigarette buyer/non-buyer variable. If any interaction was significant, we performed stratified analyses.
Analyses were conducted in STATA version 13 (Stata Corp., College Station, TX, USA).
RESULTS
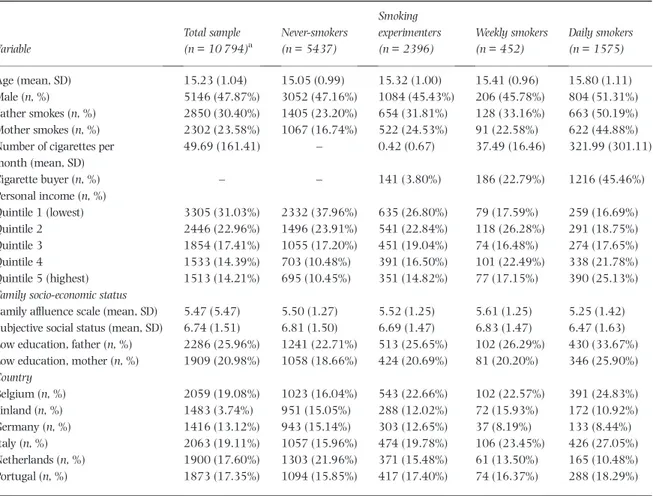
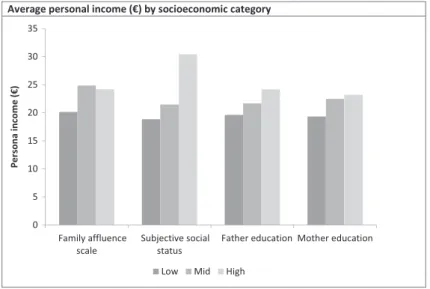
Compared to smokers, the non-smokers were slightly younger and much less likely to have smoking parents (Table 1). Non-smokers were more likely to be in the lowest personal income quintile (38.0% were in the lowest quintile, compared to 17.6% among weekly smokers, and 16.7% among daily smokers). Compared to all other subpopulations, daily smokers came more often from less affluent families, and their parents were more likely to have a lower education level (33.7% of daily smokers had a low-educated father and 25.9% a low-educated mother for 22.7% and 18.7% among non-smokers, respectively). Boys were also more represented than girls among daily smokers. Finally, Italy and Belgium accounted for a larger proportion of daily smokers, and the Netherlands for a larger proportion of non-smokers. Figure 1 highlights the positive link between personal income and all family SES indicators.
Adolescents in the highest personal income quintile were more likely to be smoking experimenters [odds ratio (OR) = 1.87; 95% confidence interval (CI) = 1.08, 1.46], weekly smokers (OR = 3.51; 95% CI = 2.41, 5.10) and daily smokers (OR = 4.55; 95% CI = 3.64, 5.69) than those in the lowest quintile (Table 2). The daily smoking adolescents in the highest quintile also consumed, on average, 0.56 more cigarettes per month (95% CI = 0.35, 0.77). We observed a gradient in daily smoking; that is, the odds ratio was 1.70 for the 2nd quintile, 3.20 for the 3rd quintile, 3.44 for the 4th quintile and 4.55 for the highest quintile. Odds ratios were as expected for the covariates, with a slightly higher smoking risk among older adolescents, and among those with smoking parents.
The inclusion of family SES did not seriously reduce the association of any of the indicators with personal income (Table 3). For daily smoking, the magnitude of the estimates increased, i.e. the association between personal income and smoking was stronger when family SES was included in the model.
We did not observe any significant interaction for the experimenter, weekly smoker and daily smoker variables
Table 1 Characteristics of the sample.
Variable Total sample (n = 10 794)a Never-smokers (n = 5437) Smoking experimenters (n = 2396) Weekly smokers (n = 452) Daily smokers (n = 1575) Age (mean, SD) 15.23 (1.04) 15.05 (0.99) 15.32 (1.00) 15.41 (0.96) 15.80 (1.11) Male (n, %) 5146 (47.87%) 3052 (47.16%) 1084 (45.43%) 206 (45.78%) 804 (51.31%) Father smokes (n, %) 2850 (30.40%) 1405 (23.20%) 654 (31.81%) 128 (33.16%) 663 (50.19%) Mother smokes (n, %) 2302 (23.58%) 1067 (16.74%) 522 (24.53%) 91 (22.58%) 622 (44.88%)
Number of cigarettes per month (mean, SD) 49.69 (161.41) – 0.42 (0.67) 37.49 (16.46) 321.99 (301.11) Cigarette buyer (n, %) – – 141 (3.80%) 186 (22.79%) 1216 (45.46%) Personal income (n, %) Quintile 1 (lowest) 3305 (31.03%) 2332 (37.96%) 635 (26.80%) 79 (17.59%) 259 (16.69%) Quintile 2 2446 (22.96%) 1496 (23.91%) 541 (22.84%) 118 (26.28%) 291 (18.75%) Quintile 3 1854 (17.41%) 1055 (17.20%) 451 (19.04%) 74 (16.48%) 274 (17.65%) Quintile 4 1533 (14.39%) 703 (10.48%) 391 (16.50%) 101 (22.49%) 338 (21.78%) Quintile 5 (highest) 1513 (14.21%) 695 (10.45%) 351 (14.82%) 77 (17.15%) 390 (25.13%)
Family socio-economic status
Family affluence scale (mean, SD) 5.47 (5.47) 5.50 (1.27) 5.52 (1.25) 5.61 (1.25) 5.25 (1.42)
Subjective social status (mean, SD) 6.74 (1.51) 6.81 (1.50) 6.69 (1.47) 6.83 (1.47) 6.47 (1.63)
Low education, father (n, %) 2286 (25.96%) 1241 (22.71%) 513 (25.65%) 102 (26.29%) 430 (33.67%)
Low education, mother (n, %) 1909 (20.98%) 1058 (18.66%) 424 (20.69%) 81 (20.20%) 346 (25.90%)
Country Belgium (n, %) 2059 (19.08%) 1023 (16.04%) 543 (22.66%) 102 (22.57%) 391 (24.83%) Finland (n, %) 1483 (3.74%) 951 (15.05%) 288 (12.02%) 72 (15.93%) 172 (10.92%) Germany (n, %) 1416 (13.12%) 943 (15.14%) 303 (12.65%) 37 (8.19%) 133 (8.44%) Italy (n, %) 2063 (19.11%) 1057 (15.96%) 474 (19.78%) 106 (23.45%) 426 (27.05%) Netherlands (n, %) 1900 (17.60%) 1303 (21.96%) 371 (15.48%) 61 (13.50%) 165 (10.48%) Portugal (n, %) 1873 (17.35%) 1094 (15.85%) 417 (17.40%) 74 (16.37%) 288 (18.29%)
aThe total sample does not correspond to the sum of the samples for categories because smoking experimenters do not include those who have just tried a few
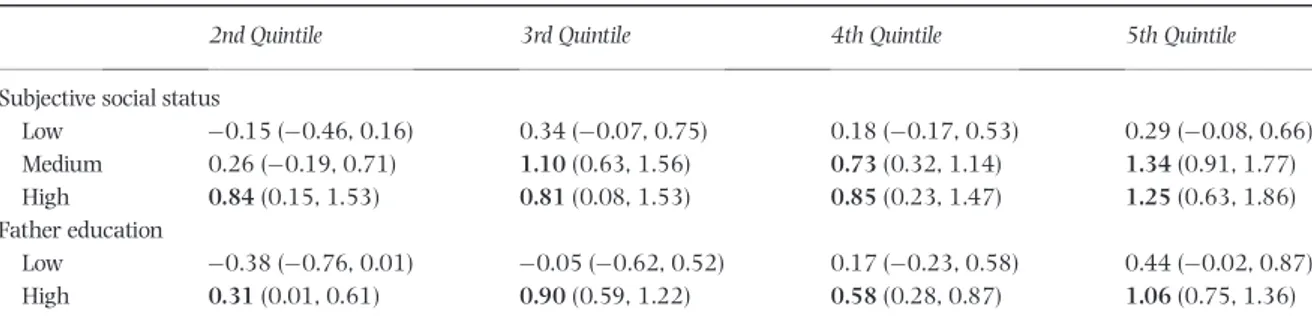
(Table 4). In other terms, the associations of personal income with all smoking indicators were consistent across age, sex, family SES categories and throughout countries. By contrast, for smoking intensity the interac-tions were significant between personal income and subjective social status and father education. We thus performed a stratified analysis for these covariates, which showed a non-significant difference between the highest and the lowest personal income quintiles among those with the lowest subjective social status and among those with a low-educated father (Table 5).
DISCUSSION Keyfindings
Adolescent personal income was associated positively with smoking experimentation, weekly and daily smoking and smoking intensity among daily smokers. The gradient was particularly clear in respect of daily smoking. These associations remained and, in the case of daily smoking, became stronger after controlling for family SES. The associations between personal income and smoking habits were consistent throughout countries, age and SES groups for boys and girls and regardless of whether or not adolescents bought their cigarettes. By contrast, smoking intensity was not related significantly to personal income among those with the lowest family SES.
Interpretation
Using a large sample of adolescents from different Euro-pean cities, the results confirm earlier findings on the strong relationship between personal income and smoking [1–7]. Additionally, we found that personal income had an independent association with smoking, and did not act as a mere proxy of family SES. This association was observed for
different contexts and groups, confirming the robustness of the association between personal income and smoking. The consistence offindings across subpopulations and the existence of a gradient for the risk of daily smoking argues in favour of a causal relationship [25].
Regarding ourfirst question, family SES did not explain the association between personal income and smoking; on the contrary, the inclusion of family SES factors increased the magnitude of the association between personal income and daily smoking. Although personal income and family SES were related positively, as it is sometimes the case in the literature [8], a higher personal income elevates the risk of smoking while a higher family SES reduces it [26]. To some extent, this result is not a surprise because personal income signals an independent behaviour, espe-cially if the money is obtained from employment [27]. This supports earlier studies reporting that adolescents’ own SES was more predictive of smoking than family SES [28,29].
The positive relationship between personal income and smoking contrasts with the results for adults, who are more likely to smoke at lower levels of income. These contrasting patterns between adolescents and adults were demonstrated clearly by Blakely et al. [30], who found that a higher income increased the odds of smoking among those aged 15–24, while it reduced the odds of smoking for those older than 25.
We see six possible explanations for the opposite link between income and smoking between adolescents and adults. First, adolescents in the lowest personal income category have very little or no money at all. This is a powerful barrier against smoking. In contrast, among adults, having a low income makes cigarettes less afford-able but not inaccessible. Secondly, there is no obvious transition from higher personal income during adolescence towards higher revenues in adulthood. The richest
adolescents will not necessarily become the richest adults. This contrasts with the case of education: adolescents with lower grades are more likely to smoke [31], as are low-educated men [32], and lower grades during adolescence
and low educational achievement in adulthood are related strongly [33]. Thirdly, unobservable characteristics specific to adolescence may cause both smoking and a higher per-sonal income, which are correlated because of this
Table 2 Association between personal income, smoking habits and covariates, without adjustment for socio-economic status variables: odds ratios/betas [95% confidence intervals (CI)].
Smoking experimentera (odds ratios, 95% CI)
Weekly smokinga (odds ratios, 95% CI)
Daily smokinga (odds ratios, 95%CI)
Smoking intensityb (β, 95% CI) Personal income
First quintile Reference
Second quintile 1.25 (1.08, 1.46) 2.50 (1.77, 3.53) 1.70 (1.37, 2.12) 0.05 ( 0.26, 0.16)
Third quintile 1.71 (1.44, 2.01) 2.36 (1.61, 3.46) 3.20 (2.52, 4.06) 0.28 (0.05, 0.51)
Fourth quintile 1.92 (1.62, 2.28) 3.94 (2.77, 5.61) 3.44 (2.76, 4.30) 0.24 (0.03, 0.45)
Fifth quintile 1.87 (1.56, 2.23) 3.51 (2.41, 5.10) 4.55 (3.64, 5.69) 0.56 (0.35, 0.77)
Male versus female 0.92 (0.82, 1.02) 0.91 (0.74, 1.15) 1.03 (0.89, 1.19) 0.23 (0.09, 0.37)
Age Age< 15 Reference Age 16 1.36 (1.20, 1.55) 1.89 (1.47, 2.41) 2.00 (1.70, 2.35) 0.03 ( 0.12, 0.17) Age 17 1.24 (0.99, 1.55) 1.70 (1.12, 2.59) 3.32 (2.64, 4.18) 0.49 (0.28, 0.70) Father smokes 1.23 (1.08, 1.40) 1.29 (0.99, 1.67) 1.89 (1.62, 2.21) 0.28 (0.14, 0.42) Mother smokes 1.20 (1.04, 1.39) 1.14 (0.85, 1.53) 2.52 (2.14, 2.96) 0.38 (0.24, 0.53)
All values are adjusted for countryfixed effects.aThe comparison is performed against never smokers;bthis analysis is performed among daily smokers. The
values shown in bold type are those statistically different from one (odds ratios) or zero (betas).
Table 3 Association between personal income, smoking habits and covariates, with adjustment for socio-economic status: odds ratios/ betas [95% confidence intervals (CI)].
Smoking experimenter (odds ratios, 95% CI)
Weekly smoking (odds ratios, 95% CI)
Daily smoking (odds ratios, 95% CI)
Smoking intensity (β, 95% CI) Personal income
First quintile Reference
Second quintile 1.22 (1.03, 1.44) 2.16 (1.49, 3.14) 1.82 (1.41, 2.35) 0.07 ( 0.17, 0.31)
Third quintile 1.61 (1.32, 1.96) 1.97 (1.27, 3.07) 3.82 (2.85, 5.11) 0.59 (0.30, 0.86)
Fourth quintile 2.03 (1.67, 2.45) 3.84 (2.60, 5.66) 4.02 (3.10, 5.21) 0.40 (0.16, 0.65)
Fifth quintile 1.87 (1.52, 2.29) 3.41 (2.25, 5.15) 5.40 (4.14, 7.05) 0.79 (0.54, 1.04)
Male versus female 1.02 (0.90, 1.14) 0.96 (0.75, 1.22) 1.18 (1.00, 1.40) 0.26 (0.11, 0.42)
Age (years) < 15 Reference 16 1.37 (1.19, 1.58) 1.79 (1.37, 2.35) 1.92 (1.60, 2.30) 0.04 ( 0.13, 0.20) 17 1.39 (1.08, 1.78) 1.72 (1.07, 2.76) 3.59 (2.77, 4.65) 0.54 (0.30, 0.77) Father smokes 1.21 (1.05, 1.41) 1.27 (0.95, 1.69) 1.72 (1.44, 2.05) 0.20 (0.04, 0.36) Mother smokes 1.17 (0.99, 1.38) 1.24 (0.90, 1.71) 2.64 (2.19, 3.17) 0.36 (0.19, 0.52) SSS
First tertile Reference
Second tertile 0.98 (0.85, 1.13) 0.93 (0.69, 1.24) 0.75 (0.63, 0.91) 0.26 ( 0.44, 0.08)
Third tertile 0.77 (0.64, 0.91) 0.97 (0.69, 1.35) 0.69(0.55, 0.86) 0.15 ( 0.36, 0.06)
FAS
First tertile Reference
Second tertile 1.18 (1.02, 1.36) 0.98 (0.73, 1.31) 1.17 (0.97, 1.42) 0.06 ( 0.12, 0.24)
Third tertile 1.11 (0.93, 1.32) 1.13 (0.80, 1.59) 1.19 (0.94, 1.50) 0.06 ( 0.26, 0.15)
Low education father 1.00 (0.86, 1.17) 0.99 (0.72, 1.35) 1.16 (0.96, 1.41) 0.29 (0.11, 0.48)
Low education mother 1.01 (0.85, 1.19) 1.02 (0.74, 1.43) 0.92 (0.75, 1.14) 0.07 ( 0.13, 0.26)
All values are adjusted for countryfixed effects. SSS = Subjective Social Status; FAS = Family Affluence Scale. The values shown in bold type are those statis-tically different from one (odds ratios) or zero (betas).
common explanatory factor. A possible cause would be, for example, a greater autonomy with respect to parents or teachers, in combination with lower parental control [27], leading to the opportunity to obtain a higher personal income as well as to adopt risky behaviours. Fourthly, as far as adolescents are less addicted to smoking, they may be more responsive to economic incentives such as income and prices. As addiction increases, it is more difficult to stop smoking or decrease the cigarette consumption following a negative income shock or a rise in prices. Fifthly, the reasons for the inverse gradient in smoking among adults are related to causes that may not prevail among adoles-cents, such as chronic stress caused by deprivation and living in disadvantaged neighbourhoods or low access to smoking cessation services [34]. Finally, the literature indicates that while there is an inverse relationship among adults between income and smoking, a short-term increase in income may lead to higher cigarette consumption [35]. A natural experiment in the United States showed, for example, that an expansion of the Earned Income Tax Credit Program, a wage supplement programme for
low-income workers, was associated with an increase in the number of cigarettes consumed [36]. This result may explain the opposite role of income between adolescents and adults if we interpret the adolescents’ personal income as a temporary situation related, for example, to a student job, while the adults’ income reflects other resources such as knowledge, prestige or power [35].
The weaker relationship between personal income and smoking among low SES adolescents, also observed by West et al. [8], is not straightforward to interpret. West et al. [8] suggest that this result may be caused by a greater opportunity to access cigarettes through non-commercial sources, because low SES adolescents are more likely to have smoking parents and friends. However, no statistical difference in the association between smoking intensity and personal income was observed between cigarette buyers and non-buyers, contradicting this explanation. Also, low SES adolescents in our sample had a lower personal income on average, so that it is unlikely that cigarettes were more affordable in this group. A recent qualitative study on Scottish adolescents from deprived
Table 4 Significance tests for interactions between personal income and several covariates.
Experimenter Weekly smoker Daily smoker Smoking intensity
χ2
P-value χ2 P-value χ2 P-value χ2 P-value
Age (years)
16 1.30 0.86 4.78 0.31 3.28 0.51 2.27 0.69
17 4.57 0.33 3.50 0.48 1.39 0.85 6.01 0.20
Sex 4.62 0.33 8.37 0.08 2.62 0.62 2.92 0.57
Subjective social status (SSS) 7.28 0.51 9.74 0.28 13.06 0.11 18.60 0.02
Family affluence scale (FAS) 10.29 0.24 9.65 0.29 11.51 0.17 4.26 0.83
Low education father 2.42 0.66 5.00 0.29 4.00 0.41 11.68 0.02
Low education mother 2.24 0.69 1.99 0.73 0.47 0.98 4.83 0.31
Countries 10.48 0.79 18.87 0.22 18.51 0.24 21.98 0.11
Cigarette buyer – – – – – – 3.63 0.46
SSS = Subjective Social Status; FAS = Family Affluence Scale. Significant values for a 95% threshold are shown in bold type.
Table 5 Association between personal income and smoking intensity, by subgroups: betas for the 2nd to 5th versusfirst income quintile.a
2nd Quintile 3rd Quintile 4th Quintile 5th Quintile
Subjective social status
Low 0.15 ( 0.46, 0.16) 0.34 ( 0.07, 0.75) 0.18 ( 0.17, 0.53) 0.29 ( 0.08, 0.66) Medium 0.26 ( 0.19, 0.71) 1.10 (0.63, 1.56) 0.73 (0.32, 1.14) 1.34 (0.91, 1.77) High 0.84 (0.15, 1.53) 0.81 (0.08, 1.53) 0.85 (0.23, 1.47) 1.25 (0.63, 1.86) Father education Low 0.38 ( 0.76, 0.01) 0.05 ( 0.62, 0.52) 0.17 ( 0.23, 0.58) 0.44 ( 0.02, 0.87) High 0.31 (0.01, 0.61) 0.90 (0.59, 1.22) 0.58 (0.28, 0.87) 1.06 (0.75, 1.36) a
All values are adjusted for age, sex, country and family socio-economic status (FAS, subjective social position and parents’ education). The stratification var-iable was, however, always removed from the list of covariates. Some values could not be estimated for specific quintiles and countries due to the too-low num-ber of observations. The values in shown in bold type are those statistically different from zero.
areas suggested that some adolescents received money from their parents specifically to buy cigarettes, which adolescents may not view as personal income [37]. A recent paper also showed that low SES adolescents were more exposed to smoking by their friends [26], so that the exchange of cigarettes may be more common in that group, attenuating the influence of personal income. Hence, there would be ways for low SES adolescents to circumvent the lack of personal income to get cigarettes, explaining why personal income has a weaker impact. The weak association of smoking and personal income in these cases may explain, in part, why the sensitivity to price among adolescents is highly variable in the literature, with low values in some cases [38,39], related to the relatively low responsiveness to economic circumstances.
Limitations
This study has some limitations. First, no information was collected on cigarette expenditure or on the different uses of the personal income. This lack of information precluded the precise measurement of the income elasticity of cigarette expenditures, which would be especially impor-tant for defining tax values. However, the aim of this paper was to understand more clearly the relationship between personal income and smoking behaviours, and not to pro-duce detailed elasticity estimates, which require other types of information.
Secondly, the comparison was limited to six countries characterized by small differences in the price of tobacco; indeed, the weighted average price of a pack in 2013 varied from€3.85 in Portugal to €5.29 in the Netherlands [40]. A broader study including more countries with more differ-entiated characteristics could increase the contrasts in exposure and thereby improve the strength of conclusions. Also, because countries werefixed in the analysis, it cannot be inferred that the results apply to any other countries.
Thirdly, because the survey had a single question concerning personal income, we have not been able to assess how smoking is related to the sources of income. For example, one study found that students who receive money from part-time employment are more likely to purchase fast food and alcohol (but not cigarettes) than those who receive money from their parents [6]. Buying behaviour may also differ if the money is received in cash or paid electronically into bank accounts.
Finally, it is unclear from our results whether personal income influences smoking or smoking influences the personal income. Indeed, it may be that smokers, especially those who have developed nicotine dependency, implement strategies to obtain a higher personal income in order to afford cigarettes. Unfortunately, only longitudinal data would help to determine the direction of causation. The association reveals clearly, however, that youths are
sensitive to financial incentives, either in the sense that more income allows them to smoke, or that smoking encourages them to earn money to buy cigarettes.
CONCLUSION
Adolescents’ personal income is a strong predictor of smoking status and, among daily smokers, of smoking intensity. These associations remained, and in the case of daily smoking became stronger, after controlling for family SES. This result highlights that adolescents are sensitive to economic incentives, confirming that price increases may be effective in preventing youth smoking experimentation and weekly smoking. However, the association between the intensity of smoking and personal income was weaker among low SES adolescents, suggesting that economic ar-guments may be less effective to discourage smoking in this group, with the potential unintended consequence of in-creasing inequalities in smoking.
Declaration of interests None.
Acknowledgements
This study was part of the project‘Tackling socio-economic inequalities in smoking: learning from natural experiments by time trend analyses and cross-national comparisons’ (SILNE), which was funded by the European Commission, Directorate General for Research and Innovation, under the Seventh Framework Programme Health 2011 pro-gramme, with grant agreement number no. 278273. Funding was also received from the European Union’s Ho-rizon 2020 research and innovation programme under grant agreement number 635056 (Enhancing the effec-tiveness of programmes and strategies to prevent smoking by adolescents: a realist evaluation comparing seven Euro-pean countries; SILNE-R).
References
1. Kumar V., Talwar R., Roy N., Raut D., Singh S. Psychosocial determinants of tobacco use among school going adolescents in Delhi, India. J Addict 2014; 2014: 170941.
2. Savvides E. C., Christophi C. A., Paisi M., Pampaka D., Kinnunen T., Connolly G. N. Factors associated with intent to quit tobacco use in Cyprus adolescents. Prev Med 2014; 60: 83–7.
3. Ma J., Zhu J., Li N., He Y., Cai Y., Qiao Y. et al. Cigarette smoking in Chinese adolescents: importance of controlling the amount of pocket money. Public Health 2013; 127: 687–93. 4. Mohan S., Sankara Sarma P., Thankappan K. R. Access to
pocket money and low educational performance predict to-bacco use among adolescent boys in Kerala, India. Prev Med 2005; 41: 685–92.
5. Hughes S. K., Hughes K., Atkinson A. M., Bellis M. A., Smallthwaite L. Smoking behaviours, access to cigarettes
and relationships with alcohol in 15- and 16-year-old schoolchildren. Eur J Public Health 2011; 21: 8–14. 6. Darling H., Reeder A. I., McGee R., Williams S. Brief report:
Disposable income, and spending on fast food, alcohol, ciga-rettes, and gambling by New Zealand secondary school students. J Adolesc 2006; 29: 837–43.
7. Rudatsikira E., Muula A. S., Siziya S. Current cigarette smoking among in-school American youth: results from the 2004 National Youth Tobacco Survey. Int J Equity Health 2009; 8: 10.
8. West P., Sweeting H., Young R. Smoking in Scottish youths: personal income, parental social class and the cost of smoking. Tob Control 2007; 16: 329–35.
9. West P., Sweeting H., Young R., Robins M. A material para-dox: socioeconomic status, young people’s disposable income and consumer culture. J Youth Stud 2006; 9: 437–62. 10. Nonnemaker J. M., Farrelly M. C. Smoking initiation among
youth: the role of cigarette excise taxes and prices by race/ethnicity and gender. J Health Econ 2011; 30: 560–7. 11. Gruber J., Zinman J. Youth Smoking in the United States:
Evi-dence and Implications. Risky Behavior Among Youths: An Economic Analysis. Chicago, IL: University of Chicago Press; 2001, pp. 69–120.
12. Pförtner T.-K., Hublet A., Schnohr C. W., Rathmann K., Moor I., de Looze M. et al. Socioeconomic inequalities in the impact of tobacco control policies on adolescent smoking. A multi-level study in 29 European countries. Addict Behav 2016; 53: 58–66.
13. Lorant V., Soto V. E., Alves J., Federico B., Kinnunen J., Kuipers M. et al. Smoking in school-aged adolescents: design of a social network survey in six European countries. BMC Res Notes 2015; 8: 91.
14. Mayhew K. P., Flay B. R., Mott J. A. Stages in the development of adolescent smoking. Drug Alcohol Depend 2000; 59: 61–81. 15. Parker R. N., Fenwick R. The Pareto curve and its utility for open-ended income distributions in survey research. Soc Forces 1983; 872–85.
16. Alves J., Perelman J., Soto-Rojas V., Richter M., Rimpelä A., Loureiro I. et al. The role of parental smoking on adolescent smoking and its social patterning: a cross-sectional survey in six European cities. J Public Health 2016; https://doi.org/ 10.1093/pubmed/fdw040.
17. Melchior M., Chastang J.-F., Mackinnon D., Galéra C., Fombonne E. The intergenerational transmission of tobacco smoking—the role of parents’ long-term smoking trajectories. Drug Alcohol Depend 2010; 107: 257–60.
18. Currie C., Molcho M., Boyce W., Holstein B., Torsheim T., Rich-ter M. Researching health inequalities in adolescents: the development of the health behaviour in school-aged children (HBSC) family affluence scale. Soc Sci Med 2008; 66: 1429–36. 19. Goodman E., Adler N. E., Kawachi I., Frazier A. L., Huang B., Colditz G. A. Adolescents’ perceptions of social status: development and evaluation of a new indicator. Pediatrics 2001; 108: e31–e.
20. Pförtner T. K., Moor I., Rathmann K., Hublet A., Molcho M. et al. The association between family affluence and smoking among 15-year-old adolescents in 33 European countries, Israel and Canada: the role of national wealth. Addiction 2015; 110: 162–73.
21. Karvonen S., Rahkonen O. Subjective social status and health in young people. Sociol Health Illn 2011; 33: 372–83.
22. Finkelstein D. M., Kubzansky L. D., Goodman E. Social status, stress, and adolescent smoking. J Adolesc Health 2006; 39: 678–85.
23. Hanson M. D., Chen E. Socioeconomic status and health behaviors in adolescence: a review of the literature. J Behav Med 2007; 30: 263.
24. Johnston L. D., O’Malley P. M., Terry-McElrath Y. M. Methods, locations, and ease of cigarette access for American youth, 1997–2002. Am J Prev Med 2004; 27: 267–76.
25. Bradford H. A. The environment and disease: association or causation? Section of occupational medicine. Proc R Soc Med 1965; 295: 7–12.
26. Lorant V., Rojas V. S., Robert P.-O., Kinnunen J. M., Kuipers M. A., Moor I. et al. Social network and inequalities in smoking amongst school-aged adolescents in six European countries. Int J Public Health 20161–10.
27. Jung S. H., Tsakos G., Sheiham A., Ryu J. I., Watt R. G. Socio-economic status and oral health-related behaviours in Korean adolescents. Soc Sci Med 2010; 70: 1780–8. 28. Paavola M., Vartiainen E., Haukkala A. Smoking from
adolescence to adulthood. Eur J Public Health 2004; 14: 417–21.
29. Sweeting H., Hunt K. Adolescent socio-economic and school-based social status, health and well-being. Soc Sci Med 2014; 121: 39–47.
30. Blakely T., van der Deen F. S., Woodward A., Kawachi I., Carter K. Do changes in income, deprivation, labour force status and family status influence smoking behaviour over the short run? Panel study of 15 000 adults. Tob Control 2013; 23: e106–13.
31. Bryant A. L., Schulenberg J., Bachman J. G., O’Malley P. M., Johnston L. D. Understanding the links among school misbehavior, academic achievement, and cigarette use: a national panel study of adolescents. Prev Sci 2000; 1: 71–87. 32. Huisman M., Kunst A., Mackenbach J. Inequalities in the prevalence of smoking in the European Union: comparing education and income. Prev Med 2005; 40: 756.
33. Chen Z.-Y., Kaplan H. B. School failure in early adolescence and status attainment in middle adulthood: a longitudinal study. Sociol Educ 2003; 110–27.
34. Pampel F., Krueger P., Denney J. T. Socioeconomic disparities in health behaviors. Annu Rev Sociol 2010; 36: 349. 35. Glymour M., Avendano M., Kawachi I. Socioeconomic status
91 and health. In: Berkman L., Kawachi I., Glymour M., edi-tors. 92 Social Epidemiology. New-Yok: Oxford University Press; 2014, pp. 17–62.
36. Kenkel D. S., Schmeiser M. D., Urban C. Is smoking inferior? Evidence from variation in the earned income tax credit. J Hum Resour 2014; 49: 1094–120.
37. Donaghy E., Bauld L., Eadie D., McKell J., Pringle B., Amos A. A qualitative study of how young Scottish smokers living in disadvantaged communities get their cigarettes. Nicotine Tob Res 2013; 15: 2053–9.
38. Gallet C. A., List J. A. Cigarette demand: a meta-analysis of elasticities. Health Econ 2003; 12: 821–35.
39. Wilson L. M., Avila Tang E., Chander G., Hutton H. E., Odelola O. A., Elf J. L. et al. Impact of tobacco control interventions on smoking initiation, cessation, and prevalence: a systematic review. J Environ Public Health 2012; 2012: 961724. 40. Joossens L., Raw M. The Tobacco Control Scale in Europe 2013.
![Table 3 Association between personal income, smoking habits and covariates, with adjustment for socio-economic status: odds ratios/ betas [95% con fidence intervals (CI)].](https://thumb-eu.123doks.com/thumbv2/123dokorg/4697038.44602/6.890.105.764.623.1067/association-personal-smoking-covariates-adjustment-economic-fidence-intervals.webp)