2019
Publication Year
2020-12-03T11:43:19Z
Acceptance in OA@INAF
þÿALMA and HST Kiloparsec-scale Imaging of a Quasar-galaxy Merger at Z "H 6.2
Title
DECARLI, ROBERTO; DOTTI, MASSIMO; Bañados, Eduardo; Farina, Emanuele
Paolo; Walter, Fabian; et al.
Authors
10.3847/1538-4357/ab297f
DOI
http://hdl.handle.net/20.500.12386/28643
Handle
THE ASTROPHYSICAL JOURNAL
Journal
880
ALMA and
HST Kiloparsec-scale Imaging of a Quasar-galaxy Merger at Z≈6.2
Roberto Decarli1 , Massimo Dotti2,3, Eduardo Bañados4,5 , Emanuele Paolo Farina4,6 , Fabian Walter4,7,8 , Chris Carilli7,9 , Xiaohui Fan10 , Chiara Mazzucchelli11 , Marcel Neeleman4 , Mladen Novak4, Dominik Riechers12 , Michael A. Strauss13 ,
Bram P. Venemans4 , Yujin Yang14 , and Ran Wang15 1
INAF—Osservatorio di Astrofisica e Scienza dello Spazio di Bologna, via Gobetti 93/3, I-40129, Bologna, Italy;[email protected] 2
Università degli Studi di Milano-Bicocca, Dipartimento di Fisica G. Occhialini, piazza della Scienza 3, I-20126 Milano, Italy 3
INFN, Sezione Milano-Bicocca, Piazza della Scienza 3, I-20126 Milano, Italy 4Max-Planck Institut für Astronomie, Königstuhl 17, D-69117, Heidelberg, Germany 5
The Observatories of the Carnegie Institute of Washington, 813 Santa Barbara Street, Pasadena, California 91101, USA 6
Max-Planck-Institut für Astrophysik, Karl-Schwarzschild-Str. 1, D-85748 Garching, Germany 7
National Radio Astronomy Observatory, Pete V. Domenici Array Science Center, P.O. Box O, Socorro, NM, 87801, USA 8
Astronomy Department, California Institute of Technology, MC249-17, Pasadena, California 91125, USA 9
Battcock Centre for Experimental Astrophysics, Cavendish Laboratory, University of Cambridge, 19 J J Thomson Avenue, Cambridge CB3 0HE, UK 10
Steward Observatory, University of Arizona, 933 N. Cherry St., Tucson, AZ 85721, USA 11
European Southern Observatory, Alonso de Córdova 3107, Vitacura, Región Metropolitana, Chile 12
Cornell University, 220 Space Sciences Building, Ithaca, NY 14853, USA 13
Department of Astrophysical Sciences, Princeton University, Princeton, New Jersey 08544, USA 14
Korea Astronomy and Space Science Institute, Daedeokdae-ro 776, Yuseong-gu Daejeon 34055, Republic of Korea
15Kavli Institute of Astronomy and Astrophysics at Peking University, 5 Yiheyuan Road, Haidian District, Beijing 100871, People’s Republic of China Received 2019 March 29; revised 2019 June 5; accepted 2019 June 11; published 2019 August 5
Abstract
We present kiloparsec-scale Atacama Large Millimeter/submillimeter Array (ALMA) and Hubble Space Telescope imaging of the quasar PJ308–21 at z=6.2342, tracing dust, gas (via the [CII] 158 μm line), and young
stars. At a resolution of∼0 3 (≈1.7 kpc), the system is resolved over >4″ (>20 kpc). In particular, it features a main component, identified to be the quasar host galaxy, centered on the accreting supermassive black hole; and two other extended components are on the west and east side: one redshifted and the other blueshifted relative to the quasar. The[CII] emission of the entire system stretches over >1500 km s−1 along the line of sight. All the components of the system are observed in dust,[CII], and rest-frame ultraviolet (UV) emission. The inferred [CII]
luminosities [(0.9–4.6)×109 L]; dust luminosities [(0.15–2.6)×1012 L]; rest-frame UV luminosities [(6.6–15)×1010 L
], their ratios, and the implied gas/dust masses; and star formation rates [11–290 Myr−1] are typical of high-redshift star-forming galaxies. A toy model of a single satellite galaxy that is tidally stripped by the interaction with the quasar host galaxy can account for the observed velocity and spatial extent of the two extended components. An outflow interpretation of the unique features in PJ308–21 is not supported by the data. PJ308–21 is thus one of the earliest galaxy mergers imaged at cosmic dawn.
Key words: galaxies: high-redshift– galaxies: interactions – galaxies: ISM – galaxies: star formation – quasars: general
1. Introduction
Quasars are the most luminous nontransient sources in the universe. Their enormous energy output, powered by intense (5 Myr−1) and radiatively efficient gas accretion onto a supermassive (108−10 M) black hole, makes them ideal laboratories to study the intergalactic medium and the ionization history of the early universe (e.g., Bañados et al.
2018; Davies et al.2018), the build-up of massive black holes
(e.g., Volonteri2012; Mazzucchelli et al.2017), the formation
of the first massive galaxies (e.g., Venemans et al.2017), and
the development of the first large-scale structures in the universe(e.g., Balmaverde et al. 2017).
Models of early massive black hole formation postulate that z>6 quasars reside in the extreme peaks of the large-scale density structure(e.g., Angulo et al.2012), where gravitational
interactions and mergers are expected. Direct observational evidence of these processes is challenging at these redshifts. With only few exceptions (see, e.g., Farina et al. 2017),
companion sources are faint and often identified only via broadband imaging (e.g., Stiavelli et al. 2005; McGreer et al.
2014), thus leaving room for contamination by foreground
sources.
The exceptional sensitivity and imaging power of the Atacama Large Millimeter/submillimeter Array (ALMA) now allows us to image the dust and cold gas reservoirs (the latter probed, in particular, via the [CII] 158 μm line) of
galaxies in the early universe in detail. Decarli et al. (2017)
used ALMA to identify four [CII]-bright galaxies in close
proximity to z>6 quasars out of a survey of 27 objects (Decarli et al. 2018). Two of these systems, PJ308–21 and
PJ231–20, show projected separations between the quasar and the companion galaxy of 10 kpc, thus making an ongoing merger scenario very plausible. The quasar PJ167–13 also shows a very close [CII]-emitting companion (Willott et al.
2017; Neeleman et al. 2019). Similar cases have been found
also at lower redshifts (e.g., Trakhtenbrot et al. 2017; Díaz-Santos et al.2018) as well as in the proximity of Lyman-break
galaxies at z≈6 (Jones et al.2017).
In this work, we present new high-resolution ALMA and Hubble Space Telescope (HST) imaging of the quasar +companion system PSO J308.0416–21.2339 (Bañados et al.
2016; hereafter PJ308–21) at z=6.2342. The synergy of ALMA and HST observations reveals the morphology and © 2019. The American Astronomical Society. All rights reserved.
internal dynamics of this system and properties of its star-forming medium.
Throughout the paper, we assume a standard ΛCDM cosmology with H0=70 km s−1Mpc−1, Ωm=0.3, and ΩΛ=0.7 (which is consistent with the measurements by the Planck Collaboration et al. 2016). In this framework, at
z=6.2342, the luminosity distance is 60,366 Mpc, and 1″ on sky corresponds to a projected physical separation of 5.59 kpc. Magnitudes are reported in the AB photometric system.
2. Observations and Data Reduction 2.1. ALMA
The ALMA observations of PJ308–21 discussed here include the original low-resolution(∼1″) data from the survey of[CII] and underlying dust continuum in z>5.94 quasars by
Decarli et al.(2018) and Venemans et al. (2018; program ID: 2015.1.01115.S). In addition, we present new follow-up observations at a high resolution (∼0 3) obtained in a Director’s Discretional Time allocation (program ID: 2016. A.00018.S). These high-resolution observations were collected in two executions on 2017 May 3 and 5, while the array was in C40-5 configuration. We adopted the same frequency setting and pointing direction as for the low-resolution data, thus encompassing the redshifted[CII] line (ν0=1900.547 GHz) at the frequency of 263.18 GHz. The high-resolution observations include ∼1 hr of on-source data. The quasars J1924-2914, J2056-4714, and J2042-2255 served as the bandpass,flux, and phase calibrator, respectively.
We ran the ALMA pipeline in Common Astronomy Software Applications (CASA, v.4.7.2; McMullin et al.
2007) for data calibration. The typical phase rms is <20◦even at the longest baselines(≈1.1 km). We concatenated the low-and high-resolution data sets low-and inverted the visibilities using the task tclean. We created a data cube by adopting Briggs weighting with a robustness parameter set to 2(i.e., “natural” visibility weighting). The synthesized beam size is 0 38×0 30 (at a position angle=82°). We sampled the spectral dimension in 30 km s−1wide channels. The typical rms of the noise is 0.20 mJy beam−1 per 30 km s−1 channel. Following Decarli et al. (2018), we also create a line-free
continuum image, which is then used to perform continuum subtraction via the taskuvsub. Because of the intricate velocity structure of this system spanning a large range of frequency, we capitalize on the line-free channels of the full available spectral coverage in the creation of the continuum image, which reaches an rms of 10.6μJy beam−1. The continuum-subtracted [CII]
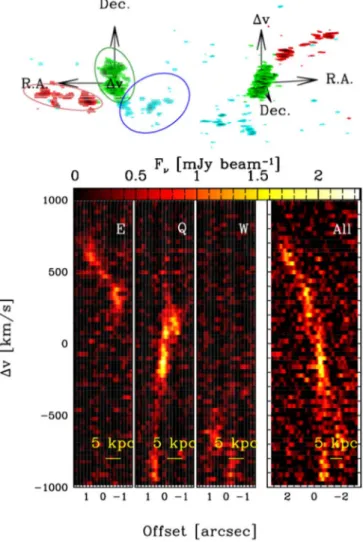
cube is then collapsed along the frequency axis after applying a signal-to-noise ratio (S/N)>1.5 mask, in order to create moment 0 and 1 maps. Figure1shows these two maps together with the dust continuum map. We extract [CII] position–
velocity diagrams along various directions. Finally, we produce 3D renderings of the continuum-subtracted [CII] emission to
fully capture the complex morphological and kinematical structure of the system(see Figure 2).
2.2. HST
The HST observed PJ308–21 on 2017 May 4 (program 14876), using the F140W filter on the Wide Field Camera 3 (WFC3) infrared (IR) arm. At z=6.2342, the pivot wave-length of the filter (λ=1.392 Å) samples the rest-frame far-ultraviolet (far-UV, 1925 Å) emission. The total integration
was 2611.75 s, split into four frames with small dithering offsets(as in the WFC3-IR-DITHER-BOX-MIN template).
The data reduction was performed using the standard HST pipeline, in particular, theAstroDrizzle package (version 2.1.3. dev). The pixel scale of the final image is 0 128 pixel−1. We reach a 5σ surface brightness limit of 26.6 mag arcsec−2 for a 1 arcsec2aperture.
In order to search for extended emission from the host galaxy of PJ308–21 and from the companion source in the HST image, we model and remove the pointlike emission from the quasar. We do so usingGALFIT (Peng et al.2006), combined
with a suite of custom IRAF-based16 tasks(see, e.g., Decarli et al. 2012). We create a model of the point-spread function
(PSF) by median-averaging the normalized images of eight stars in the field, which are chosen for being distant from potential contaminants and with aflux 1.5–15× brighter than the quasar(in order to measure the PSF wings well). We do not down-select reference stars by their spectral type, thus the PSF model might carry systematic uncertainties due to the color dependence of the empirical PSFs used in the analysis. However, our empirical PSF model appears to work well for subtracting the color-sensitive diffraction spikes. We fit this empirical PSF model to the quasar image by allowing the PSF centroid to move by< 1 pixel, i.e., the PSF is scaled to capture only the nuclear emission. The observed image, the model PSF, and the residuals after PSF subtraction are shown in Figure3.
3. Analysis and Results 3.1. Morphology of the System
Both the ALMA and HST images of the PJ308–21 system reveal extended structures. The bulk of the gas, traced by the [CII] emission, is organized in a 4.5 kpc long structure that is
roughly aligned with the north–south direction and spatially coincident with the quasar emission seen at optical/near-IR wavelengths. We will refer to this component as the quasar host galaxy, Q. Its integrated [CII] flux is 4.7 Jy km s−1, corresp-onding to a[CII] luminosity of L[CII]=4.6×10
9L
.17The HST image of the host is mostly outshone by the quasar emission, but residuals of modest intensity(to a flux density of ∼25.3 mag) are apparent in the southeast after PSF subtraction. The [CII] emission originally identified as a quasar
companion(Decarli et al. 2017) extends >10 kpc eastward of
the quasar host (hereafter, E). It shows a marked velocity gradient along the east–west axis, with a shift with respect to the quasar host rest frame that rises from+300 km s−1to about +700 km s−1at increasing projected distance. The[CII] flux of the Eastern cloud is 1.7 Jy km s−1, yielding a[CII] luminosity
of L[CII]=1.7´109 L. The [CII] emission also extends westward of the quasar(W). In this case the velocity difference drops at larger projected distance, ranging from−900 km s−1at the southern edge of the quasar host galaxy to −600 km s−1 further away. The integrated [CII] flux of this component is
0.9 Jy km s−1, corresponding to a luminosity of L[CII]=9.0×10⁸ L. The dust emission shows a similar morphology(see Figure1).
16
IRAF is distributed by the National Optical Astronomy Observatory, which is operated by the Association of Universities for Research in Astronomy (AURA) under a cooperative agreement with the National Science Foundation. 17
This is∼25% higher than the one originally published in Decarli et al. (2017) because the superior depth of the new data allows us to better capture
the full extent of the emission.
Remarkably, the[CII] emission in both E and W is spatially
aligned with and shows a similar morphology to the diffuse emission detected with the HST. This unambiguously associ-ates the latter with young stars at the redshift of the quasar, and it is not due to a projected foreground object. An additional blob is observed northwest of the quasar and appears to be connected to the quasar host; however, because of the lack of a clear [CII] counterpart, we cannot rule out that it is a
foreground source. Finally, a relatively bright object located ∼2 5 northeast of PJ308–21 is identified with a foreground source(see Farina et al. 2019, in preparation), which is visible also in the Panoramic Survey Telescope and Rapid Response System(Pan-STARRS) i and z bands (with measured fluxes of 22.81±0.11 and 22.15±0.17, respectively; Chambers et al.
2016).
3.2. Gas and Dust Masses and ISM Properties The most common tracer of(molecular) gas in high-redshift galaxies is carbon monoxide (CO; for a review, see Carilli & Walter 2013), which has not been observed in PJ308–21 yet.
Instead, we infer the order of magnitude constraints on the gas mass budget from first principles on the [CII] emissivity,
following Venemans et al. (2017). We use the observed [CII]
line emission to infer the mass in singly ionized carbon, MC+, under the assumptions that the[CII] emission is optically thin
and that ionized carbon is in local thermodynamical
equilibrium: = ´ ¢ + -M M Q T e L 2.92 10 4 K km s pc 1 T C 4 ex 91.2 C 1 2 II ex ( ) ( ) [ ]
where Q T( ex)=2 +4 exp(-91.2 Tex) is the partition func-tion, and Texis the excitation temperature. For a typical photon-dominated region value of Tex=100 K (see, e.g., Meijerink et al.2007; Venemans et al.2017), we infer MC+=(13.9, 5.1,
2.7)×106Mfor Q, E, and W, respectively. We then derive an associated gas mass, Mgasmin, by assuming the protosolar carbon abundance(C/H=2.95×10−4; Asplund et al.2009).
This yieldsMgas = 4.7, 1.7, 0.9 ´10
min ( ) 10 M
for Q, E, and W, respectively. These are lower limits in that the estimated gas mass would increase if we correct for the carbon that is not in a singly ionized form, if we allow for a lower metallicity, or if we account for suppressed [CII] emission due to collisional
de-excitation, nonnegligible optical depth, etc. We stress, how-ever, that the system (or parts of it) might not be in thermodynamical equilibrium, thus invalidating our Mgas
lim estimates; e.g., shocks can enhance [CII] emission (see, e.g.,
Appleton et al. 2013). Alternatively, Zanella et al. (2018)
proposed the use of[CII] as a tracer of the molecular gas mass
via an empirically calibrated [CII]-to-H2 mass ratio of α[CII]=30 M/L. When adopting afixed α[CII], one should keep in mind that a plethora of physical processes (intensity and hardness of the radiation field, collisional de-excitation, extent and intensity of the starburst event, optical depth, etc.) Figure 1.ALMA imaging of the[CII] 158 μm and underlying dust continuum emission in PJ308–21. Moment 0 (top left panel), 1 (top right panel), and 2 (bottom left panel) maps of the (continuum-subtracted) [CII] line. The bulk of the [CII] emission arises along the north–south direction, which is spatially consistent with the quasar(labeled Q). Additionally, two blobs on the western and eastern sides are also apparent (labeled W and E). A similar morphology is apparent in the dust continuum emission(bottom panel). The [CII] intensity contours (at 0.04, 0.08, 0.16, 0.32, and 0.64 Jy km s−1beam−1), the beam size, and the equivalent physical scale are shown for comparison in all panels.
might alter the emerging intensity of the[CII] for a given gas
mass. This yields[CII]-based gas masses of Mgas=(13.9, 5.1,
2.7)×1010 M for the Q, E, and W, respectively—roughly three times larger than our Mgas
lim
lower limits derived fromfirst principles.
From the dust continuum images, we measure continuum flux densities of F1.1mm=1.01, 0.19, and 0.13 mJy for Q, E, and W, respectively. Assuming that the dust emission can be described by a modified blackbody with fixed dust emissivity, β=1.6 (see, e.g., Beelen et al. 2006), these flux densities
correspond to IR luminosities (integrated between 8 and 1000 mm) of (1.3–2.6)×1012 L, (2.8–5.4)×1011 L, and (1.5–3.0)×1011L
for the three components, where the range refers to dust temperatures spanning between 35 and 45 K. Under the assumption that the dust is optically thin, and following the normalization by Dunne et al.(2000), we derive
dust masses of (1.4−2.6)×108, (2.1−4.4)×107, and (1.5−3.1)×107M
for Q, E, and W, respectively. We note that a typical gas-to-dust ratio of 100 (e.g., Berta et al.2016)
would yield a significantly lower gas mass than those based on
[CII] derived via the Zanella et al. (2018) calibration, which is
possibly due to the caveats in the adoption of a single value for α[CII]and due to the limited surface brightness sensitivity of our observations. As no spatially resolved constrain on Tdustis available, in the following, we assume Tdust=35 K every-where in the system.
The [CII]/IR luminosity ratio is a commonly used
interstellar medium (ISM) diagnostic, with values around 3×10⁻³ for local star-forming galaxies and <3×10⁻⁴ in compact starbursts and ultraluminous infrared galaxies (e.g., Herrera-Camus et al. 2015; Díaz-Santos et al. 2017). The
[CII]/IR ratio in PJ308–21 shows a wide range of [CII]/IR
values down to 3×10⁻⁴ close to the quasar location. Once averaged over the apertures shown in Figures2–3, the[CII]/IR
in Q is 3.5×10⁻³, i.e., 2×lower than in E and W (see Figure4). For a higher Tdust=45 K in the regions close to the quasar, where the gas and star formation surface densities are highest(see below), the [CII]/IR luminosity ratio drops by a
Figure 2.Gas velocity structure in PJ308–21, as mapped by ALMA imaging of the [CII] 158 μm line. Top: 3D (R.A., decl., and Δv) renderings of the continuum-subtracted [CII] emission (the first one being equivalent to the [CII] map shown on the left), showing the complex morphology and dynamics in the system. The three components of PJ308–21 are marked in green, cyan, and red. Bottom: position–velocity diagrams extracted along the main axes of each component(shown as bars in the velocity field map of Figure1), as well
as from a 3″ wide slit along the west–east direction that encapsulates the entire system.
Figure 3. HSTimaging of PJ308–21. Top: the observed quasar+host galaxy emission(left) and the PSF model (right). The ellipses mark the apertures used to define the three components discussed in this analysis. Bottom: residuals after PSF subtraction. We observe extended emission stretching well beyond the tails of the PSF. A comparison with the[CII] map (contours from Figure1)
reveals spatial coincidence between the [CII] and the starlight emission identified with the HST eastward and westward of the quasar. An additional blob, located northwest to the quasar in the HST image, is also likely associated with the system. On the contrary, the bright source northeast of the quasar is a foreground source(see Farina et al. 2019, in preparation).
factor of ∼2. Table1 summarizes the inferred masses for the three components of the system.
3.3. Star Formation Rate Surface Density
Our HST image of PJ308–21 probes the rest-frame UV starlight from young stars and, therefore, traces the unobscured component of star formation.18 Complementarily, the ALMA dust continuum reveals star formation that is enshrouded by dust. The combination of the two is thus a proxy of the total star formation in this system. After PSF subtraction of the HST image, and after masking the central 2.5 kpc(≈0 5, dominated by residuals; this area is also the most sensitive to color terms in the PSF model), we measure F140W magnitudes of 25.33, 25.17, and 24.44 mag for Q, E, and W, yielding a rest-frame UV luminosity of logνLν(1900 Å) [L]=10.82, 10.88, and 11.17, respectively. By construction, this is only a lower limit on the UV emission of Q, due to the uncertainties in removing the nuclear emission and the masking of the central pixels. Following Kennicutt & Evans (2012), these luminosities
translate into UV-based star formation rates(SFRs) of 11, 13, and 25 Myr−1, respectively. The obscured SFRs are derived from IR luminosities following Kennicutt & Evans (2012):
290, 60, and 32 Myr−1 for Q, E, and W, assuming
Tdust=35 K. For Tdust=45 K, our estimates of the IR-based SFRs would roughly double.
The IR-to-UV luminosity ratio, or “IR excess” (IRX), is a proxy of the relevance of obscured-to-unobscured SFR and can be used to study dust reddening at high z(e.g., Whitaker et al.
2014; Bouwens et al.2016; Wang et al. 2018). We find that
both E and W have IRX values consistent with those of typical low-extinction high-z galaxies (Whitaker et al. 2014; see Figure4 and Table1).
We estimate the SFR surface density, ΣSFR, from the full-resolution IR- and UV-based SFRs. Wefind the highest value of ΣSFR=14 Myr−1kpc−2 (set by the 4.0 kpc2 area of the ALMA beam in our observations) for the IR-based SFR at the position of the quasar. This is well below the Eddington limit (∼1000 Myr−1kpc−2; see, e.g., Walter et al. 2009; Hodge et al.2015) even if we assume a modest IRX≈1 to account
for the(unconstrained) contribution of the unobscured SFR at this position or for a higher Tdust. However, we stress that these estimates are based on average emission over relatively large apertures(a few kpc2in area), and much higher values could be in place on local scales.
In Figure 4 (right panel), we compare the average ΣSFR values estimated over the apertures shown in Figures2–3with the gas surface density derived from [CII] and Σgas via the Zanella et al.(2018) calibration. We find that SSFRandΣgasin PJ308–21 are in line with the values typically observed in global observations of main-sequence galaxies at z=1–3 (Tacconi et al.2013) and are significantly lower than the values
observed in intense starbursts and submillimeter galaxies at high redshifts(e.g., Hodge et al.2015; Chen et al.2017). The
average depletion time in the system is ∼1 Gyr; i.e., if no significant gas accretion occurs, this system is expected to run out of fuel for star formation by z∼4.
3.4. Dynamics of the System
The morphology and the complex velocity structure observed in PJ308–21 (see Figure2) appear inconsistent with
Figure 4.ISM and SFR diagnostics in PJ308–21. Left: IR, UV, and [CII] luminosities and their ratios in Q, E, and W, derived from the apertures shown in Figure 3. The values derived for both the quasar host galaxy and the companion blobs are comparable to those in typical star-forming high-redshift galaxies. Right: the star formation vs. gas surface density, or“star formation law” in Q, E, and W. SFRs from UV (squares) and IR (triangles) are shown as a function of gas surface densities derived based on the Zanella et al.(2018)
calibration from[CII]. The loci at constant depletion times are shown, as well as the range of values observed in submillimeter galaxies, in local spirals, and in global measurements of main-sequence galaxies (see, e.g., Hodge et al.2015). All the components of PJ308–21 appear in line with the typical
values of main-sequence galaxies at high redshift.
Table 1
Summary of the Observed Properties of the Quasar Host(Q) and the Eastern (E) and Western (W) Components
Q E W Δv [km s−1] L +500 −750 F[CII][Jy km s−1] 4.7 1.7 0.9 Fν(158 μm) [mJy] 1.18 0.25 0.13 F140W[mag] 25.33 25.17 24.44 log L[CII][L] 9.67 9.23 8.96 log LIR(T=35 K) [L] 12.12 11.44 11.17 log LUV[L] > 10.82 10.88 11.17 log L[CII]/LIR −2.46 −2.21 −2.21 log IRX 1.31 0.56 0.00
log Mgasmin [M] 10.67 10.24 9.97
log Mgas[M] 11.14 10.71 10.43 log Mdust[M] 8.15 7.32 7.18 log SFRUV[Myr−1] > 1.05 1.12 1.41 log SFRIR[Myr−1] 2.30 1.62 1.34 log SSFR,UV[Myr−1kpc−2] >−1.11 −0.90 −0.47 logΣSFR,IR[Myr−1kpc−2] 0.14 −0.40 −0.53 Note.Errors in the measured fluxes are of the order of 10% and are most sensitive on the exact shape of the adopted apertures.
18
The diffuse rest-frame UV emission observed with the HST can also be attributed(at least in part) to dust-scattered light from the quasar itself (see, e.g., Zakamska et al.2006). At present, we cannot unambiguously distinguish
between the two scenarios; however, we point out that the UV-brightest knots in E, W, and in the northwest component are associated with relatively lower dust surface brightness, which is contrary to a simple reflection scenario. We will ignore the impact of reflected light in the remainder of our analysis.
an interpretation in terms of gas expanding from the center outward in response to the feedback from the quasar. In particular, the opposite signs of the projected velocity and velocity gradients in E and W, as well as the low gas velocity dispersion in E(100 km s−1along the line of sight, compared to>700 km s−1values associated with outflows in, e.g., J1152 +5251 by Cicone et al. 2015) defy basic expectations for an
outflow scenario.
Conversely, in this section, we test whether a toy model of the tidal disruption of a single satellite galaxy in close interaction with the quasar host can account for the observed gas dynamics in PJ308–21. This simplistic approach is not a fit to the data but is rather a proof of concept that the tidal disruption scenario works for this system. Specifically, we test whether the proposed dynamical description of PJ308–21 succeeds in predicting the observed range of the line-of-sight gas velocity and the spatial extent of PJ308–21.
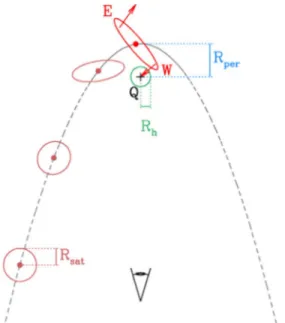
Strong tidal perturbations should arise when the mass ratio between the satellite and the host isMsat Mhost<(Rsat Rperi) ,3 where Rsat is the satellite’s scale size, and Rperi is the orbital pericenter. In this regime, both the velocity gradient and the spatial stretch observed between E and W would be due to the tidal interaction with Q. We sketch a cartoon of the model in Figure5.
We assume a parabolic, highly eccentric orbit. We also postulate that our observations have caught the satellite close to the pericenter, as suggested by the high magnitudes and different signs of the line-of-sight velocities of E and W. Thus, the current satellite velocity(vsat,peri) equals the escape velocity:
f
» =
vsat,peri vesc 2 (Rperi) . The potential of the host,19f, at a distance, R, is the sum of the baryonic potential,
fbar = G Mhost,bar R, and of the Navarro–Frenk–White profile
DM potential, fDM, which can be expressed in terms of the enclosed mass, Mhost,DM(< R), and scale radius, Rh, as:
f = < - + + -R G RM R R R R R R 1 ln 1 . 2 h h DM host,DM 1 ⎡ ⎣ ⎢ ⎤⎦⎥ ( ) ( ) ( ) ( ) ( )
The enclosed dark matter (DM) mass is estimated from the observed velocity curve of the primary galaxy, Q:
a
< =
-M R v R
G M , 3
host,DM host, circ 2
host,bar
( ) ( ) ( )
where vhost,circ is the observed circular velocity and α 1 is used to account for possible observational underestimates due to, e.g., beam smearing and line-of-sight projection(see, e.g., Lupi et al.2019). The DM mass fraction within R (compared to
the total) is < = + - + + - + M R M R R R R R c c c ln 1 ln 1 1 , 4 h h host,DM host,DM ( ) ( ) ( ) ( ) ( ) ( )
where c=Rvir/Rhis the concentration parameter of the halo, Rviris its virial radius, and we assume c=10.
Under these assumptions, the escape velocity is fully determined by a combination of Mhost, Rperi, Rh, and α. Figure6 shows the parameter combinations that yield escape velocities are in broad agreement with the observed velocity differences between Q, E, and W. We only consider cases that yield a total DM-to-baryon mass ratio of the quasar host 3<Mhost,DM/Mhost,bar<30.
Figure 5. Sketch of the toy model. The satellite galaxy(dots with ellipses) approaches the quasar host galaxy(Q, marked by a+, with a scale radius, Rh) via a highly eccentric parabolic orbit (gray dashed line). The system is observed when the satellite is close to the pericenter(Rper). The satellite is tidally stretched along its course, thus leading to the wide range of projected velocities and the spatial extent between the eastern and western wings of the satellite(E and W). We stress that this cartoon is not in scale.
Figure 6.Maps of escape velocity vesc(Rperi) as function of Rperiand Rhforα vhost,circ(Rperi)=200 km s−1 (left) or 400 km s−1 (right) and for a baryonic mass of the quasar host within the pericenter, Mhost, bar(< Rperi), that is equal to (0.1, 0.5, 1)×1011M(top to bottom). The observed kinematics in PJ308–21 appear consistent with the tidal interaction of a single satellite galaxy by the more massive quasar host galaxy, within a broad range of input parameters. No solution consistent with the expected range of vescis found forα=1 and
< =
Mhost,bar( Rperi) 1011M, since such a mass would imply a larger circular velocity.
19
Here, we implicitly assume spherical symmetry, although the estimate of the escape velocity is insensitive to changes in the axis ratio.
We can now use the subset of input parameter values that yield an escape velocity consistent with the observations to infer the expected spatial stretch of the satellite. Using Equation(4), we can infer the mass ratio between the innermost
and outer parts of the satellite close to the pericenter. This is then used to infer the relative velocity of the two sides of the galaxy, Δv, via Equations (2) and (3). The timescale of the
interaction is set by Δt=Rperi/vperi. The resulting spatial stretch is thusΔR≈ΔvΔt. This scaling successfully explains the size of PJ308–21; e.g., if we assume Rper=10 kpc, an initial satellite radius of Rsat=5 kpc, a scale radius of the quasar host of Rh=3 kpc, α=2, and a host mass of 10
11
M, we obtainΔv≈240 km s−1,Δt≈45 Myr, and a major semi-axis of the satellite ofΔR≈11 kpc.
A single satellite scenario is thus consistent with the observations, either requiring a very diffuse secondary scattering onto a more massive primary or a more compact secondary undergoing a close flyby (down to Rperi≈ 1 kpc). Such a scenario naturally accounts for the low velocity dispersion of[CII] in E (the main tidal feature) and the higher
value in W(as the tidal disruption creates a bridge between the satellite and the quasar host that is roughly aligned with the line of sight). A primary baryonic mass of Mhost,bar>1011Mdoes not result in any solution consistent with the data if the observed velocity along the line of sight is used as a good proxy for the circular velocity. Although this can hint to a possible tension between the dynamical constraints and the [CII]-based estimate of the gas mass, we stress that small
variations of the model, e.g., including non-rotational compo-nents in the quasar host(e.g., Lupi et al.2019), the rotation of
the secondary before the pericenter, or gas-dynamical effects in close peri-passages (Barnes 2002; Capelo & Dotti 2017; Blumenthal & Barnes2018) could modify the gas velocity map
by up to∼100 km s−1, allowing for a slightly larger baryonic mass of the primary.
4. Discussion and Conclusions
We present new kiloparsec-scale ALMA and HST imaging of the quasar PJ308–21 at z=6.2342. We find extended emission from young stars, dust, and gas(traced via the [CII]
158μm line) stretching both eastward and westward of the quasar host for a total projected extent exceeding 20 kpc. The system has a complex velocity structure covering>500 km s−1 both blue- and redward of the quasar systemic redshift. The close morphological match between rest-frame UV light, dust, and [CII]-traced gas unambiguously associates the extended
emission with the immediate environment of the quasar and rules out a foreground projected object. The morphology, size, velocity, and velocity dispersion structure of the system are reminiscent of local gas-rich mergers (e.g., Tacconi et al.
1999). The luminosities of all the components, and their ratios,
are consistent with values typically observed in high-redshift galaxies and do not seem to reproduce the shock-heated values observed in outflows or in shock fronts (e.g., L[CII]/LIR> 0.01; see Appleton et al. 2013). We demonstrate that the observed
velocity range and spatial extent can be accounted for by a simple model of a tidally disrupted satellite galaxy in close encounter with the quasar host galaxy.
In summary, PJ308–21 is one of the earliest mergers imaged (in terms of cosmic time) and represents a unique laboratory to study the assembly of massive galaxies at cosmic dawn. The quasar host galaxy and its surroundings are natural test cases
for studies of other ISM tracers(e.g., molecular lines, such as CO or H2O, far-IR fine structure lines, and dust continuum) using ALMA. Moreover, this system is thefirst, unambiguous example of a merging quasar host galaxy at z>6, and the first case of a quasar host galaxy stellar light detected in its rest-frame UV emission at these redshifts. This makes PJ308–21 a prime target for investigations with the James Webb Space Telescope, which will enable a direct measurement of the already assembled stellar mass of this unique system.
We thank the referee for their excellent feedback on the manuscript. We thank the ALMA Director for granting time for the DDT observations presented here. F.W., Ml.N., Ma.N., and B.P.V. acknowledge support from the ERC Advancedgrant 740246 (Cosmic_Gas). D.R. acknowledges support from the National Science Foundation under grant No. AST-1614213.
Facilities: ALMA data: 2015.1.01115.S and 2016.A.00018. S. ALMA is a partnership of ESO (representing its member states), NSF (USA) and NINS (Japan), together with NRC (Canada), NSC and ASIAA (Taiwan), and KASI (Republic of Korea), in cooperation with the Republic of Chile. The Joint ALMA Observatory is operated by ESO, AUI/NRAO, NAOJ, and HST: based on observations made with the NASA/ESA Hubble Space Telescope, obtained from the Data Archive at the Space Telescope Science Institute, which is operated by the Association of Universities for Research in Astronomy, Inc., under NASA contract NAS 5-26555. These observations are associated with program 14876. Support for this work was provided by NASA through grant No. 10747 from the Space Telescope Science Institute, which is operated by AURA, Inc., under NASA contract NAS 5-26555.
ORCID iDs
Roberto Decarli https://orcid.org/0000-0002-2662-8803
Eduardo Bañados https://orcid.org/0000-0002-2931-7824
Emanuele Paolo Farina https: //orcid.org/0000-0002-6822-2254
Fabian Walter https://orcid.org/0000-0003-4793-7880
Chris Carilli https://orcid.org/0000-0001-6647-3861
Xiaohui Fan https://orcid.org/0000-0003-3310-0131
Chiara Mazzucchelli https: //orcid.org/0000-0002-5941-5214
Marcel Neeleman https://orcid.org/0000-0002-9838-8191
Dominik Riechers https://orcid.org/0000-0001-9585-1462
Michael A. Strauss https://orcid.org/0000-0002-0106-7755
Bram P. Venemans https://orcid.org/0000-0001-9024-8322
Yujin Yang https://orcid.org/0000-0003-3078-2763
Ran Wang https://orcid.org/0000-0003-4956-5742
References
Angulo, R. E., Springel, V., White, S. D. M., et al. 2012,MNRAS,426, 2046
Appleton, P. N., Guillard, P., Boulanger, F., et al. 2013,ApJ,777, 66
Asplund, M., Grevesse, N., Sauval, A. J., & Scott, P. 2009,ARA&A,47, 481
Balmaverde, B., Gilli, R., Mignoli, M., et al. 2017,A&A,606, 23
Bañados, E., Venemans, B. P., Decarli, R., et al. 2016,ApJS,227, 11
Bañados, E., Venemans, B. P., Mazzucchelli, C., et al. 2018,Natur,553, 473
Barnes, J. E. 2002,MNRAS,333, 481
Beelen, A., Cox, P., Benford, D. J., et al. 2006,ApJ,642, 694
Berta, S., Lutz, D., Genzel, R., et al. 2016,A&A,587, A73
Blumenthal, K. A., & Barnes, J. E. 2018,MNRAS,479, 3952
Bouwens, R. J., Aravena, M., Decarli, R., et al. 2016,ApJ,833, 72
Capelo, P. R., & Dotti, M. 2017,MNRAS,465, 2643
Carilli, C. L., & Walter, F. 2013,ARA&A,51, 105
Chen, C.-C., Hodge, J. A., Smail, I., et al. 2017,ApJ,846, 108
Cicone, C., Maiolino, R., Gallerani, S., et al. 2015,A&A,574, A14
Davies, F. B., Hennawi, J. F., Bañados, E., et al. 2018,ApJ,864, 142
Decarli, R., Walter, F., Venemans, B. P., et al. 2017,Natur,545, 457
Decarli, R., Walter, F., Venemans, B. P., et al. 2018,ApJ,854, 97
Decarli, R., Walter, F., Yang, Y., et al. 2012,ApJ,756, 150
Díaz-Santos, T., Armus, L., Charmandaris, V., et al. 2017,ApJ,846, 32
Díaz-Santos, T., Assef, R. J., Blain, A. W., et al. 2018,Sci,362, 1034
Dunne, L., Eales, S., Edmunds, M., et al. 2000,MNRAS,315, 115
Farina, E. P., Venemans, B. P., Decarli, R., et al. 2017,ApJ,848, 78
Herrera-Camus, R., Bolatto, A. D., Wolfire, M. G., et al. 2015,ApJ,800, 1
Hodge, J. A., Riechers, D., Decarli, R., et al. 2015,ApJL,798, L18
Jones, G. C., Willott, C. J., Carilli, C. L., et al. 2017,ApJ,845, 175
Kennicutt, R. C., & Evans, N. J. 2012,ARA&A,50, 531
Lupi, A., Volonteri, M., Decarli, R., et al. 2019, arXiv:1901.02464
Mazzucchelli, C., Bañados, E., Venemans, B. P., et al. 2017,ApJ,849, 91
McGreer, I. D., Fan, X., Strauss, M. A., et al. 2014,AJ,148, 73
McMullin, J. P., Waters, B., Schiebel, D., Young, W., & Golap, K. 2007, in ASP Conf. Ser. 376, Astronomical Data Analysis Software and Systems XVI, ed. R. A. Shaw, F. Hill, & D. J. Bell(San Francisco, CA: ASP),127
Meijerink, R., Spaans, M., & Israel, F. P. 2007,A&A,461, 793
Neeleman, M., Banados, E., Walter, F., et al. 2019, arXiv:1907.02536
Peng, C. Y., Impey, C. D., Rix, H.-W., et al. 2006,ApJ,649, 616
Planck Collaboration, Ade, P. A. R., Aghanim, N., et al. 2016,A&A,594, A13
Stiavelli, M., Djorgovski, S. G., Pavlovsky, C., et al. 2005,ApJL,622, L1
Tacconi, L. J., Genzel, R., Tecza, M., et al. 1999,ApJ,524, 732
Tacconi, L. J., Neri, R., Genzel, R., et al. 2013,ApJ,768, 74
Trakhtenbrot, B., Lira, P., Netzer, H., et al. 2017,ApJ,836, 8
Venemans, B. P., Decarli, R., Walter, F., et al. 2018,ApJ,866, 159
Venemans, B. P., Walter, F., Decarli, R., et al. 2017,ApJL,851, L8
Volonteri, M. 2012,Sci,337, 544
Walter, F., Riechers, D., Cox, P., et al. 2009,Natur,457, 699
Wang, W., Kassin, S. A., Pacifici, C., et al. 2018,ApJ,869, 161
Whitaker, K. E., Franx, M., Leja, J., et al. 2014,ApJ,795, 104
Willott, C. J., Bergeron, J., & Omont, A. 2017,ApJ,850, 108
Zakamska, N. L., Strauss, M. A., Krolik, J. H., et al. 2006,AJ,132, 1496
Zanella, A., Daddi, E., Magdis, G., et al. 2018,MNRAS,481, 1976
![Figure 1. ALMA imaging of the [C II ] 158 μm and underlying dust continuum emission in PJ308–21](https://thumb-eu.123doks.com/thumbv2/123dokorg/8099632.124882/4.918.98.822.78.530/figure-alma-imaging-ii-underlying-dust-continuum-emission.webp)
![Figure 4. ISM and SFR diagnostics in PJ308–21. Left: IR, UV, and [C II ] luminosities and their ratios in Q, E, and W, derived from the apertures shown in Figure 3](https://thumb-eu.123doks.com/thumbv2/123dokorg/8099632.124882/6.918.72.440.75.419/figure-diagnostics-left-luminosities-ratios-derived-apertures-figure.webp)