Efficacy of etravirine combined with darunavir or other
ritonavir-boosted protease inhibitors in HIV-1-infected
patients: an observational study using pooled European
cohort data*
J Vingerhoets,1 V Calvez,2 P Flandre,2 A-G Marcelin,2 F Ceccherini-Silberstein,3 C-F Perno,3 M Mercedes Santoro,3 R Bateson,4 M Nelson,4 A Cozzi-Lepri,5 J Grarup,5 J Lundgren,5 F Incardona,6 R Kaiser,7 A Sonnerborg,8 B Clotet,9 R Paredes,9 HF Günthard,10 B Ledergerber,10 A Hoogstoel,1 S Nijs,1 L Tambuyzer,1 L Lavreys1 and M Opsomer1 on behalf of the Etravirine Cohort Study Group1Janssen Infectious Diseases BVBA, Beerse, Belgium,2ANRS/INSERM, UPMC University of Paris 06, UMR_S 1136, The Pierre Louis Institute of Epidemiology and Public Health, F-75013, University of Sorbonne, Paris, France,3Tor Vergata University, Rome, Italy,4St Stephen’s Centre, Chelsea & Westminster Hospital, London, UK,5EuroSIDA, Copenhagen, Denmark,6Informa s.r.l., EuResist Network GEIE, Rome, Italy,7Institute of Virology, EUResist Network GEIE, University of Cologne, Cologne, Germany,8Karolinska Institute, EUResist Network GEIE, Stockholm, Sweden,9Fight Against AIDS Foundation, Barcelona, Spain and10Swiss HIV Cohort Study, Division of Infectious Diseases and Hospital Epidemiology, University Hospital Zürich, University of Zürich, Zürich, Switzerland
Objectives
This observational study in antiretroviral treatment-experienced, HIV-1-infected adults explored the efficacy of etravirine plus darunavir/ritonavir (DRV group; n = 999) vs. etravirine plus an alternative boosted protease inhibitor (other PI group; n = 116) using pooled European cohort data. Methods
Two international (EuroSIDA; EUResist Network) and five national (France, Italy, Spain, Switzerland and UK) cohorts provided data (collected in 2007–2012). Stratum-adjusted (for confounding factors) Mantel–Haenszel differences in virological responses (viral load< 50 HIV-1 RNA copies/mL) and odds ratios (ORs) with 95% confidence intervals (CIs) were derived.
Results
Baseline characteristics were balanced between groups except for previous use of antiretrovirals (≥ 10: 63% in the DRV group vs. 49% in the other PI group), including previous use of at least three PIs (64% vs. 53%, respectively) and mean number of PI resistance mutations (2.3 vs. 1.9, respectively). Week 24 responses were 73% vs. 75% (observed) and 49% vs. 43% (missing = failure), respectively. Week 48 responses were 75% vs. 73% and 32% vs. 30%, respectively. All 95% CIs around unadjusted and adjusted differences encompassed 0 (difference in responses) or 1 (ORs). While ORs by cohort indicated heterogeneity in response, for pooled data the difference between unadjusted and adjusted for cohort ORs was small.
Conclusions
These data do not indicate a difference in response between the DRV and other PI groups, although caution should be applied given the small size of the other PI group and the lack of randomization. This suggests that the efficacy and virology results from DUET can be extrapolated to a regimen of etravirine with a boosted PI other than darunavir/ritonavir. Keywords: darunavir/ritonavir, efficacy, etravirine, HIV-1, protease inhibitor
Accepted 23 October 2014
Correspondence: Dr Johan Vingerhoets, Turnhoutseweg 30, B-2340, Beerse, Belgium. Tel: 14 641790; fax: 14 602841; e-mail: [email protected] *Data contained in this article were presented at the 14th European AIDS Conference, Brussels, Belgium, 16–19 October 2013 (Abstract PE8/46).
Introduction
Etravirine (ETR) is a nonnucleoside reverse transcriptase inhibitor (NNRTI) with a high intrinsic activity against both wild-type HIV type 1 (HIV-1) and strains harbouring NNRTI and other resistance-associated mutations (RAMs) [1,2]. Conditional marketing authorization in the European Union (EU) was received for ETR in August 2008 [3]. At that time, ETR 200 mg twice daily in combination with a boosted protease inhibitor (PI/r) and other antiretrovirals (ARVs) was indicated for the treatment of HIV-1 infection in ARV treatment-experienced adults. Full marketing authorization in the EU was received for ETR in November 2013. ETR at a bodyweight-determined dose is now also approved for use in paediatric patients≥ 6 years of age who are ARV treatment experienced.
The indication of ETR in treatment-experienced adults is based on the results of the two DUET (TMC125-C206 and TMC125-C216; TMC125 to Demonstrate Undetectable viral load in patients Experienced with ARV Therapy) studies [4–7]. In these randomized, double-blind, placebo-controlled, phase III studies, ETR 200 mg twice daily dem-onstrated durable efficacy and had a similar tolerability profile compared to placebo when both were given with an optimized background regimen (OBR). The OBR included investigator-selected nucleoside reverse transcriptase inhibitors (NRTIs), with or without enfuviritide (ENF) and darunavir/ritonavir (DRV/r) as the only allowed boosted PI. Additional clinical data were requested to determine the efficacy of ETR in combination with boosted PIs other than DRV/r. As a consequence of the limited availability of eligible patients for a prospective clinical study, this obser-vational study was designed to determine if the virological response observed in patients receiving ETR in combina-tion with DRV/r (the DRV group) was comparable to the response in patients receiving ETR and boosted PIs other than DRV/r (the other PI group), using existing cohort data.
Methods
Patient populationThe main inclusion criteria were adult male or female HIV-1-infected patients at the start of treatment with ETR and a background regimen containing a boosted PI with or without NRTIs, ENF, raltegravir (RAL) and/or maraviroc (MVC) and who had a detectable viral load (above the limit of detection of the HIV-1 viral load assay used in the cohort). Patients who had previously failed an NNRTI were allowed. Exclusion criteria included any patients treated with investigational medications, and patients with a back-ground regimen not including a boosted PI.
Study design
This was a phase IV, retrospective observational study to determine if the ARV activity of ETR when combined with ARV background regimens containing DRV/r was compa-rable to the ARV activity of ETR when combined with background ARV regimens containing a boosted PI which is not DRV/r. ARVs were typically used as per local treat-ment guidelines, so for DRV/r, this would probably have been twice daily in line with the prescribing information for treatment-experienced patients. However, these data were not specifically collected. Safety data were also not collected as this was not an objective of this study. Report-ing of serious adverse events durReport-ing prospective patient treatment was the responsibility of the treating physician in accordance with local guidance. The study was con-ducted in accordance with the Declaration of Helsinki, and in compliance with the Guidelines for Good Pharmacoepidemiology Practices [8] and the Strengthening the Reporting of Observational Studies in Epidemiology (STROBE) checklist [9]. Those responsible for each cohort confirmed that they had made all legally required disclo-sures and possessed consents and/or competent institu-tional review board/ethics committee authorizations or permissions to provide the sponsor with the data. Patient confidentiality was maintained at all times.
Prior to the start of the study, all seven eligible cohorts [two international (EuroSIDA and EUResist Network) and five national (France, Italy, Spain, Switzerland and UK)] were given a data availability questionnaire to assess their suitability for meeting the study objectives. The feedback from the questionnaire was used to determine sample size estimates (data from 250 patients were expected in the other PI group, while 1500 patients were expected in the DRV group).
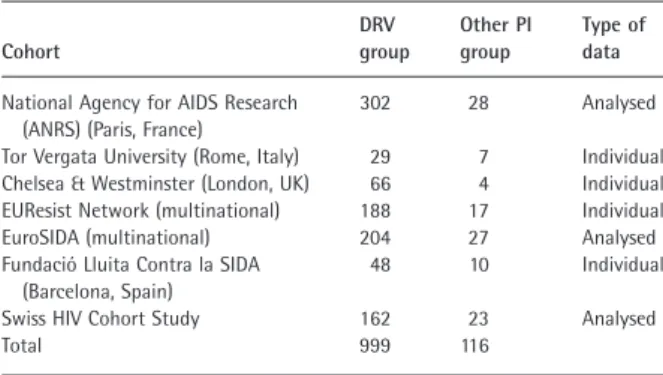
Each cohort provided its data in one of two ways: in the first scenario, ‘individual de-identified’ individual patient data were provided, allowing the sponsor to perform the analysis; in the second scenario, the cohort provided ana-lysed data, with the analysis being conducted by one of the cohort’s representatives (see Table 1 for more details). In both cases, the same pre-specified statistical analysis plan was used. The primary analysis of this study is on the pooled data set.
Data analyses
Efficacy evaluations
The virological response rate in the current study, defined as the proportion of patients who had a plasma viral load < 50 HIV-1 RNA copies/mL, based on observed and missing = failure (M=F) imputed data was compared for the
DRV group vs. the other PI group at weeks 12, 24, 48 and 96 from starting the ETR-based regimen.
The observed virological response is based on a denomi-nator of only patients with available viral load data. Patients contributing data at one time-point were not nec-essarily contributing to the data at any other time-points. The M=F-imputed virological response is based on a denominator of all patients within a given treatment group or subgroup. Any patients with missing viral load data at a specific time-point were considered nonresponders at that time-point. Although data were collected at four time-points, the subanalyses on virological response rates by baseline genotypic sensitivity score (GSS) and ETR weighted genotypic score (WGS) focus on weeks 12 and 24, given the low number of patients for the observed analysis at later time-points. The virological failure (VF) rate was defined as the percentage of patients either with a viral load> 50 copies/mL or who had stopped ETR prior to the considered time-point for reasons other than an adverse event and with a last viral load> 50 copies/mL.
The GSS was defined as the number of sensitive ARV drugs in the background regimen at baseline, as deter-mined by genotype and calculated by summing the scores for each ARV used. ETR was excluded from the GSS cal-culation. For PIs and NRTIs, the GSS was calculated based on the National Agency for AIDS Research (ANRS) HIV-1 genotypic drug resistance interpretation algorithm [10]. A PI or NRTI with a score of 0 means that the mutations detected confer genotypic resistance to that PI/NRTI; a score of 0.5 indicates possible genotypic resistance, and a score of 1 indicates that the virus is sensitive. Because of the lack of genotypic data in regions outside of the reverse transcriptase and protease domains, ENF, RAL and MVC were counted as sensitive (scored as 1) if not used previously.
The ETR WGS was calculated by adding together the individual weight factors for each ETR RAM from a list of
20 ETR RAMs [11,12]. A score of 0–2 is associated with a high virological response, 2.5–3.5 with an intermediate response and≥4 with a reduced response [11]. Although ETR activity was not assessed using the ANRS algorithm used for the other ARVs, the ETR WGS was shown to provide similar results compared to the ANRS score [13].
Statistical evaluations
To account for the impact of potential prognostic factors, differences in response rates [and odds ratios (ORs)] were calculated, together with their 95% confidence intervals (CIs). These were adjusted for confounding factors: cohort of enrolment, drugs in the background regimen, baseline viral load, baseline GSS and ETR WGS. For each prognostic factor, response rates were determined within different strata and observed differences in response rates between the two groups were weighted according to the size of the strata (stratum-adjusted Mantel–Haenszel proportions). This resulted in an overall adjusted difference in response rates (and OR) giving more importance to differences observed in larger strata. Heterogeneity in virological response rates between the different cohorts was deter-mined using Zelen’s exact test of homogeneity of ORs.
The observed change from baseline in CD4 cell count (cells/μL) was analysed descriptively at weeks 12, 24, 48 and 96.
Results
Patient disposition and baseline characteristics
Data were retrieved and pooled for 1115 HIV-1-infected patients within a time period from 2007 to 2012 (999 patients in the DRV group and 116 patients in the other PI group). Three of the seven cohorts transferred analysed data (Table 1).
The demographic and baseline disease characteristics were generally balanced between the DRV group and the other PI group (Table 2). The mean (standard deviation [SD]) age of the patients overall was 46.2 (9.03) years, and the majority were male (79%) and/or white (77%). The mean (SD) time since HIV diagnosis was 15.4 (5.9) years.
Sixty-two per cent of all patients had previously used≥ 10 ARVs, but more patients in the DRV group than in the other PI group were PI treatment experienced, with 64% and 53% of patients, respectively, having previously used at least three PIs. A higher proportion of patients in the DRV group than in the other PI group had previously used ENF (Table 2).
At baseline, the proportion of patients with GSS> 2 was 29% in the DRV group and 24% in the other PI group. The proportion of patients who had a sensitive ETR WGS was 72% vs. 75%, respectively.
Table 1 Patient numbers by cohort
Cohort DRV group Other PI group Type of data
National Agency for AIDS Research (ANRS) (Paris, France)
302 28 Analysed
Tor Vergata University (Rome, Italy) 29 7 Individual Chelsea & Westminster (London, UK) 66 4 Individual EUResist Network (multinational) 188 17 Individual EuroSIDA (multinational) 204 27 Analysed Fundació Lluita Contra la SIDA
(Barcelona, Spain)
48 10 Individual
Swiss HIV Cohort Study 162 23 Analysed
Total 999 116
Sixty-seven per cent of patients (670 of 999) in the DRV group and 47% of patients in the other PI group (55 of 116) received RAL or ENF/MVC. The proportion of patients who also used an NRTI(s) in their background regimen was 58% (583 of 999) in the DRV group and 68% (79 of 116)
in the other PI group. The proportion of patients in the other PI group who received lopinavir/ritonavir (LPV/r) was 65.5% (76 of 116), with 24% (28 of 116) receiving atazanavir/ritonavir (ATV/r). Other boosted PIs (amprenavir, fosamprenavir, indinavir, saquinavir and tipranavir) were used by fewer than 10 patients.
Efficacy
Virological response
Virological response rates are presented in Fig. 1, which shows results of both the observed method and the M=F imputation. Virological response rates were comparable between treatment groups based on both methods. Observed virological response rates were higher at week 24 (73% of 662 patients with viral load data available in the DRV group
vs. 75% of 67 patients in the other PI group), week 48 (75%
of 422 patients vs. 73% of 48 patients, respectively) and week 96 (80% of 265 patients vs. 73% of 33 patients, respectively) than at week 12 (65% of 741 patients vs. 68% of 75 patients, respectively). M=F-imputed responses were lower at later time-points than at weeks 12 and 24 (Fig. 1). However, week 96 results must be interpreted with caution because of the small sample size of the other PI group.
The virological failure rate was 29% of 999 patients in the DRV group and 28% of 116 patients in the other PI group at week 12. Corresponding figures were 22% and 25%, respectively, at week 24 and 17% and 26%, respec-tively, at week 48.
Stratum-adjusted Mantel–Haenszel differences in response rates
Stratum-adjusted differences in response rates are shown in Table 3. There were no significant differences between treatment groups at weeks 12 and 24 in M=F-imputed and observed virological response rates. All 95% CIs around the unadjusted and adjusted differences encompassed 0 for the difference in response rates and encompassed 1 for ORs. ORs by cohort indicated heterogeneity in virological response rates between the different cohorts (Fig. 2) (P value = 0.0353 from Zelen’s exact test of homogeneity of ORs, for week 24 observed data). The net effect on the overall pooled result, however, was small. Data presented in Table 3 show that the unadjusted ORs and those adjusted for cohort were similar.
Virological response by baseline resistance
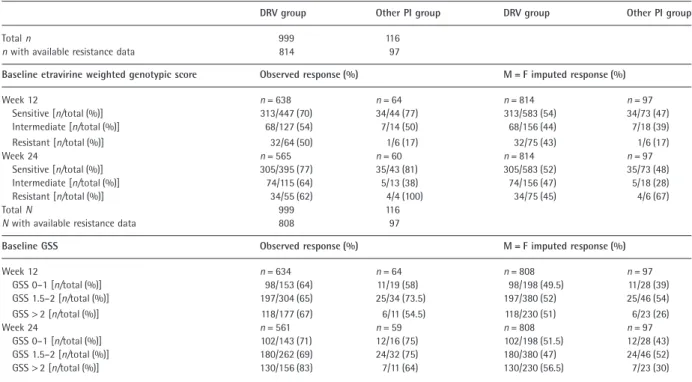
Virological response rates at weeks 12 and 24 were similar in the two treatment groups in patients with a sensitive baseline ETR WGS (Table 4). The results of the comparison between treatment groups using M=F-imputed data were consistent with those using observed data. Taking the low
Table 2 Baseline demographics and disease characteristics
DRV group (n = 999) Other PI group (n = 116) Baseline demographics Age (years) n = 697 n = 88 Mean (SD) 46.6 (9.1) 43.5 (8.6) Sex [n (%)] n = 997 n = 116 Male 800 (80) 79 (68) Race [n (%)] n = 585 n = 76 Asian 9 (2) 0 (0) Black 79 (14) 14 (18) Hispanic 11 (2) 1 (1) White 459 (78) 53 (70) Other 27 (5) 8 (11) Disease characteristics
Baseline viral load (log10copies/mL) n = 997 n = 116
Mean (SD) 3.8 (1.1) 3.7 (1.1)
Baseline CD4 count (cells/μL) n = 987 n = 115
Mean (SD) 299 (245) 305 (183)
Duration of HIV infection (years) n = 513 n = 63
Mean (SD) 15.7 (5.9) 13.4 (5.3)
Previously used ARVs [n (%)]
Any ARV n = 994 n = 115 <4 96 (10) 13 (11) 4–9 269 (27) 46 (40) ≥10 629 (63) 56 (49) PIs n = 999 n = 116 <3 357 (36) 54 (47) 3–5 434 (43) 39 (34) >5 208 (21) 23 (20) Other ARVs n = 999 n = 116 ENF 285 (29) 22 (19) RAL 105 (11) 9 (8) MVC 23 (2) 2 (2)
Mean (SD) number of RAMs n = 828 n = 97
IAS-USA NRTI RAMs [14] 3.6 (2.3) 3.1 (2.2) NNRTI RAMs [15] 1.7 (1.7) 1.6 (1.5) ETR RAMs [11,12] 0.8 (1.0) 0.7 (0.9) IAS-USA primary PI RAMs [14] 2.3 (1.9) 1.9 (1.8) IAS-USA DRV RAMs [14] 1.2 (1.4) 1.3 (1.2) IAS-USA LPV RAMs [14] 5.0 (3.4) 3.7 (2.9) IAS-USA ATV RAMs [14] 6.5 (4.1) 5.1 (3.6)
GSS [10] [n (%)] n = 822 n = 97 >2 236 (29) 23 (24) 1.5–2 382 (46) 46 (47) 0–1 204 (25) 28 (29) ETR WGS [11,12] Sensitive 589 (72) 73 (75) Intermediate 156 (19) 18 (19) Resistant 77 (9) 6 (6)
DRV, darunavir; PI, protease inhibitor; ARV, antiretroviral; SD, standard deviation; ENF, enfuviritide; RAL, raltegravir; MVC, maraviroc; IAS-USA, International AIDS Society USA; NRTI, nucleoside reverse transcriptase inhibitor; NNRTI, nonnucleoside reverse transcriptase inhibitor; ETR, etravirine; RAM, resistance-associated mutation; LPV, lopinavir; ATV, atazanavir; GSS, genotype sensitivity score; WGS, weighted genotypic score.
number of patients with a resistant ETR WGS into consid-eration, virological response rates appeared higher in patients with a sensitive ETR WGS than in patients with a resistant ETR WGS in both treatment groups.
Baseline GSS appeared to have little influence on the observed virological response. Only small differences in the proportion of responders according to baseline GSS were observed (especially for the categories GSS 0–1 and 1.5–2).
Fig. 1 Virological response rates at weeks 12, 24, 48 and 96. DRV, darunavir; PI, protease inhibitor; M = F, missing = failure; CI, confidence interval.
Table 3 Stratum-adjusted differences in response rates at weeks 12, 24, 48 and 96
Difference* in response rates [% (95% CI)] Odds ratio†(95% CI)
Observed M = F imputed Observed M = F imputed
Week 12
Unadjusted difference 2.8 (−8.4–14.0) −4.4 (−14.0–5.2) 1.14 (0.68–1.89) 0.84 (0.57–1.23) Difference adjusted for
Cohort 2.3 (−9.0–13.6) −3.8 (−13.1–5.4) 1.11 (0.66–1.85) 0.85 (0.57–1.27)
Background regimen 4.4 (−6.3–15.1) −1.3 (−10.4–7.9) 1.24 (0.73–2.11) 0.95 (0.63–1.42) Baseline viral load 1.6 (−9.5–12.8) −4.3 (−13.9–5.3) 1.08 (0.64–1.81) 0.84 (0.57–1.24) Baseline GSS 0.6 (−11.8–13.1) −7.8 (−18.2–2.6) 1.03 (0.60–1.77) 0.73 (0.48–1.12) Baseline etravirine WGS [11,12] 0.9 (−10.7–12.6) −8.0 (−18.5,−2.5) 1.04 (0.60–1.83) 0.72 (0.47–1.11) Week 24
Unadjusted difference 1.2 (−9.8–12.2) −5.5 (−15.1–4.0) 1.07 (0.60–1.90) 0.80 (0.54–1.18) Difference adjusted for
Cohort 1.1 (−10.3–12.5) −7.1 (−16.2–2.1) 1.06 (0.60–1.87) 0.75 (0.51–1.11)
Background regimen 1.8 (−9.6–13.3) −3.3 (−12.9–6.3) 1.10 (0.62–1.96) 0.87 (0.59–1.30) Baseline viral load 1.9 (−9.0–12.8) −5.6 (−15.2–4.0) 1.11 (0.61–2.01) 0.80 (0.54–1.18) Baseline GSS 0.6 (−11.8–12.9) −6.5 (−17.0–4.0) 1.03 (0.56–1.87) 0.77 (0.51–1.18) Baseline etravirine WGS [11,12] 0.0 (−11.2–11.3) −5.6 (−16.1–4.9) 1.00 (0.54–1.85) 0.80 (0.52–1.22) Week 48
Unadjusted difference −2.4 (−15.8–10.9) −1.7 (−10.5–7.2) 0.88 (0.45–1.73) 0.93 (0.61, 1.41) Difference adjusted for
Cohort −1.9 (−15.9–12.2) −4.9 (−13.2–3.4) 0.91 (0.46–1.79) 0.77 (0.49–1.21)
Background regimen −1.6 (−15.4–12.3) −2.0 (−11.0–7.0) 0.92 (0.47–1.82) 0.91 (0.60–1.39) Baseline viral load −2.5 (−16.0–10.9) −1.6 (−10.5–7.3) 0.87 (0.44–1.72) 0.93 (0.61–1.41) Baseline GSS –1.8 (−17.1–13.5) −2.5 (−12.3–7.3) 0.91 (0.44–1.90) 0.89 (0.56–1.41)
Baseline etravirine WGS –‡ −2.0 (−14.6–10.7) –‡ 0.92 (0.55–1.54)
Week 96
Unadjusted difference −7.3 (−23.4–8.9) −0.5 (−8.4–7.3) 0.86 (0.35–2.10) 0.97 (0.60–1.56) Difference adjusted for
Cohort −9.6 (−25.9–6.8) −4.6 (−12.0–2.9) 0.58 (0.25–1.35) 0.74 (0.44–1.23)
Background regimen −7.2 (−22.7–8.4) −1.1 (−9.2–7.0) 0.67 (0.29–1.54) 0.94 (0.58–1.51) Baseline viral load −7.8 (−24.4–8.9) −0.5 (−8.4–7.5) 0.65 (0.28–1.48) 0.97 (0.61–1.56) Baseline GSS −6.0 (−24.0–12.1) +0.3 (−8.6–9.2) 0.70 (0.28–1.77) 1.02 (0.61–1.70) Baseline etravirine WGS −7.3 (−24.9–10.2) −4.9 (−16.7–7.0) 0.65 (0.25–1.65) 0.80 (0.46–1.39) CI, confidence interval; M = F, missing = failure; GSS, genotypic sensitivity score; WGS, weighted genotypic score; PI, protease inhibitor; DRV, darunavir. *Response rate for other PI group − response rate for DRV group.
†Response rate for other PI group/response rate for DRV group.
Fig. 2 Odds ratios at week 24 by cohort for (a) observed case analysis and (b) missing = failure analysis. CI, confidence interval; OR, odds ratio of response rate for other PI group/response rate for DRV group; LL, lower limit; UL, upper limit; PI, protease inhibitor; DRV, darunavir; ANRS, National Agency for AIDS Research; UTV, Tor Vergata University; C&W, Chelsea & Westminster; FLCS, Fundació Lluita Contra la SIDA; SHCS, Swiss HIV Cohort Study.
Table 4 Virological response rates by baseline etravirine weighted genotypic score and baseline genotypic sensitivity score (GSS)
DRV group Other PI group DRV group Other PI group
Total n 999 116
n with available resistance data 814 97
Baseline etravirine weighted genotypic score Observed response (%) M = F imputed response (%)
Week 12 n = 638 n = 64 n = 814 n = 97 Sensitive [n/total (%)] 313/447 (70) 34/44 (77) 313/583 (54) 34/73 (47) Intermediate [n/total (%)] 68/127 (54) 7/14 (50) 68/156 (44) 7/18 (39) Resistant [n/total (%)] 32/64 (50) 1/6 (17) 32/75 (43) 1/6 (17) Week 24 n = 565 n = 60 n = 814 n = 97 Sensitive [n/total (%)] 305/395 (77) 35/43 (81) 305/583 (52) 35/73 (48) Intermediate [n/total (%)] 74/115 (64) 5/13 (38) 74/156 (47) 5/18 (28) Resistant [n/total (%)] 34/55 (62) 4/4 (100) 34/75 (45) 4/6 (67) Total N 999 116
N with available resistance data 808 97
Baseline GSS Observed response (%) M = F imputed response (%)
Week 12 n = 634 n = 64 n = 808 n = 97 GSS 0–1 [n/total (%)] 98/153 (64) 11/19 (58) 98/198 (49.5) 11/28 (39) GSS 1.5–2 [n/total (%)] 197/304 (65) 25/34 (73.5) 197/380 (52) 25/46 (54) GSS> 2 [n/total (%)] 118/177 (67) 6/11 (54.5) 118/230 (51) 6/23 (26) Week 24 n = 561 n = 59 n = 808 n = 97 GSS 0–1 [n/total (%)] 102/143 (71) 12/16 (75) 102/198 (51.5) 12/28 (43) GSS 1.5–2 [n/total (%)] 180/262 (69) 24/32 (75) 180/380 (47) 24/46 (52) GSS> 2 [n/total (%)] 130/156 (83) 7/11 (64) 130/230 (56.5) 7/23 (30)
These differences were independent of the use of DRV vs. other PIs (Table 4).
Immunological response
The mean (standard error) change in CD4 cell count from baseline was +68.5 (5.1) cells/μL in the DRV group and +65.4 (14.7) cells/μL in the other PI group at week 12, +74.8 (5.8) cells/μL vs. +105.8 (18.9) cells/μL, respectively, at week 24 and +96.7 (9.6) cells/μL vs. 166.2 (37.3) cells/μL, respectively, at week 48. The CD4 cell count continued to increase into week 96 but the sample size was low so the results should be interpreted with caution.
Discussion
This retrospective, observational study was designed to compile available cohort data on the use of ETR in com-bination with boosted PIs other than DRV/r. The hypothesis was that the virological response achieved by patients in the other PI group would be comparable to that achieved by patients in the DRV group in an unselected group of HIV-positive patients seen for care in Europe.
The number of patients in this observational study was higher than that estimated to be obtainable from conducting a prospective clinical trial. Another strength of this retrospective, observational study design is that col-laborators leading the various cohorts are experienced in systematically collecting data specifically designed for HIV research.
The results of the current study give an overview of how ETR is used in clinical practice, with the majority of patients treated with ETR also receiving DRV/r as a boosted PI in their background regimen (90%), potentially in combination with an NRTI, RAL or ENF/MVC. Our results suggest that there is no difference in observed and M=F-imputed virological response rates between patients treated with ETR in combination with a background regimen containing DRV/r or another boosted PI. This comparison should be interpreted with caution given the relatively small sample size of the other PI group and possible influ-ence of confounding factors. For example, baseline char-acteristics indicate that patients in the DRV group were more ARV treatment experienced than patients in the other PI group, but at the same time, the proportion of patients with a baseline GSS> 2 was higher in the DRV group than in the other PI group. Imbalances were observed for other measured factors such as drugs used in the background regimen. However, the calculated stratum-adjusted Mantel–Haenszel results also did not indicate that there were differences in response rates between the treatment groups. All 95% CIs around the unadjusted and adjusted differences encompassed 0 for difference in
response rates (other PI group − DRV group) or encom-passed 1 for ORs (other PI group/DRV group). Nevertheless, we cannot rule out further confounding caused by unmeas-ured factors. At weeks 12 and 24, numerical differences were positive (and ORs> 1) for the observed response rates and negative (and ORs< 1) for the M=F-imputed response rates. However, this latter observation should be interpreted cautiously as it is a result of more missing data because of stopping ETR or missing data at a specific time-point in the other PI group. As expected, M=F-imputed response rates declined over time as less viral load data were available at later time-points. Also as expected, with the observed method, response rates increased over time because patients remaining on treatment later on tended to be those who responded best. Mean increases in CD4 cell counts occurred in both treatment groups over time. The increase appeared more pronounced in the other PI group than in the DRV group with longer treatment duration, although sample size in the other PI group was small.
When comparing across studies, differences in study design, patient populations, inclusion criteria and end-points need to be taken into consideration. However, generally virological response rates in our meta-analysis compare well with those that have been observed both in the randomized, double-blind, phase III DUET studies [4–7] and in clinical practice [16–18]. In the pooled DUET trials [4–7], 47% (week 12), 61% (week 24) and 60% (week 48) of treatment-experienced, HIV-1-infected patients receiving ETR 200 mg twice daily in combination with DRV/r and investigator selected NRTIs, with or without ENF, achieved a virological response (viral load<50 copies/mL; intent-to-treat, time-to-loss of virological response algorithm). Cor-responding observed response rates in the pooled DUET trials were 52% (week 12), 66% (week 24) and 75% (week 48) (Janssen data on file). In a US observational study of 587 treatment-experienced adults, week 24 observed virological response rates, determined using the primary endpoint of< 400 copies/mL, were similar for 340 patients receiving ETR in a regimen including DRV/r or in a regimen containing a PI/r other than DRV/r (n = 69) (79%
vs. 81%, respectively) [16]. In a small Spanish study of 122
patients from a routine clinical practice, of the 11.5% who used ETR in combination with a boosted PI other than DRV/r, the week 48 virological response rate (<50 copies/ mL, M=F) for the entire cohort was 73% [17].
Similar virological response rates were seen in the two treatment groups in patients with a sensitive ETR WGS. Responses were higher in patients with a sensitive ETR WGS than in patients with an intermediate or resistant ETR WGS. While this effect was observed in both treatment groups, it was more pronounced in the other PI group than in the DRV group, although sample sizes were small in
these subgroups. The observation that virological response appeared to be similar in the two treatment groups regard-less of baseline GSS could be attributable to the high proportion of patients with a sensitive ETR WGS in those patients with a low GSS (data not shown) or differences in the intrinsic potency of the ARVs, which were not taken into account when calculating the GSS.
There are several limitations to this study. The study was not a randomized clinical trial and lacked power to make formal statistical comparisons between the other PI group and the DRV group. There was clear heterogeneity in viro-logical response rates between the cohorts (P = 0.0353, Zelen’s exact test of homogeneity of ORs, week 24 observed data). However, the net effect on the overall pooled result was small, as indicated by the small difference between the unadjusted and adjusted for cohort ORs for differences in virological response rates between treatment groups. The other PI group had a relatively low number of patients. This was initially estimated to be approximately 250 patients but in actuality it was 116 patients. The number of patients in the DRV group (n = 999) was also lower than expected (n = 1500). The reasons for this difference were the inclu-sion in the estimates of patients with an undetectable viral load at the start of ETR treatment, unavailability of core data (viral load and baseline genotype) for some patients, use of (combinations of) ARVs not allowed according to the protocol and the lack of permission to use data from individual sites contributing to particular cohorts. In view of this low sample size, any week 96 data are shown for information, but are not discussed here. As three of the seven cohorts transferred analysed data, this limited any subgroup comparisons that could be made and prevented complex statistical adjustment for confounding factors being made. As this was a retrospective study, subgroup comparisons by ARV treatment could be confounded by intrinsic (i.e. reflecting the disease stage) and extrinsic (e.g. ARV cost, reimbursement and availability) factors. There was a potential for duplicate information because smaller cohorts may have contributed data to multina-tional cohorts, and data were provided by cohorts in a de-identified format. Upon feedback from cohorts, the potential for this overlap was considered to be< 1%, and most cohorts confirmed the lack of overlap with other cohorts. Finally, the lack of safety and DRV/r dosing data are important limitations.
Despite the limitations of this retrospective, observa-tional study, it enabled the compilation of European data on the use of ETR with boosted PIs other than DRV/r, which also represented daily clinical practice. There was no overall difference in virological response rates between the DRV group and other PI group, for a given set of measured confounding factors. All 95% CIs around the unadjusted
and adjusted differences in response rates at weeks 12 and 24 encompassed 0 for the difference in response rates (or 1 for the ORs). ETR appears to contribute to regimen activity because observed responses were higher in patients with a sensitive than an intermediate or resistant ETR WGS. Overall, the results of this observational study indicate that it might be appropriate to extrapolate the efficacy and virology results of the DUET studies to a regimen of ETR with a boosted PI other than DRV/r, although caution should be applied because of the lack of randomization and the small sample size of the other PI group.
Acknowledgements
The authors would like to thank the patients and their families, investigators, study centre staff, Janssen study personnel (including David Anderson, Goedele De Smedt, Stephanie Dincq, Magdalena Jagiello, Thomas Kakuda, Frank Tomaka, Anick Vandingenen, Simon Vanveggel, Quinten Verelst and Eric Wong for their input into this analysis and/or manuscript), and SGS Medical Writing (Inge Leysen and Julie Tobback). The Swiss HIV Cohort Study is supported by the Swiss National Science Founda-tion (grant # 33CS30_148522) and by the Swiss HIV Cohort Study Research Foundation. The members of the Swiss HIV Cohort Study are: V. Aubert, J. Barth, M. Battegay, E. Bernasconi, J. Böni, H. C. Bucher, C. Burton-Jeangros, A. Calmy, M. Cavassini, M. Egger, L. Elzi, J. Fehr, J. Fellay, H. Furrer (Chairman of the Clinical and Laboratory Commit-tee), C. A. Fux, M. Gorgievski, H. Günthard (President of the Swiss HIV Cohort Study), D. Haerry (deputy of ‘Positive Council’), B. Hasse, H. H. Hirsch, I. Hösli, C. Kahlert, L. Kaiser, O. Keiser, T. Klimkait, R. Kouyos, H. Kovari, B. Ledergerber, G. Martinetti, B. Martinez de Tejada, K. Metzner, N. Müller, D. Nadal, G. Pantaleo, A. Rauch (Chair-man of the Scientific Board), S. Regenass, M. Rickenbach (Head of Data Center), C. Rudin (Chairman of the Mother & Child Substudy), F. Schöni-Affolter, P. Schmid, D. Schultze, J. Schüpbach, R. Speck, C. Staehelin, P. Tarr, A. Telenti, A. Trkola, P. Vernazza, R. Weber and S. Yerly.
Conflicts of interest: JV, AH, SN, LT and MO are full-time
employees of Janssen. LL is a contractor/consultant for Janssen. VC, PF and A-GM have received research funding, consultancy fees, or lecture sponsorships from, or have served on advisory boards for, Abbott Laboratories, Gilead Sciences, ViiV Healthcare, Janssen-Cilag and Merck Sharp & Dohme (MSD). FC-S has received research funding, con-sultancy fees, or lecture sponsorships from, or has served on advisory boards for, Abbott Laboratories, Roche, Gilead Sciences, ViiV Healthcare, Janssen and MSD. C-FP has received research funding, consultancy fees, or lecture sponsorships from, or has served on advisory boards for,
Abbott Laboratories, Bristol-Myers Squibb (BMS), Roche, Gilead Sciences, ViiV Healthcare, Janssen and MSD. MMS has received research funding, consultancy fees, or lecture sponsorships from, or has served on advisory boards for, Abbott Laboratories, BMS, MSD and Janssen-Cilag. MN has acted as a consultant for and received educational and research grants from MSD, GlaxoSmithKline (GSK), BMS, Gilead Sciences, Johnson & Johnson, Janssen, Abbott Laboratories, Boehringer Ingelheim (BI), Schering-Plough, Pfizer and Roche. RB has no conflicts of interest to declare. Primary support for EuroSIDA (AC-L, JG and JL) is provided by the European Commission BIOMED 1 (CT94-1637), BIOMED 2 (CT97-2713), the 5th Framework (QLK2-2000-00773), the 6th Framework (LSHP-CT-2006-018632), and the 7th Framework (FP7/2007-2013, EuroCoord n° 260694) programmes; current support also includes unre-stricted grants from Janssen Research & Development, Merck and Co. Inc., Pfizer Inc., and GSK. FI has no conflicts of interest to declare; RK has served on advisory boards for Abbott Laboratories, Siemens, Janssen, Gilead Sciences, ViiV Healthcare, MSD and Roche. AS has served on advi-sory boards for or has received lecture sponsorships from Abbott Laboratories, Janssen, Gilead Sciences, GSK/ViiV Healthcare and BMS. BC has received research funding, consultancy fees, or lecture sponsorships from, or has served on advisory boards for, Abbott Laboratories, BI, Gilead Sciences, GSK, Janssen-Cilag, MSD, Pfizer and Janssen. RP has received consulting fees from Pfizer, ViiV Healthcare, BMS and Gilead Sciences and grant support from Pfizer, Roche Diagnostics, Siemens, MSD, Gilead Sci-ences and BI. HFG has been an adviser and/or consultant for the following companies: GSK, Abbott Laboratories, Gilead Sciences, BI, Roche, Janssen, Pfizer and BMS, and has received unrestricted research and educational grants from Roche, Abbott Laboratories, BMS, Gilead Sci-ences, GSK and MSD (all money went to the institution). BL has received travel grants, grants or honoraria from Abbott Laboratories, BMS, Gilead Sciences, Pfizer, ViiV Healthcare, GSK, MSD and Janssen.
Funding: This study was sponsored/supported by Janssen Research & Development. Medical writing support was provided by Chris Whittaker and Ian Woolveridge of Gardiner-Caldwell Communications, Macclesfield, UK; this support was funded by Janssen.
Author contributions: VC, A-GM, PF, FC-S, MMS, C-FP,
MN, RB, AC-L, JG, JL, RK, FI, AS, RP, BC, HFG and BL all reported and/or collected data for those patients included in the study. PF analysed the data from ANRS, AC-L ana-lysed the data from EuroSIDA and BL anaana-lysed the data from the Swiss HIV Cohort Study, and this cohort contrib-uted to improvements of the analysis plan, such as geno-type interpretation. JV, AH, SN, LT, LL and MO had a
significant involvement in the study conception and design or data analyses. All authors were involved in the devel-opment of the primary manuscript and interpretation of data, have read and approved the final version, and have met the criteria for authorship as established by the ICMJE.
References
1 Andries K, Azijn H, Thielemans T et al. TMC125, a novel next-generation nonnucleoside reverse transcriptase inhibitor active against nonnucleoside reverse transcriptase inhibitor-resistant human immunodeficiency virus type 1. Antimicrob Agents Chemother 2004; 48: 4680–4686. 2 Vingerhoets J, Azijn H, Fransen E et al. TMC125 displays a
high genetic barrier to the development of resistance: evidence from in vitro selection experiments. J Virol 2005;
79: 12773–12782.
3 INTELENCE®(etravirine) summary of product characteristics.
Janssen-Cilag Ltd. August 2008, Revised May 2013. Available at http://www.medicines.org.uk/emc/medicine/ 21185/SPC/Intelence+100+mg+tablets (accessed 1 April 2014).
4 Lazzarin A, Campbell T, Clotet B et al. Efficacy and safety of TMC125 (etravirine) in treatment-experienced HIV-1-infected patients in DUET-2: 24-week results from a randomised, double-blind, placebo-controlled trial. Lancet 2007; 370: 39–48.
5 Madruga JV, Cahn P, Grinsztejn B et al. Efficacy and safety of TMC125 (etravirine) in treatment-experienced
HIV-1-infected patients in DUET-1: 24-week results from a randomised, double-blind, placebo-controlled trial. Lancet 2007; 370: 29–38.
6 Katlama C, Haubrich R, Lalezari J et al. Efficacy and safety of etravirine in treatment-experienced, HIV-1 patients: pooled 48 week analysis of two randomized, controlled trials. AIDS 2009; 23: 2289–2300.
7 Katlama C, Clotet B, Mills A et al. Efficacy and safety of etravirine at week 96 in treatment-experienced HIV type-1-infected patients in the DUET-1 and DUET-2 trials. Antivir Ther 2010; 15: 1045–1052.
8 Protocol development according to the guidelines for Good Pharmacoepidemiology Practices (GPP). International Society for Pharmacoepidemiology, April 2007. Available at http:// www.pharmacoepi.org/resources/guidelines_08027.cfm#1 (accessed 1 April 2014).
9 STROBE statement. Strengthening the reporting of observational studies in epidemiology. Nov 2007. Available at http://www.strobe-statement.org/index.php?id=available -checklists (accessed 1 April 2014).
10 National Agency for AIDS Research HIV-1 genotypic drug resistance interpretation algorithms. Version number 21,
October 2011. Available at http://www.hivfrenchresistance .org/index.html (accessed 1 April 2014).
11 Vingerhoets J, Tambuyzer L, Azijn H et al. Resistance profile of etravirine: combined analysis of baseline genotypic and phenotypic data from the randomized, controlled Phase III clinical studies. AIDS 2010; 24: 503–514.
12 Tambuyzer L, Nijs S, Daems B et al. Effect of mutations at position E138 in HIV-1 reverse transcriptase on phenotypic susceptibility and virologic response to etravirine. J Acquir Immune Defic Syndr 2011; 58: 18–22.
13 Vingerhoets J, Nijs S, Tambuyzer L et al. Similar predictions of etravirine sensitivity regardless of genotypic testing method used: comparison of available scoring systems. Antivir Ther 2012; 17: 1571–1579.
14 Johnson VA, Calvez V, Günthard HF et al. 2011 update of the drug resistance mutations in HIV-1. Top Antivir Med 2011; 19: 156–164.
15 Tambuyzer L, Azijn H, Rimsky LT et al. Compilation and prevalence of mutations associated with resistance to non-nucleoside reverse transcriptase inhibitors. Antivir Ther 2009; 14: 103–109.
16 Gebo K, Voss C, Mrus J et al. Patterns of use and outcomes in patients treated with etravirine in the HIV Research Network. AIDS Res Treat 2013; 2013: 492831. 17 Santos JR, Llibre JM, Domingo P et al. Short
Communication: high effectiveness of etravirine in routine clinical practice in treatment-experienced HIV type 1-infected patients. AIDS Res Hum Retroviruses 2011; 27: 713–717.
18 Towner W, Lalezari J, Sension MG et al. Efficacy, safety, and tolerability of etravirine with and without darunavir/ ritonavir or raltegravir in treatment-experienced patients: analysis of the etravirine early access program in the United States. J Acquir Immune Defic Syndr 2010; 53: 614–618.