UNIVERSITY OF NAPLES FEDERICO II
DOCTORATEMOLECULAR MEDICINE AND MEDICAL BIOTECHNOLOGY XXXI CICLO A POST-TRANSLATIONAL MECHANISM OF PD-L1 REGULATION IN GLIOBLASTOMA MULTIFORME Tutor Candidate
Prof. Maria Fiammetta Romano Paolo D’Arrigo
COORDINATOR
Prof. Vittorio Enrico Avvedimento Academic Year 2017/2018
INDEX
ABSTRACT ... 1
1. INTRODUCTION ... 4
Glioblastoma ... 4
The immune checkpoint programmed cell death ligand-1 (PD-L1) ... 10
FK506 binding protein 51 (FKBP51)... 16
Identification of FKBP51s as a PD-L1 regulator ... 20
2. AIM ... 22
3. MATERIALS AND METHODS ... 23
4. RESULTS ... 36
Expression of FKBP51s and PD-L1 in glioma cell lines and tumor sections ... 36
Table 1. Profiles of FKBP51s and PD-L1 expression in 29 cases of glioblastoma multiforme ... 43
FKBP51s regulates PD-L1 expression acting as a co-chaperone in the ER ... 45
Selective inhibition of FKBP51s by SAFit reduces PD-L1 expression... 49
SAFit impairs PD-L1 up-regulation induced by ionizing radiation ... 52
SAFit reduces PD-L1-induced cell death of PBMC co-cultured with glioma cells ... 56
Expression of PD-L1 in glioblastoma cells from tumor mass (TM) and sub-ventricular
zone (SVZ) ... 60
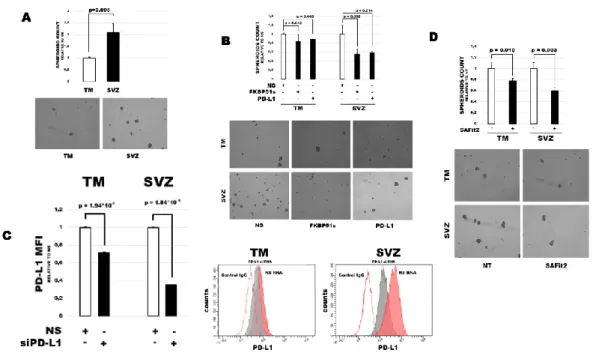
Expression of PD-L1 in SVZ cells is particularly sensitive to FKBP51s modulation ... 64
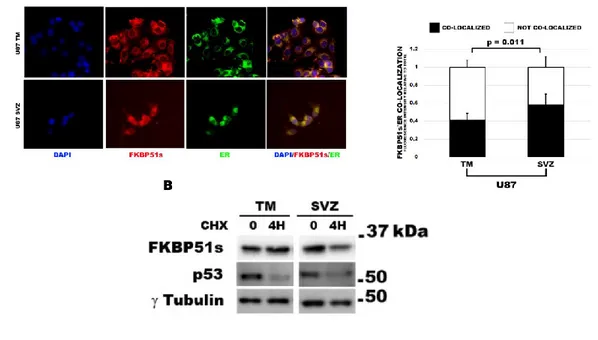
FKBP51s in SVZ cells is mainly localized in the ER ... 67
FKBP51s and PD-L1 sustain glioblastoma capacity to form spheroids... 70
SAFit impairs glioblastoma cell proliferation ... 73
SAFit decreases tumor volume and aggressiveness in a mice model of glioblastoma ... 76
5. DISCUSSION ... 80
6. CONCLUSIONS ... 87
7. REFERENCES ... 88
1
ABSTRACT
Glioblastoma Multiforme is one of the most aggressive form of malignancy of the central nervous system. To date, the treatment of this malignancy does not significantly improve the poor overall survival of the patients. The dramatic outcomes of immunotherapy in the treatment of several solid and hematologic tumors are giving new hopes for the treatment of glioblastoma. A series of clinical studies are currently ongoing, encouraged by the promising pre-clinica l results achieved. PD-L1 is one of the main immunotherapy molecular targets expressed on glioma cell surface. PD-L1 interacts with the cognate receptor PD1, expressed on the lymphocytes, and conveys an immune-inhibitory signalling. Increasing evidence suggests that PD-L1, in addition to its well-known immunomodulatory function, exerts tumor intrinsic functions that sustain self-renewal and growth. Currently, the overall mechanism that regulates the expression of PD-L1 in tumor cells is still unclear. Glioma tumors express high levels of the immunophilin and co-chaperone FKBP51. Our research group have identified a splicing isoform of this immunophilin, FKBP51s, in melano ma patients and provided elements in support of a role for this isoform as a foldase that serves to PD-L1 protein maturation. The aim of my thesis work was to address the
2 role of FKBP51s in regulation of PD-L1
expression in glioblastoma. Moreover, I also attempted to investigate whether PD-L1 could affect the tumor intrinsic pro-oncogenic properties.
To analyse the role of FKBP51s on PD-L1 expression and function, I used D54 and U251 glioblastoma cell lines that constitutively express PD-L1 and FKBP51s. By immunoblot and flow cytometry, I measured the expression of FKBP51s and PD-L1. By sub-cellula r
fractionation and
co-immunoprecipitation assays, I investigated FKBP51s localization and interaction with PD-L1. By co-cultures with PBMCs, I measured the tumor capacity to kill lymphocytes through PD-L1. By spheroids assay, immunofluorescence for Ki67 and cell counting, I measured the effect of PD-L1 and FKBP51s on glioma cell self-renewa l and growth capacities. Using a murine model of glioblastoma, made by injectio n of GFP+luc+ U87 cells, I addressed the effect of a selective inhibitor of FKBP51, called SAFit2, on tumor growth and aggressiveness.
Results obtained showed that FKBP51s is abundantly expressed in glioma cells. FKBP51s co-localized with PD-L1 in the ER. Silencing of FKBP51s expression or inhibiting its function by SAFit2 decreased glycosylated PD-L1 levels and its expression on plasma membrane.
3 Moreover, PD-L1 silencing decreased
spheroids formation especially in a subset of tumor cells which is isolated by the subventricular zone (SVZ) and has a high tumorigenic capacity. The same effect was obtained with SAFit2 that also decreased Ki67 expression and proliferation capacity of glioblasto ma cells. Daily treatment with SAFit2 reduced the volumes of formed tumors, in the in vivo glioblastoma model, and reduced the vimentin expression, in comparison with tumors from mice treated with the drug vehicle.
In conclusion, FKBP51s is involved in a post-transcriptional mechanism that regulates PD-L1 maturation and consequent expression on glioblasto ma plasma membrane. Glioblastoma cells with a high tumorigenic capacity, identified in the SVZ, expressed higher levels of PD-L1 compared with cells from the tumor mass grown in the nigrostriata l region. Inhibiting FKBP51s functio n decreases PD-L1 expression and reduces self-renewal and growth capacities of glioblastoma cells in vitro and in vivo.
4
1. INTRODUCTION
Glioblastoma
Glioblastoma Multiforme is the most common and aggressive form of malignancy of the central nervous system (Louis et al. 2007). According to World Health Organization (WHO) Classification System, which refers to histological and immunohistochemica l analogies to presumed origin cells and histological features of aggressiveness (Luois et al. 2016), glioblasto ma multiforme is classified as IV grade glioma, the higher grade of severity. The current clinical course for glioblasto ma treatment, that consists in maxima l surgical resection followed by radiotherapy and treatment with temozolomide (Weller et al. 2014), does still not represent a valid tool to fight this malignancy and today the overall median survival hardly reaches the 15 months after diagnosis (Furnari et al. 2007). High frequency of tumor recurrence is the cause for the poor median overall survival. Currently, we know that recurrence is mostly related to the presence of self-renewing cells called GBM- initiating cells (GICs), able to escape conventional treatments and regenerate the tumor (Liu et al. 2011). GICs, as in general the “Cancer Initiating Cells”, are considered a fraction of the
5 tumor cells that retain self-renewal and
differentiation abilities, with a high tumorigenesis potential in vivo experimental models (Weissman et al. 2001). Because GICs have shown abilities that are shared with neural stem cells (NSC), it is still unclear whether glioma cells come from NSCs or differentiated cells, as astrocytes or oligodendrocytes (Goffart et al. 2013). Recent studies by Kroonen et al. have demonstrated that GICs have a specific tropism for the sub-ventricular zones (SVZ) (Kroonen et al. 2011). Moreover, cells from SVZ showed a higher resistance to treatment with ionizi ng radiations compared with the tumor mass cells (Goffart et al. 2017). SVZ represents one of the most important neurogenic niches in adult brains, sustaining self-renewal and inhibiting differentiatio n (Alvarez-Buylla et al. 2002). Probably due to these characteristics, in the SVZ, GICs find a “fertile soil” for tumor reformation.
If GICs are also generated from adult neural stem cells (NSC) residents in the SVZ is still a controversial topic. A series of studies have demonstrated that the induction of cancerous transformation in NSC cells, by tumor suppressor genes inactivation as p53 and neurofibromatosis 1 (NF1) or the expression of a mutant form of p53, triggered glioma formatio n and the localization of the tumors formed showed to be associated with the SVZ
6 (Wang et al. 2009; Zhu et al. 2005;
Alcantara Llaguno et al. 2009). On the other hand, further studies have demonstrated that also NSC-derived progeny cells, as oligodendrocytes and astrocytes precursor cells, could undergo a cancerous transformation (Bachoo et al. 2002, Lindberg et al. 2009, Persson et al. 2010)
In the last years, a deeper understand ing of the common genetic lesions that characterize GBM, highlighted several molecular factors that might drive the high aggressiveness of this tumor. Epidermal Growth Factor Receptor (EGFR) has shown to be amplified in 40 to 50% of GBMs (Cancer Genome Atlas Research 2008). A series of gain-of-function mutations sustain the amplification of EGFR signalling, the most common of which is deletion of exons 2-7 that encode the ligand binding domain of the receptor, generating the constitutively active “EGFR variant III” (EGFRvIII) (Huang et al. 2009). EGFR amplification is frequently accompanied by the Phosphatase and tensin homolog (PTEN) loss of function resulting in a strong activation of phosphatidylinosito l-4,5-bisphosphate 3-kinase (PI3K) signalling (Huang et al. 2009). Genetic lesions that activate PI3K pathway occur in 90% of GBMs (Cancer Genome Atlas Research 2008), thus it is not surprising that together with EGFR inhibitors, as Erlotinib and Gefitinib, PI3K and Protein
7 Kinase B (AKT) inhibitors have been
considered as promising tools for GBM treatment. However, clinical studies have demonstrated that the tumor easily gains resistance to these drugs (Cloughesy et al. 2014). Mammalian target of rapamycin (mTOR) represents another compelling target in GBM treatment: the kinase exists as two distinct complexes, called mTOR complexes I and II (mTORC1 and mTORC2), which are characterized by a different function, regulation and response to the allosteric inhibito r rapamycin (Cloughesy et al. 2014). mTORC1 integrates growth factor receptor signalling via PI3K, with downstream promotion of cell proliferation, protein translation and inhibition of autophagy, to promote GBM growth and survival (Laplante and Sabatini 2012). Conversely, mTORC2 promotes GBM growth and surviva l through activation of nuclear factor kappa-light-chain-enhancer of activated B cells (NF-κB) (Tanaka et al. 2011). Alterations of PI3K signalling and PTEN loss are both involved in constitutive activation of mTORC1 and mTORC2 in GBM (Cloughesy et al. 2014). Unfortunately, once a time, Phase I and Phase II clinical studies on GBM patients have shown that rapamycin did not produce the promising benefits due to cancer resistance (Tanaka et al. 2011). The Cancer Genome Atlas database, that had successfully established a
8 comprehensive catalogue of genomic
alterations in a large cohort of GBM patients, has given the opportunity to generate a classification of GBM into four subtypes denoted mesenchyma l, proneural, classical and neural (Verhaak et al. 2010). Mesenchymal subtype is characterized by low expression of NF1, partly due to hemizygous deletions of the region containing the gene that predominantly occurred in this subtype (Verhaak et al. 2010). As suggested by the subtype name, Mesenchymal subtype is characterized by the expression of a series of mesenchymal markers such as CHI3L1 and MET (Phillips et al. 2006). Genes of the tumor necrosis factor superfamily and NF-κB pathway are highly expressed in this subtype (Verhaak et al. 2010). Characteristic of the Proneural subtype is the high expression of several proneural development genes such as SOX genes (Phillips et al. 2006). Another signature of this subtype is the high expression of oligodendrocytic development genes such as PDGFRA, NKX2-2 and OLIG2 (Noble et al. 2004). High expression of PDGFRA is mostly related to an amplification of the locus harbouring the gene (Verhaak et al. 2010). A work by Ligon et al. has shown that the high expression of OLIG2 promoted proliferation by downregulation of the tumor suppressor p21 (CDKN1A) (Ligon et al. 2007). EGFR amplification characterized the Classical subtype, frequently
9 accompanied by point or vIII EGFR
mutation (Verhaak et al. 2010). This subtype is also distinguished for a lack of TP53 mutations (Verhaak et al. 2010). The Neural subtype is characterized by the presence of neural markers such as GABRA1, SYT1 and NEFL (Verhaak et al. 2010)
So far, notwithstanding progress in the knowledge of the biology of this tumor, the treatment still remains a challenge for clinicians and the prognosis for GBM remains bad. Recent developments in the immunotherapy of cancer, with monoclonal antibodies that target the so-called “immune checkpoints inhibitors”, have opened the door to new hopes for GBM cure.
10 The immune checkpoint programmed
cell death ligand-1 (PD-L1)
Current developments in cancer treatment are emphasizing the role of the immune system in controlling tumor formatio n. Glioblastoma has long been recognized as a tumor able to create an immunosuppressive milieu through different mechanisms (Preusser et al. 2015; Tran et al. 2007; Wainwright et al. 2014; Berghoff et al. 2015; Huang et al. 2017). Inhibition of TGF signaling improved the overall survival in a mice model of glioblastoma, not only by inhibiting the tumor cell migration ability mediated by the cytokine, but also stimulating the immune system attack to the tumor (Tran et al. 2011). Indoleamine 2,3 dioxygenase (IDO) has shown to be another important immunosuppressive factor for glioblastoma development: in a mice model, glioma cells negative for IDO expression, have a reduced capacity to form the tumor comparing to IDO-competent cells (Wainwright et al. 2014). Stimulation of the cancer surveilla nc e function of the immune system, by targeting the immune checkpoint inhibitors, has demonstrated to be effective in inducing a durable remissio n in a number of tumors (Yao et al. 2013). The immune checkpoint inhibitors generally rely on several couples of
11 receptor/counter-receptor, the cognate
interactions of which activate an immunosuppressive pathway which dampens the antigen-induced T cell activation. One of these interactio ns involves Programmed Cell Death-1 (PD1), expressed on T-lymphocyte s surface, and Programmed Cell Death Ligand-1 (PD-L1), the cognate ligand. PD-L1 and its closest homologue PD-L2 are B7 family members. PD-L1 has broad tissue distribution, including both lymphoid and non-lymphoid organs, and it is also inducible in response to pro-inflammatory cytokines (Yao et al. 2013). By contrast, the expression of PD-L2 is mainly restricted to DCs and macrophages. The physiological functio n of the PD-L1/PD1 axis is in the control of human T cell activation and maintaining self-tolerance (Yao et al. 2013).
Most of the immune checkpoints that act on the plasma membrane contain one or more immunoglobulin (Ig) domains, involved in the interaction with the cognate receptors and in the signa l transduction to intracellular domains (Reviewed in Krzysztof et al. 2017). PD-L1 structure is composed of two Ig-like domains: the Ig-like domain of the N-terminal is responsible for binding PD-1, while is still unknown the function of the second Ig-like domain in the C-termina l (Reviewed in Krzysztof et al. 2017). Interestingly, in all available crystal structures PD-L1, has shown to be able to
12 form homodimers, but no experimenta l
cell data are available about such ability (Reviewed in Krzysztof et al. 2017). PD-L1 is sometimes aberrantly expressed by tumor cells. The triggering of PD1/PD-L1 pathway inhibits T-cell activation and proliferation by recruiting SHP-1 and SHP-2 phosphatases to TCR which (Parry et al. 2005) weakens the signal. Moreover, PD1/PD-L1 interactio n induces the up-regulation of the transcription factor ATF-like (BATF), which impairs cell proliferation and cytokine secretion (Quigley et al. 2010). Another effect of PD1 triggering is the inhibition of the pathways downstream to PI3K and activated-extracellular-regulated kinase (ERK) which also affect cell cycle progression and proliferation of T-cells (Patsoukis et al. 2012).
Interestingly, in addition to its immunomodulatory function, a role for PD-L1 in sustaining tumor features of aggressiveness and stemness has been also proposed, raising the hypothesis of a possible involvement of PD-L1/PD1 pathway in conveying a survival signal to the tumor. A study by Zheng et al. shows that treatment with anti-PD-L1 is able to impair growth rate and ability to form spheres in melanoma cell lines. Collectively, the research group demonstrated that PD-L1 plays an important role in sustaining the
self-13 renewal of malignant
melanoma-initiating cells (Zheng et al. 2017). PD-L1 is highly expressed in glioblastoma specimens from patients (Berghoff et al. 2015; Nduom et al. 2016) and its expression showed to be higher compared to other tumors as melanoma and non-small cell lung cancer (NSCLC) (Huang et al. 2017). In a preclinical study on GL261 glioma mouse model, treatment with anti-PD1 antibodies in combination with radiotherapy increased the percentage of long-term surviva l compared with mice treated with radiotherapy only (Zeng et al. 2013). Encouraged by these pre-clinical results, currently, a series of clinical studies involving GBM patients are ongoing. A clinical study is testing the tolerability and efficacy of the anti-PD1 monoclona l antibody Nivolumab, alone or in combination with Ipilimumab, an anti-CTLA4 monoclonal antibody, in comparison to the effect of Bevacizumab, in recurrent GBM patients [NCT02017717]. Other two studies, on recurrent GBM patients, are testing the efficacy of Pembrolizumab, (which targets PD1) in combination with Ipilimumab [NCT02337491] or with Magnetic Resonance Imaging (MRI)-guided laser ablation [NCT02311582]. Moreover, a fully human monoclona l antibody against PD1, called Durvalumab, is being tested in GBM
14 patients in combination with radiotherapy
and bevacizumab [NCT02336165]. Ionizing radiation has shown to up-regulate PD-L1 expression (Song et al. 2018). Song et al. have demonstrated that radiotherapy increases mRNA and protein levels of PD-L1 in U87 and U251 glioma cell lines, moreover, the research group demonstrated that the mechanism of up-regulation was dependent on the EGFR pathway (Song et al. 2016). In agreement with Benavente et al. (Concha-Benavente et al. 2016), PD-L1 expression in tumor cells is regulated by two major mechanisms. One mechanism is related to the production of pro-inflammatory cytokines, in particula r, IFN- produced by natural killer (NK) cells and CD8+ Cytotoxic T lymphocyte s (CTLs). The second mechanism, considered as a more “intrinsic ” mechanism independent of IFN- activity involves EGFR/JAK2 pathways in sustaining tumor cell PD-L1 expression. In addition to the transcriptional control, a number of studies have described a complex and sophisticated mechanism of post-transcriptional control of PD-L1 expression. Parsa et al. showed that AKT pathway can trigger PD-L1 expression in glioma cells through a translatio na l mechanism, involving the assembly of polyribosomes complex that increases the protein levels without affecting the mRNA levels (Parsa et al. 2007). Burr et
15 al. described a mechanism that involved
PD-L1 recycling on plasma membrane : their study demonstrated that CMTM6, involved in protein recycling, interacts with PD-L1 and inhibits the protein degradation mediated by endosome vesicles and thus promotes PD-L1 permanency on plasma membrane (Burr et al. 2017). Another mechanism, proposed by Chia-Wei et al., points to PD-L1 glycosylation as a further element that influences protein stability: this model suggests that non-glycosylated PD-L1 interacts with GSK3 and is conveyed to the proteasome via ubiquitination (Li et al. 2016). Most recently, a further element has been identified as involved in post-translational control of PD-L1 expression, namely the short isoform of the FK506 binding protein 51 (FKBP51s) which served as co-chaperone in protein glycosylation (Romano, D’Angelillo, Staibano et al. 2015).
16 FK506 binding protein 51 (FKBP51)
FKBP51 is a member of the immunophilin family, a large group of proteins characterized for their isomerase function, which catalyse the conversio n between cis and trans isomers of a peptide bond containing the amino acid proline (reviewed in D’Arrigo et al. 2016). Members of this family were originally identified as receptors for immunosuppressive drugs, thus, the “FKBP” group were first characterized as FK506, also known as Tacrolimus, Binding Proteins (reviewed in D’Arrigo et al. 2016). FKBP51 was firstly cloned in lymphocytes and identified as an important modulator of FK506 immunosuppressive function: the protein showed to inhibit Calcineurin phosphatase when complexed with FK506, thus impairing lymphoc yte activation (Baughman et al 1995). The structure of the protein consists of three C-terminal “TPR” domains, responsible for the interaction of FKBP51 with other proteins, in particular Hsp90 and Hsp70; conversely the N-terminal contains two FKBP domains, FK1 and FK2, among which the FK1 domain exerts the isomerase activity of the protein (Romano, Sorrentino et al. 2011). In addition to its function in lymphocyte s, FKBP51 was found abundantly expressed in several tumors (reviewed in Romano,
17 D’Angelillo and Romano 2015) includ ing
glioblastoma (Jiang et al. 2008). A study of specimens from 192 patients, includ ing glioblastoma multiforme, oligodendrogliomas, astrocytomas, and mixed gliomas, showed that FKBP51 expression level correlated with grading and overall glioblastoma patient surviva l rates; that is, the glioblastoma patients with high levels of FKBP51 had shorter survival than those with intermediate levels (Jiang et al. 2008).
Several studies in tumor cell lines have delineated the role of FKBP51 especially in sustaining cell proliferation and chemoresistance to conventional anti-cancer therapies (reviewed in Romano, D’Angelillo and Romano 2015): the protein sustains tumoral growth essentially by promoting NF-κB activation (Romano, Mallardo et al. 2011) and steroid receptor functions (Ni et al. 2010). In glioblastoma cell lines, Jiang et al. have demonstrated that FKBP51 promoted cell growth by activating NF-κB and moreover, silencing of FKBP51 increased rapamycin effect on glioma growth (Jiang et al. 2008).
Our research group has previously characterized the role of FKBP51 in melanoma biology and progression. Inhibition of FKBP51 by RNA silenc ing or treatment with rapamycin increased melanoma sensitivity to the pro-apoptotic
18 effect of doxorubicin (Romano et al.
2004); the protein activated the pro-survival signaling of NF-κB by interacting with IKK complex and promoting its activity (Romano, Xiao et al. 2015). Moreover, the activity of FKBP51 on NF-κB signaling also modulated melanoma sensitivity to ionizing radiations (Romano et al. 2010). It is to be noted that, rapamycin or FK506 target the activity of structurally simila r proteins that sometimes exert even opposite functions as FKBP51 and FKBP52 (Gaali et al. 2015). Recently, highly selective inhibitors of FKB51 have been created and named SAFit1 and SAFit2, for Selective Antagonist by Induced Fit. The chemical agents “induce” a conformational change to selectively “fit” to the protein target (Gaali et al. 2015). The research group of professor Felix Hausch, who designed the molecules, demonstrated that SAFits enhanced neurite outgrowth in neuronal cell lines (Gaali et al. 2015). More recently, a work by our research group highlighted a further crucial effect of SAFits on melanoma cell lines (Romano, Xiao et al. 2015). Treating melanoma cell lines with SAFits strongly impaired FKBP51 control on IκBα degradation and decreased NF-κB activation and cyclin D1 transcription (Romano, Xiao et al. 2015).
19 Recently, a spliced variant of FKBP51,
termed FKBP51s, has been identified for the first time by our research group in peripheral blood of melanoma patients. FKBP51s differs from the canonica l isoform because of lacking the TPR domains and having a distinct C-termina l domain (Romano, D’Angelillo, Staibano et al. 2015). Such a splicing variant was induced following tumor interaction with immune cells through PD-L1/PD1 and appeared to be involved in the regulatio n of PD-L1 expression (Romano, D’Angelillo, Staibano et al. 2015).
20 Identification of FKBP51s as a PD-L1
regulator
Romano et al demonstrated that engagement of PD-L1 with its receptor PD1 bidirectionally induces a spliced isoform of FKBP51 in both melanoma cell and the lymphocyte (Romano, D’Angelillo, Staibano et al. 2015). Such a splicing was accompanied by upregulation of PD-L1 expression (Romano, D’Angelillo, Staibano et al. 2015). FKBP51s was found to physically interact with PD-L1. This finding, together with the observation that FKBP51s affected especially the level of glycosylated PD-L1 and in line with the protein isomerase function, suggesting a role for FKBP51s in post-translatio na l regulation of PD-L1 expression, as a foldase (Romano, D’Angelillo, Staibano et al. 2015). An immunohistochemistry study of 76 melanoma tissues from patients showed a positive correlatio n between melanoma PD-L1 expression and FKBP51s expression in TILs (Romano, D’Angelillo, Staibano et al. 2015). Increased expression levels of FKBP51s, was also measured by qPCR in PBMCs of a study population that included 99 primary and 25 metastatic melanoma patients (Romano, D’Angelillo, Staibano et al. 2015). Very recently, expression of FKBP51s has been investigated also in PBMC subsets from 118 advanced melanoma patients
21 and 77 normal donors, showing that CD4,
CD8 and CD25 T lymphocytes subsets contained a proportion of an FKBP51spos component, that resulted significantly increased in melanoma patients and associated with reduced overall surviva l (Romano et al. 2017). This study suggested that FKBP51s expression in TILs and PBMCs was associated with a condition of tumor-induced immune suppression, with a negative impact on melanoma prognosis (Romano et al. 2017). Taken together, our previous studies provide elements in support of a melanoma/host immune system interaction that activates the splicing of FKBP5, which concurs to melanoma immune evasion by upregulation of PD-L1 (Romano, D’Angelillo, Staibano et al. 2015) and T lymphocyte impairme nt (Romano et al. 2017).
22
2. AIM
Because glioma contains high levels of FKBP51 (Jiang et al. 2008) and PD-L1 (Berghoff et al. 2015; Nduom 2016; Huang et al. 2017), it appeared to be an optimal model for addressing the role of the recently identified FKBP51s in PD-L1 expression regulation. Furthermore, the efficacy of selective FKBP51 inhibitors on PD-L1 expression and GBM oncogenic features was also investigated. The aims of my PhD project are:
Study of expression of FKBP51s and PD-L1 in glioblastoma cell lines and glioma sections from patients
Study of FKBP51s regulation of PD-L1 glycosylation
In vitro studies of the effects of small molecules selective inhibitors of FKBP51 on PD-L1, both constitutive ly expressed and induced by ionizing radiations
Study of PD-L1 involvement in tumor hallmarks of aggressiveness
In vivo studies of the effects of small molecules selective for FKBP51 on tumor growth and invasion, in a mice model of glioblastoma.
23
3. MATERIALS AND
METHODS
Cell culture: human glioma cell lines D54 and U251 were obtained by CEINGE cell bank (Cellular Technolo gy Platform). This platform guarantees cell lines identity and the absence of cross-contamination and microorganism contamination. Cells were cultured at 37°C and 5% CO2 in DMEM-F12 media (Biowest, Nuaillè, France) supplemented with 10% foetal bovine serum (FBS; Biowest), 200mM glutamine (Lonza), and 100 U/ml penicillin-streptomyc in (Lonza). Human glioma cell line SF767 was kindly provided by Prof. Gerolama Condorelli (University of Naples, Federico II) and cultured at 37°C and 5% CO2 in DMEM media (Biowest, Nuaillè, France) supplemented with 10% foetal bovine serum (FBS; Biowest), 200mM glutamine (Lonza), and 100 U/ml penicillin-streptomycin (Lonza).
GBM primary cell line GB138, established from acutely resected human GBM and validated as previously described (Kroonen et al. 2011) and glioma cell line U87MG from America n Type Culture Collection (ATCC), were cultured in DMEM containing 10% FBS, 200mM glutamine, and 100 U/ml penicillin-streptomycin. U87MG cells
24 were isolated from the tumor mass
(U87MG TM cells) and from the SVZ (U87MG SVZ cells) of GBM-xenografted mice. Briefly, U87MG TM and SVZ were isolated from 400uM thickness sections obtained with a Leica vibratome (Leica VT1000S, Groot Bijgaarden, Belgium). Brain slices were incubated in papain (WothingtonV R, Lakewood, NJ, USA) for 30 min at 37 °C, suspended in ovomucoide (Wothingto nV R) to stop the dissociation and established in culture.
Melanoma cell line SAN was kindly provided by Dr. Gabriella Zupi (Experimental Preclinic, Regina Elena Insitute for Cancer Research, Roma, Italy): the cells derive from a patient’s tumor lymphonodal metastasis and were cultured in RPMI (Lonza, Braine-l’Alleud, Belgium) supplemented with 10% foetal bovine serum, 200mM glutamine, and 100 U/ml penicillin-streptomycin. A375 melanoma cell line derived from a metastatic tumor and was cultured at 37°C and 5% CO2 in DMEM supplemented with 15% FKBP, 100 U/ml penicillin-streptomycin and 200mM glutamine.
Transfection: K2 transfection System (Biontex, Munich, Germany) was used to perform overexpression and knockdown experiments. According to manufacturer’s instructions, 24 hours before transfection, 4 x 10⁵ cells were
25 seeded into six-well plates to obtain
80-90% confluence at the time of transfection. Any treatment was performed 24 hours after transfection. For overexpressing FKBP51s, a True-ORF-Myc-DDK-tagged expression vector was used (OriGen Technologies, Rockville, MD, USA), that carried the cDNA of FKBP5 transcript variant 4. Control cells were transfected with a relative void vector. For knockdown, cells were transfected with specific short-interfering oligoribonucleotide (siRNA) or with a nonsilencing siRNA (NS RNA) as control, used at a final concentration of 50nM. NR RNA and siRNA for PD-L1 were purchased from Novus Biologica l (Littleton, CO, USA). For FKBP51s siRNA, siRNA#1 and #2 were drawn using target sequences at the 3’-coding region (between 700 and 1100 bp), while siRNA#3 is directed to 3’-UTR (region between 5200 and 5800 bp).
Treatments and reagents: for treatment with ionizing radiation (IR), was used a 6 MV X-ray of a linear accelerator (Primus, Siemens, München, Deutschland ). SAFit1 and 2 were provided by Prof. Felix Hausch laboratory (Gaali et al. 2015). Nivolumab (BMS-936558; Bristol-Myers Squibb, Princeton, NJ, USA) was used as anti-PD1 in co-cultures experiments. For experiments with SAFit compounds (50 μM in DMSO stock solution), 1:1000 DMSO:DMEM-F12 media was used for control cells.
26 Cycloheximide (Sigma-Aldrich) was
used at the concentration of 20 μg/ml.
Immunoblot and
Immunoprecipitation: proteins were extracted by the cell using modified RIPA buffer (150mM sodiumchloride, 50mM Tris-HCl, pH 7.4, 1mM ethylenediamine tetraacetic acid (EDTA), 1mM phenylmethylsulfonyl fluorite (PMSF), 1% Triton X-100, 1% sodium deoxycholic acid, 0.1% sodium dodecylsulfate (SDS), 5 mg/ml aprotinin, and 5 mg/ml leupeptin) and run in SDS page for immunoplot analysis. The primary antibodies against FKBP51 (rabbit polyclonal; Novus Biologica l), FKBP51s (rabbit polyclonal of our production, designed against protein C-terminus) and CD274/PD-L1 (rabbit polyclonal; Novus Biological) were used diluted 1:2500. CD133 (rabbit polyclonal; AbcamVR) was used diluted 1:1000. A further antibody Pdcd-1L1 (rabbit polyclonal, Santa Cruz Biotechnology) was used for PD-L1 detection diluted 1:1000. M2-Flag (mouse monoclonal; Sigma-Aldrich), γ-Tubulin (mouse monoclonal; Sigma-Aldrich) w used diluted 1:5000. Anti-G3PDH (rabbit monoclonal; Cell Signaling), anti-phospho S6 kinase (rabbit polyclonal; Cell Signaling) were used diluted 1:1000. Anti p70 S6 kinase a (rabbit polyclona; Santa Cruz) was used diluted 1:500. Anti β-Actin-Peroxidase (mouse monoclonal; Sigma-Adrich) was
27 used diluted 1:10000. Antibodies against
TGN46 (rabbit polyclonal; Sigma-Aldrich; diluted 1:1000), Calnexin (mouse monoclonal; Invitrogen; diluted 1:1000) and Histone H1 (mouse monoclonal; Santa Cruz Biotechnolo gy; diluted 1:500) were used as Trans Golgi Network (TGN), endoplasmic reticulum (ER) and nucleus markers respective ly. Anti-Phospho-Akt (Ser473) (rabbit monoclonal;Cell Signaling) and Akt1/2/3 (rabbit polyclonal, Santa Cruz) were used diluted 1:1000. For co-immunoprecipitation of PD-L1 and FKBP51s, 500ug of total lysate was pre-cleared for 1h at 4°C with rotation. Next, 1ug of each specific antibody was added to the lysate and incubated overnight at 4°C in rotation. Twenty microliters of Protein A-Agarose (Santa Cruz Biotechnology) was added to the solutio n and precipitation took place for 2h, with rotation at 4°C. After washing with modified RIPA buffer, samples were separated by SDS-PAGE and PD-L1 and FKBP51s were analysed by immunoblot.
Immunostaining: Before the
immunostaining, cells were seeded for 3h on coverslips coated with polyornitihine (0.1 mg/ml), then, after washing with PBS the cells were fixed in 4% PFA for 15 minutes. Brain coronal sections or cells on coverslips were permeabilized and unspecific binding sites were blocked for an hour at room temperature using a 10% donkey serum and 0.1% Triton
X-28 100 PBS solution. Tissue sections or
coverslipped cells were then incubated overnight at 4°C with primary antibodies diluted in PBS containing 0.1% of donkey serum and 0.1% of Triton X-100. Primary antibodies were diluted in PBS containing 0.1% donkey serum and 0.1% Triton X-100, followed by RRX- or FITC- conjugated secondary antibodies (Jackson Immunoresearch Laboratories; diluted 1:500). Anti Ki-67 (BD Biosciences) was used diluted 1:500. Anti FKBP51s (mouse monoclonal of our production) was used diluted 1:80. Anti Vimentin (rabbit monoclonal IgG, diluted 1:400, Cell Signaling®). Brain slides were incubated for an hour at RT with RRX-conjugated secondary antibody (1/500, Jackson Immunoresearc h Laboratories®) and finally coverslipped in a mounting solution containing DAPI (Vectashield®). For quantification of Vimentin expression in brain slices using ImageJ ®, cells GFP+Vimentin+ were quantified giving a threshold calculated on the negative control.
Image acquisition: Immunostained cells were imaged using a Zeiss Axiovert 10VR microscope (Car Zeiss®) coupled with Mercator® software (Explora Nova®). Figures were examined using ImageJ®.
Glycosidase digestion: after PD-L1 immunoprecipitation, protein lysates were treated with buffer containing
N-29 Glycosidase F (PGNase F; CalBioche m
Deglycosylation Kit, Merck Millipore, Temecula, CA) according to the manufacturer’s instructions. Digested samples were then analysed by immunoblot.
Sub-cellular fractionation: it was performed according to Sarnataro et al. (Sarnataro et al. 2004) with some changes. Briefly, cells were resuspended in 800 ul of Buffer F (0.25M sucrose, 10mM HEPES-NaOH pH 7.2, 10 mM KAc, 1.5 mM MgAc) and homogenized by pipetting the solution up and down 8-10 times through a 22-gauge needle. The nuclear fraction was sedimented by centrifugation for 5 min at 600g and then resuspended in modified RIPA buffer. The post-nuclear supernatant was adjusted to 0.75M sucrose, and the ER fraction was sedimented by ultracentrifugation for 12 min at 16.000 rpm at 4°C, in a Beckman Ultracentrifuge with an SW 50.1 Ti rotor and resuspended in modified RIPA buffer. Golgi fraction was obtained in the supernatant. Thenafter, all sub-cellular fractions were analysed by immunoblot.
qPCR: total RNA was extracted from cells by Trizol (Invitrogen, Carlsbad, CA, USA). Each RNA was used for cDNA synthesis with iScript Reverse Transcription (Bio-Rad, CA, USA). Relative gene expression was quantified by qPCR with 2-ΔCt comparative method
30 (Schmittgen et al. 2008), using the
SsoAdvancedTM SYBR Green Supermix (Bio-Rad) and specific qPCR primers. To amplify FKBP51s, validated QuantiTec primers from Qiagen (Valencia, CA, USA) were used. Primers to detect PD-L1
are Fw
5’-GCTTTTCAATGTGACCAGCA-3’ and
Rev
5’-TGGCTCCCAGCCTTACCAAG-3’. Relative quantification was performed co-amplifying ribosomal 18S (Fw 5’-CGATGCGGCGGCGTTATTC-3’ and Rev 5’-TCTGTCAATCCTGTCCGTGTCC-3’), GAPDH (Fw 5’-GGACTCATGACCACAGTCCAT-3’ and Rev 5’-GTTCAGCTCAGGGATGACCTT-3’) and -Actin (Fw 5’-CGAGGCCCAGAGCAAGAGAG-3’ and Rev 5’-CGGTTGGCCTTAGGGTTCAG-3’) as an internal control for normalization. Co-cultures of glioblastoma cells and peripheral blood mononuclear cells (PBMCs): co-cultures were performed as described (Liu et al. 2009; Somasundaram et al. 1995). Briefly, 24 h before co-culture, 4 x 10⁵ glioblasto ma cells were plated in 35mm plate. Before adding PBMCs, adherent cells were washed three times with PBS. PBMCs were isolated from heparinized blood by a Ficoll-Hypaque density gradient and pre-activated with anti-CD3
31 (eBioscience, San Diego, CA,USA) used
at concentration of 5 μg/ml. After 16h, 1 x 10⁶/ml PBMCs were added into each glioma cells-precoated plate. Cells were co-cultured at 37°C in a 5% CO2 humidified atmosphere in the presence of 5 μg/ml anti-PD1 or Abiciximab (anti-β3 integrin as control for humanized antibody). For co-culture with SAFit, glioma cells were pre-treated with 40 nM SAFit1or 60nM SAFit2 for 12h, before adding the PBMCs. For co-cultures with PD-L1 silencing, PBMCs were added to glioma cells after 24h the transfectio n took place. After 6h of co-culture, cells in suspension were collected and apoptosis was assayed by flow cytometry.
Flow Cytometry: samples were analysed by using a BD AccuriT M C6 Cytometer (BD Biosciences, New Jersey, USA). PD-L1 expression was analysed using anti B7/H1-phycoerythrin (PE) (R&D Systems, Minneapolis, MN, USA) at a concentration of 0.05 ug/ml. As control of non-specific binding, an Ig isotype PE-conjugated antibody was used. Apoptosis was analysed by annexin-V staining in double fluorescence with CD45-Peridinin Chlorophyll Protein Complex (PerCP) conjugated. Briefly, after co-culture 1 x 10⁵ cells were harvested and resuspended in 100ul of Binding Buffer (10uM HEPES/NaOH pH 7.5, 140 uM NaCl and 2.5 uM CaCl2) containing 1 μl of annexin-V-FITC (Pharmigen/Bec to n Dickinson, San Diego, CA, USA) and 5
32 μl of CD45. After 15min of incubation at
room temperature in the dark, 100 μl of Binding Buffer was added and apoptosis was analysed.
Intracranial Transplantation: Crl:NU-Foxn1nu mice were anesthetized with an intraperitoneal injection of ketamine (50 mg/mL, Pfizer®, Bruxelle s, Belgium)/xylazine (Sedativum 2%, Bayer®, Bruxelles, Belgium) solutio n (V/V). The cranium was exposed and a small hole was drilled 2.5 mm lateral and 0.5 mm anterior to the bregma with a size 34 inverted cone burr (Dremel). Mice were positioned in a stereotactic frame and 50,000 GFP+luc+ U87 cells in 2 µl PBS were injected into the right striatum through a 27-gauge needle over 1 min at 3 mm below the dura mater. The incisio n was closed with Vetbond (3M).
Mice treatment with SAFit2: The treatment was performed as previously described (Gaali et al. 2015). Briefly, animals were daily injected intraperitoneally with 10 mg per kg body weight of SAFit2 solubilized in a vehicle composed of 4% EtOH, 5% Tween80, 5% PEG400 in 0.9% saline, or just the vehicle.
Processing of Tissue Sections before
Immunostainings: Mice were
anaesthetized with an injection of Nembutal® (Pentobarbital 60 mg/mL, Ceva Sante Animal®) before an
33 intracardiac perfusion with a NaCl 0.9%
solution (VWR International®) followed by paraformaldehyde (PFA) 4% at 4°C (4,3g/L NaOH, 40g/L paraformaldehyd e, 18.8 g/L NaH2PO4). Brains were collected, postfixed in 4% PFA and cryoprotected overnight in a solution of PBS/sucrose (20%). Brains were frozen at -20°C in a 2-methylbutane solutio n (Sigma®) and cut into 14 μm thick coronal sections using a cryostat. The volume of the tumor formed has been evaluated on GFP+ areas using ImageJ ® and using the formula V= (length × Width^2)/2.
Plasmids, lentiviral vectors generation and transduction: Gene transfer lentiviral plasmid was pLenti6-eGFP-IRES-Luc. This plasmid allows the dual eGFP and firefly luciferase (Photinus pyralis) expression and was generated by cloning the eGFP sequence and the IRES of the encephalomyocarditis virus (ECMV) sequence (from pIRES2-eGFP Vector, Clontech®, Mountain View, CA, USA) and Luciferase gene (from pGL3-Basic, Promega®) into the pLenti6/V5-D-Topo (Invitrogen®). U87 cells were either transduced with lentiviral vectors (15 TU/cell) allowing the dual expression of eGFP and luciferase. Transduced cells were selected with 1mg/mL Blasticid in (Sigma®).
ER Co-localization Assay: For the staining of endoplasmic reticulum I used
34 an organic probe that spontaneously
localize in the endoplasmic reticulum. The ER Staining Kit - Green Fluorescence - Cytopainter (ab139481) was used following manufacturer’s instructions. The quantification of co-localized ER-FKBP51s signal was performed using ImageJ®: on the merged picture, the amount of co-localized FKBP51s with the ER staining was quantified measuring the intensity of the yellow signal; for the non-colocalized FKBP51s, was measured the intensity of the red signal.
Analysis of proliferation status: U87 cells from TM and SVZ were daily treated with 60 nM SAFit2 or the vehicle. Every two days the cells were harvested and cell number was estimated by Countess II Automated Cell Counter. At fourth days of treatment: cells were also seeded on a coverslips and processed for Ki67 immunostaining as previously described.
Spheroids formation assay: U87 cells from TM and SVZ were cultured in DMEM/F12 serum-free medium containing B27 without vitamin A (Life Technologies®) and supplemented with recombinant epidermal growth factor and fibroblast growth factor 2 (EGF, 20 ng/mL and FGF-2, 10 ng/mL, Preprotech®). After 4 days in culture, the amount of spheroids was counted using an optical microscope.
35 Statistical Analysis: Student’s t-test was
used to analyse differences between means of values. ANOVA served to compare different experimental groups. A p-value ≤ 0.05 was considered statistically significant.
36
4. RESULTS
Expression of FKBP51s and PD-L1 in glioma cell lines and tumor sections I semiquantitatively measured the basal expression of FKBP51 isoforms in glioma cell lines (D54 and U251) and primary glioma cell line GB138, in comparison with melanoma cell lines (A375 and SAN) by immunoblot. Figure 1A shows that glioma cells expressed both canonical and the spliced isoform of FKBP51, in particular, the expression of FKBP51s showed to be higher in GB138; in melanoma cells, FKBP51s was barely detectable. I then measured PD-L1 expression in U251, D54 and GB138 by flow cytometry (1B). Results showed that glioma cells expressed high levels of PD-L1 on plasma membrane and the expression appeared to be highest in GB138. Immunoblot analysis of PD-L1 on whole protein lysates of U251 and D54 revealed the presence of several isoforms of the protein (1C). In accordance with to Li et al., the higher molecular weight isoforms are post-translationally modified, while the band at ~37 kDa corresponds to the naïve protein (Li et al. 2106). PD-L1 contains four residues of asparagine that are N-Glycosylated
(https://www.uniprot.org/uniprot/Q9NZ Q7#ptm_processing). In addition to ~37 kDa band, I found bands at ~50 and ~68
37 kDa. I analysed PD-L1 expression by
immunoblot also in GB138 in comparison to melanoma cell lines A375 and SAN (Figure 1C). While in A375 and SAN, PD-L1 was barely detected, in line with previous results (Romano, D’Angelillo, Staibano et al. 2015); in GB138, the 50 kDa modified isoform of PD-L1 appeared to be highly expressed, while the naïve band was not appreciated. To confirm that higher isoforms of PD-L1 are glycosylated, I treated immunoprecipitated PD-L1 protein with an N-Glycosidase, PNGase F. As shown in Figure 1E, treatment with PGNase F caused a decreasing of 68-kDa band and a concomitant appearance of a ~37 kDa band of PD-L1, suggesting that 68 kDa band is N-glycosylated. Because the glycosylation process occurs in the lumen of endoplasmic reticulum (ER) and in Golgi cisternae, by fractionation of D54 cells, I obtained protein extracts from different sub-cellular compartments that were analysed by immunoblot for the presence of FKBP51, FKBP51s and PD-L1 isoforms. Figure 1F shows that 68 kDa band is expressed in the ER and mostly in the Golgi fraction, 50 kDa band is appreciable in the Golgi fraction. Interestingly, FKBP51s and not FKBP51 was expressed in the ER fraction, suggesting a possible role in the ER that distinguishes the shorter isoform from the canonical one. In collaboration with the Pathologists of our University, expression of FKBP51s and PD-L1 was
38 confirmed in 29 specimens from
glioblastoma patients by immunohistochemistry (IHC) (Figure 2A-D). Cytoplasmic and nuclear FKBP51s expressions of tumor tissue were observed. PD-L1 staining was observed in glioblastoma tissues to a variable extent and intensity. FKBP51s expression was also confirmed at mRNA level in eight glioblastoma specimens (2E). Details on IHC semiquantitative evaluation are reported in Table 1.
39 Fig 1. Expression of FKBP51s and
PD-L1 in glioma cell lines
(A) Immunoblot assay of FKBP51 and FKBP51s expression in D54, U251 glioma cell lines and in the primary glioblastoma GB138 cells. Lysates derived from A375 and SAN melano ma cell lines were used for comparison. (B) Flow cytometric histograms of PD-L1 expression in U251, D54 and GB138 glioblastoma cell lines. (C) Immunob lo t analysis of PD-L1 expression in D54 and U251: the arrows indicate 3 isoforms of the protein ascribable to the naive (37 kDa) and post-traslational modified isoforms (~50 and ~68 kDa). (D) Immunoblot assay of PD-L1 expression
40 in primary glioblastoma GB138 cells
compared to melanoma cell lines A375 and SAN. (E) Whole D54 lysates immunoprecipitated with anti-PD-L1 and treated, or not, with PNGase F. The arrows indicate the higher, in PGNase treated lysates, and lower, in not treated lysates, PD-L1 band. Fetuin, on the left of the panel, was used as positive control of PGNase digestion. (F) Immunoblot of D54 lysates obtained from sub-cellula r compartments. PD-L1, FKBP51 and FKBP51s levels are shown with the relative organelle markers.
41 Fig 2. FKBP51s and
PD-L1 immunohistochemistry of glioma samples
FKBP51s cytoplasmic immunoreactivity was detected in >10% and <50% (A) or in ≥50% (B) of neoplastic cells (400x magnification). In some cases a strong (A) nuclear localization was observed. PD-L1 displayed focal signal (≤10%) with cytoplasmic and membrane immunoreactivity (C; 200x magnification) and a strong and diffuse signal in neoplastic cells (≥50%), both cytoplasmic and nuclear (D; 200x magnification). (E) quantitative FKBP51s expression of 8 glioblasto ma samples. QPCR was performed by using a coamplified β-actin internal control for
42 sample normalization. FKBP51s value of
a PBMC has been also run for comparison. Columns and bars are representative of means and standard deviations of values for each sample as individual data point.
43 Table 1. Profiles of FKBP51s and
PD-L1 expression in 29 cases of glioblastoma multiforme
* (% x intensity)
%(proportion of immunoreactive neoplastic cells): 1, ≤10%; 2, >10% and <50%; 3, ≥50%
44 Intensity: 1, weak: the signal was evident
only at 40x magnification; 2, moderate: the signal was evident at 20x magnification; 3, strong: the signal was evident at 10x magnification
** +, reaction in ≥5% of tumor cells; -, <5% of tumor cells
45 FKBP51s regulates PD-L1 expression
acting as a co-chaperone in the ER To investigate the role of FKBP51s on PD-L1 expression, I used differe nt FKBP51s siRNAs and a PD-L1 siRNA for protein knockdown and then evaluated the effect on PD-L1 expression by immunoblot. Figure 3A shows that FKBP51s silencing is able to decrease PD-L1 expression: the isoforms with higher molecular weight, in particular the 68 kDa band, appeared to be down-modulated especially by the mixture of two FKBP51s siRNAs. Surprisingly, FKBP51s silencing was also able to affect naïve PD-L1 expression. Silencing of PD-L1 showed to down-modulate 68 and 37 kDa bands. As shown in Figure 3B, FKBP51s silencing doesn’t reduce transcript levels of PD-L1, as it happens with PD-L1 silencing, which was used as positive control. This result let us exclude a transcriptional regulation by FKBP51s, giving strength to the hypothesis that the protein acts on a post-translational level. The effect on naïve PD-L1 is probably related to ER stress due to an imbalance of ER-related proteins. Flow cytometry results confirmed that FKBP51s silencing is able to decrease PD-L1 expression on plasma membrane (Figure 3C). A representative PD-L1 histogram in overlay from silencing experiment is shown in Figure 3D. To further confirm the role of
46 FKBP51s on PD-L1 expression, I also
performed an over-expression of FKBP51s in U251 and D54 cells, then I analysed PD-L1 level by immunob lo t (Figure 3E). As expected, higher molecular weight bands at 68 and 50 kDa showed to be increased by the over-expression of FKBP51s. Because FKBP51s was found in ER together with naïve and modified PD-L1 isoforms, I investigated a possible interactio n between the two proteins in ER. As shown in Figure 3F, pull-down of either FKBP51s and PD-L1 confirmed that the two proteins interact with each other in the ER fraction.
47 Fig 3. FKBP51s regulates PD-L1
expression acting as a co-chaperone in the ER
(A) Immunoblot of lysates obtained from glioblastoma cell line U251, transfected with FKBP51s siRNAs, PD-L1 sirna or a non-silencing (NS) RNA. (B) qPCR analysis of PD-L1 and FKBP51s expression in U251 and D54 glioblastoma cells, transfected with NS RNA, FKBP51s siRNA mix, PD-L1 siRNA (upper) or a vector carrying FKBP51s or an empty vector as control (lower). (C) U251 cells treated as in A, were analysed by flow cytometry for PD-L1 expression. The graph represents MFI (mean and standard deviation) of PDL1 expression. P values are indicated (N=6).
48 (D) Flow cytometric histograms shown in
overlay of PD-L1 expression in U251 glioma cells, silenced or not for FKBP51s , or PD-L1. (E) Immunoblot of cell lysates obtained from D54 and U251 glioblastoma cell lines over-expressing FKBP51s or transfected with a void vector (EV) as control. (F) Co-IP of PD-L1 and FKBP51s in ER fraction. ER lysates were immunoprecipitated with anti-PD-L1 and anti-FKBP51s and analysed for proteins presence by immunoblot.
49 Selective inhibition of FKBP51s by
SAFit reduces PD-L1 expression
Because SAFits, the selective inhibitors of FKBP51, were designed to interact with the FK1 domain (Gaali et al. 2016), which is retained in FKBP51s, I investigated their ability to modulate PD-L1 expression in glioma. Figure 4A shows a dose-response assay of SAFit effect on PD-L1, as measured by flow cytometry. After 12 hours of treatment with three different doses of SAFit1 and SAFit2 (5, 25 or 50nM), I found that especially SAFit2 was able to decrease PD-L1 expression on plasma membrane. Figure 4B shows a kinetic of PD-L1 expression regulation by SAFit2. Results confirmed that after 12 hours the drug significantly decreased the expression of PD-L1 on plasma membrane. A representative histogram in overlay of flow cytometry analysis (Figure 4C), shows the down-modulation of PD-L1 by SAFit2 treatment. Immunoblot analysis of PD-L1 expression after SAFit2 treatment (Figure 4D) shows that the modified isoforms of the protein are affected by the drug treatment.
50 Fig 4. Selective inhibition of FKBP51s
by SAFits reduces PD-L1 expression (A) Dose response assay of SAFit on PD-L1 expression. D54 glioblastoma cells were incubated with SAFit1 and 2 at different concentrations. After 12h of incubation, cells were harvested and analysed by flow cytometry for PD-L1 expression. Graph columns represent mean fluorescence itensities of PD-L1 expression with related P values (N=3). (B) Kinetic of PD-L1 expression. Glioblastoma cells were treated with SAFit2 for different times of incubatio n, then, cells were harvested and analysed by flow cytometry for PD-L1 expression.
51 Graph represents mean fluoresce nce
intesities of PD-L1 expression (N=3). (C) Flow cytometric histograms represented in overlay and immunoblot (D) of PD-L1 expression in cells cultured in absence or presence of 50nM SAFit2 for 12h.
52 SAFit impairs PD-L1 up-regulation
induced by ionizing radiation
Because ionizing radiation (IR) induces PD-L1 expression in glioma cells (Song et al. 2018), I investigated whether treatment with SAFit2 was able to impair such an induction. As shown in Figure 5A, by flow cytometry, I measured a significant induction of PD-L1 expression with 4 and 8Gy IR (p=0.05), which was dampened by SAFit2. The IR-induced up-regulation was also measured at mRNA level (Figure 5B). By immunoblot of protein lysates from D54 cells collected after IR in kinetic (Figure 5C), It can be appreciated that the induction of 68 kDa isoform of PD-L1 is impaired by SAFit2. A decreasing of naïve 37 kDa isoform of PD-L1 was also appreciated with SAFit2 after 24 hours of irradiation, suggesting that in particula r conditions the drug can also affect the level of naïve protein. By RNA silencing, I further analysed the role of FKBP51s on PD-L1 induction after IR treatment. As shown in the immunoblot of Figure 5D, D54 cells silenced for FKBP51s did not show the increase of the 68kDa PD-L1 band after IR. Sub-cellular fractionatio n of D54 cells treated with IR (Figure 5E) showed that, after 12 hours from IR, a PD-L1 isoform between 37 and 50 kDa is strongly induced. The same PD-L1 isoform induced in the ER decreased after 24 hours from IR. In the Golgi fraction,
53 the expression of 68 kDa PD-L1 band
appeared to increase after 12 h from IR and did not substantially change after 24h. Expression of FKBP51s in the ER, after a strong decreasing at 3 hours from IR, showed to be induced at 12 hours from the treatment. The same sub-cellula r fractionation experiment, performed in the presence of SAFit2 (Figure 5F), showed that after 12 hours from IR, the drug was able to attenuate the inductio n of both PD-L1 isoform up to 37 kDa in the ER and the higher isoform in the Golgi fraction. Because AKT activity in glioma cells has shown to induce PD-L1 expression by a post-transcriptio na l mechanism (Parsa et al. 2007), I investigated the levels of phospho-AKT in both whole protein lysates and ER fraction of D54 cells treated with IR (Figure 5G). Immunoblot on whole lysates showed that pAKT levels are induced by irradiation and remain high until 12 hours from treatment, after that pAKT levels showed to be decreased. Furthermore, I found high levels of pAKT in the ER, confirming an important function for this protein in ER membranes (Du et al. 2006).
54 Fig 5. SAFit2 impairs PD-L1
up-regulation by ionizing radiations treatment
(A) Dose response assay of IR-induced PD-L1 expression and modulation by SAFit2. D54 glioblastoma cells were irradiated at different Gy doses (1, 4 and 8Gy), in the absence or presence of 50 nM SAFit1 aor SAFit2. After 12h of incubation, cells were harvested and analysed by flow cytometry for PD-L1 expression. The graph represents mean fluorescence intensities (mean and
55 standard deviation, N=3) of PD-L1
expression. (B) PD-L1 mRNA expression levels analysis by qPCR in D54 glio ma cells, after irradiation at 4 and 8 Gy. Cells were harvested 12h after IR. (C) Kinetic of IR-induced PD-L1 expression levels. D54 cells were harvested 3, 12, 24h after 4 Gy IR. (D) Immunoblot assay of PD-L1 expression in cell lysates obtained from D54 glioblastoma cells, transfected with a FKBP51s siRNAs mix, or NS RNA, 24h before irradiation at 4 Gy. Cells were harvested 12h after IR. (E) Immunob lo t of lysates obtained from sub-cellula r compartments of D54 cells after 4 Gy IR. PD-L1 and FKBP51s levels are shown along with relative organelle markers. (G) p-AKT expression levels in D54 lysates obtained from whole cell and ER compartment, shown along with ER marker.
56 SAFit reduces PD-L1-induced cell death
of PBMC co-cultured with glioma cells To investigate whether SAFits treatment could affect glioma cells capacity to kill lymphocytes through PD-L1/PD1 interaction, as previously described (Romano, D’Angelillo, Staibano et al. 2015), I performed co-cultures of glioblastoma cells with peripheral blood mononuclear cells (PBMC) isolated from healthy donors. To this end, besides U251 and D54 glioma cells that were highly positive for PD-L1, I also used another glioma cell line, SF767, that expressed very low levels of PD-L1 as shown by flow cytometry (Figure 6A) and immunoblot analysis (Figure 6B). PBMCs were harvested after 6 hours of co-culture and apoptosis was analysed by annexin V staining in double fluorescence with CD45, in flow cytometry. Only cells positive for CD45 were taken into account for the analysis, to exclude any presence of non-PBMCs cells, results are represented in (Figure 6C). PBMC co-cultured with glioma cells showed a significant increase in apoptosis compared with non-co-cultured cells (Figure 6C). PD-L1 silencing of glioma cells significantly reduced the extent of cell death in co-cultured PBMC, with exception of SF767 co-cultures (Figure 6C). A similar decrease in PBMC apoptosis was measured when anti-PD1 or SAFits was added to the co-cultures
57 (Figure 6D). Such treatments produced a
decrease in cell death of PBMCs co-cultured with D54 and U251, compared to apoptosis of PBMCs co-cultured in the presence of an unrelated monoclona l antibody (Abiciximab) (Figure 6D). Th lack of effect observed with PD-L1 silencing (Figure 6C) or anti-PD1 (Figure 6D) in SF767 co-cultures suggests that mechanisms other than PD-1/PD-L1 signal could play a role in SF767-induced lymphocyte killing.
58 Fig 6. SAFits reduced PD-L1-induced
cell death of PBMCs co-cultured with glioma cells
PD-L1 expression in D54, U251 and SF767 glioblastoma cells analysed by flow cytometry (A) and by immunob lo t (B). (C) Graphical representation of cell death values of PBMC not cocultured or cocultured for 6h with D54, U251, and SF767 glioblastoma cells, previously silenced or not for PD-L1. PBMC was harvested and assayed by flow cytometry. Values are reported as box plots. Differences are shown (N=6) (D)
59 Graphical representation of cell death
values of PBMC not cocultured (no CC) or cocultured (CC/) for 6h with D54, U251 and SF767 glioblastoma cells, in the absence or presence of anti-PD1, SAFit1 and SAFit2 or a humanized antibody (Abiciximab)m as control. PBMC was harvested and assayed in flow cytometry for Annexin-V binding in double fluorescence with CD45. Values measured for each cell line are reported as box plots. Differences (p-values) are shown (N=6)
60 Expression of PD-L1 in glioblastoma
cells from tumor mass (TM) and sub-ventricular zone (SVZ)
In collaboration with professor Rogister research group from GIGA Neurosciences of Liege, I had the opportunity to investigate the mechanism of post-translational regulation of PD-L1 expression in glioblastoma cell lines obtained by orthotopic injection of human U87 cells in the striatum of the athymic nude mouse. According to this in vivo model (Kroonen et al. 2011), after four weeks from the cell injection, in addition to a tumor mass formed in the nigrostriatal region, a group of glioblastoma cells, migrating from the tumor mass (TM) through the corpus callosum, can be recognizable in the subventricular zone (SVZ). As previously discussed, cells from SVZ show characteristics of high tumorigenicity if re-injected in mouse, suggesting that these cells are particularly enriched in GICs. The two formed glioblasto ma subsets from TM and SVZ were isolated by Rogister group, in order to establish two different cell lines for in vitro studies. As sown in Figure 7A, expression of glycosylated PD-L1 in the SVZ was higher than the TM. Immunoblot of Figure 7A also shows that SVZ expressed higher levels of the glioma stem marker, CD133 (Brescia et al. 2013), in
61 accordance with the notion that these
cells had a more stem phenotype than cells from TM. Flow cytometry analysis (Figure 7B) confirmed that PD-L1 expression on plasma membrane was higher in cells from SVZ than from TM. Figure 7C shows a representative histogram in overlay of flow cytometry analysis of PD-L1 expression on TM and SVZ. By qPCR, I measured mRNA levels of PD-L1 (Figure 7D): transcript levels of PD-L1 showed to be even higher in the TM in comparison with SVZ, suggesting that the higher protein level in SVZ was ascribable to post-transcriptio na l mechanisms of regulation. In line with Parsa (Parsa et al. 2007), I measured increased AKT and S6K1 phosphorylation levels in the SVZ than TM, suggesting an involvement of this signaling pathway in the increased PD-L1 level in SVZ, notwithstanding the reduced PD-L1 transcript levels.
62 Fig 7. Expression of PD-L1 in
glioblastoma cells from tumor mass (TM) and sub-ventricular zone (SVZ)
(A) Immunoblot of the expression of PD-L1 and CD133 in U87 derived from TM and SVZ. (B) Flow cytometry analysis of PD-L1 expression in glioblastoma cells from TM and SVZ. Graph columns represents mean fluorescence intensitie s with related P value (N=3) and a representative histogram showed in overlay (C) of PD-L1 expression in SVZ