Aggregation Induced Emission from a new Naphthyridine-ethynyl-Gold(I) Complex as a potential tool for sensing
Guanosine Nucleotides in Aqueous Media
Journal: Dalton Transactions
Manuscript ID DT-ART-10-2019-004162.R1 Article Type: Paper
Date Submitted by the Author: n/a
Complete List of Authors: Moro, Artur; Universidade Nova de Lisboa, REQUIMTE, Dep. Química Avó, João; Universidade de Lisboa Instituto Superior Tecnico, CQFM-IN and IBB-Institute for Bioengineering and Biosciences
Malfois, Marc; ALBA Synchrotron Light Laboratory (CELLS)., Carrer de la Llum 2-26. 08290 Cerdanyola del Vallès
Zaccaria, Francesco; Vrije Universiteit Amsterdam,
Fonseca Guerra, Célia; VU University, Theoretical Chemistry
Caparrós, Francisco Javier; Universitat de Barcelona, Inorganic and Organic Departament
Rodriguez, Laura; Universitat de Barcelona, Inorganic and Organic Departament
Guidelines for Referees
Thank you very much for agreeing to review this manuscript for Dalton Transactions.
Dalton Transactions is a journal for all areas of inorganic chemistry, which encompasses
the organometallic, bioinorganic and materials chemistry of the elements, with
applications including synthesis, catalysis, energy conversion/storage, electrical devices and medicine.
Dalton Transactions welcomes high-quality, original submissions in all of these areas and
more, where the advancement of knowledge in inorganic chemistry is significant.
Dalton Transactions’ Impact Factor is 4.052 (2018 Journal Citation Reports®)
Dalton Transactions wishes to encourage high quality articles reporting exciting new developments in
inorganic chemistry.
For an article to be accepted, it must report new, high-quality research and make a significant contribution to the field.
Best regards,
Professor John Arnold Dr Andrew Shore
Editorial Board Chair, Dalton Transactions Executive Editor, Dalton Transactions
Please visit our reviewer hub for further details of our processes, policies and reviewer responsibilities as well as guidance on how to review, or click the links below.
We ask referees to recommend only the most significant work for publication in Dalton Transactions. When
making your recommendation please:
• Comment on the originality, importance, impact and scientific reliability of the work
• Note that routine or incremental work should not be recommended for publication.
• Contact the Editor if there is any conflict of interest, if the work has been previously published or if there
is a significant part of the work which you are not able to referee with confidence.
The following manuscript has been submitted for consideration as a
Aggregation Induced Emission from a new
Naphthyridine-ethynyl-Gold(I) Complex as a potential tool for sensing Guanosine
Nucleotides in Aqueous Media
Artur J. Moro,a* João Avó,b Marc Malfois,c Francesco Zaccaria,d Célia Fonseca Guerra,d Francisco
J. Caparrós,e,,f Laura Rodríguez,e,,f and João Carlos Limaa
a LAQV-REQUIMTE, Departamento de Química, CQFB, Universidade Nova de Lisboa, Monte de
Caparica, Portugal. E-mail:[email protected]
bInstituto Superior Técnico, Universidade de Lisboa,
cALBA Synchrotron Light Laboratory (CELLS), Carrer de la Llum 2−26, 08290 Cerdanyola del
Vallès, Barcelona, Spain
dDepartment of Theoretical Chemistry, Amsterdam Center for Multiscale Modeling, 1081 HV
Amsterdam, The Netherlands
eDepartament de Química Inorgànica i Orgànica. Secció de Química Inorgànica. Universitat de
Barcelona, Martí i Franquès 1-11, 08028 Barcelona, Spain.
f Institut de Nanociència i Nanotecnologia (IN2UB). Universitat de Barcelona, 08028 Barcelona
NMR Spectra/Data
0.5 1.0 1.5 2.0 2.5 3.0 3.5 4.0 4.5 5.0 5.5 6.0 6.5 7.0 7.5 8.0 8.5 9.0 9.5 10.0 10.5 11.0 11.5 f1 (ppm) -1000 0 1000 2000 3000 4000 5000 6000 7000 8000 9000 10000 11000 12000 13000 14000 15000 16000 17000 18000 19000 20000 21000 2. 99 0. 87 0. 98 2. 98 1. 00 A (s) 11.11 B (m) 8.41 C (d) 7.61 D (s) 4.56 E (s) 2.19 2. 19 2. 51 3. 34 4. 56 7. 60 7. 62 8. 38 8. 40 8. 42 8. 44 11 .1 1Figure S1. 1H NMR spectrum of 2 in DMSO.
0 10 20 30 40 50 60 70 80 90 100 110 120 130 140 150 160 170 180 f1 (ppm) 0 1000 2000 3000 4000 5000 6000 7000 8000 9000 24 .6 8 39 .3 7 39 .5 7 39 .7 8 39 .9 9 40 .2 0 40 .4 1 40 .6 2 82 .4 0 83 .9 8 11 5. 97 12 0. 13 12 4. 13 13 8. 24 13 9. 82 14 5. 42 15 4. 91 15 5. 47 17 0. 79
0.5 1.0 1.5 2.0 2.5 3.0 3.5 4.0 4.5 5.0 5.5 6.0 6.5 7.0 7.5 8.0 8.5 9.0 9.5 10.5 11.5 f2 (ppm) 1 2 3 4 5 6 7 8 9 10 11 12 f1 ( pp m )
Figure S3. 1H-1H COSY NMR spectrum of 2 in DMSO.
0.5 1.0 1.5 2.0 2.5 3.0 3.5 4.0 4.5 5.0 5.5 6.0 6.5 7.0 7.5 8.0 8.5 9.0 9.5 10.5 11.5 f2 (ppm) 0 10 20 30 40 50 60 70 80 90 100 110 120 130 140 150 f1 ( pp m )
0.5 1.0 1.5 2.0 2.5 3.0 3.5 4.0 4.5 5.0 5.5 6.0 6.5 7.0 7.5 8.0 8.5 9.0 9.5 10.5 11.5 f2 (ppm) 0 20 40 60 80 100 120 140 160 180 200 f1 ( pp m )
Figure S5. 1H-13CHMBC NMR spectrum of 2 in DMSO.
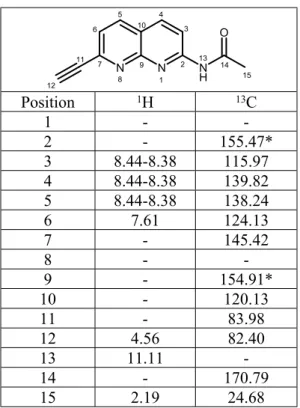
Table S1. NMR peak assignment for 2.
N N N H O 1 2 3 4 5 6 7 8 9 10 11 12 13 14 15 Position 1H 13C 1 - -2 - 155.47* 3 8.44-8.38 115.97 4 8.44-8.38 139.82 5 8.44-8.38 138.24 6 7.61 124.13 7 - 145.42 8 - -9 - 154.91* 10 - 120.13 11 - 83.98 12 4.56 82.40 13 11.11 -14 - 170.79 15 2.19 24.68
0.0 0.5 1.0 1.5 2.0 2.5 3.0 3.5 4.0 4.5 5.0 5.5 6.0 6.5 7.0 7.5 8.0 8.5 9.0 9.5 10.0 10.5 11.0 f1 (ppm) -1E+07 0 1E+07 2E+07 3E+07 4E+07 5E+07 6E+07 7E+07 8E+07 9E+07 1E+08 1E+08 1E+08 1E+08 3. 02 5. 88 3. 24 3. 14 0. 99 0. 89 1. 98 1. 00 A (s) 10.91 B (d)8.12 C (d)7.26 E (d)4.45 F (d) 4.28 G (s) 4.24 H (s) 2.08 D (m) 8.22 2. 08 4. 24 4. 27 4. 29 4. 43 4. 46 7. 25 7. 27 8. 11 8. 12 8. 19 8. 21 8. 23 8. 24 10 .9 1
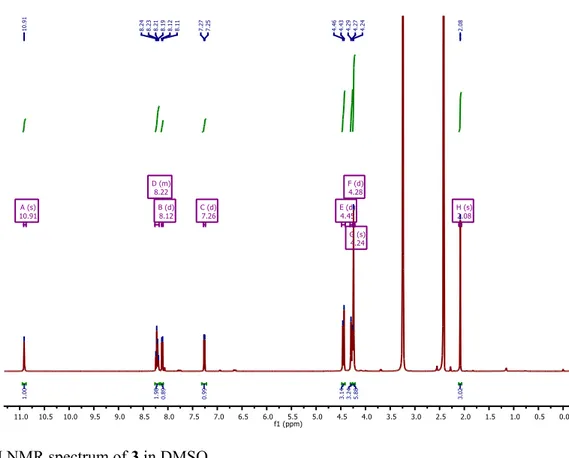
Figure S6. 1H NMR spectrum of 3 in DMSO.
-10 0 10 20 30 40 50 60 70 80 90 100 110 120 130 140 150 160 170 180 190 200 210 f1 (ppm) -2E+06 -1E+06 0 1E+06 2E+06 3E+06 4E+06 5E+06 6E+06 7E+06 8E+06 9E+06 1E+07 1E+07 1E+07 1E+07 1E+07 2E+07 2E+07 2E+07 24 .6 4 39 .6 5 39 .8 2 39 .9 9 40 .0 3 40 .1 5 40 .3 2 40 .4 9 51 .0 7 51 .2 3 72 .2 7 11 4. 67 11 9. 02 12 4. 72 13 7. 13 13 9. 51 14 8. 07 15 4. 93 15 5. 24 17 0. 64
1.0 1.5 2.0 2.5 3.0 3.5 4.0 4.5 5.0 5.5 6.0 6.5 7.0 7.5 8.0 8.5 9.0 9.5 10.5 11.5 f2 (ppm) 1 2 3 4 5 6 7 8 9 10 11 12 f1 ( pp m )
Figure S8. 1H-1H COSY NMR spectrum of 3 in DMSO.
1.0 1.5 2.0 2.5 3.0 3.5 4.0 4.5 5.0 5.5 6.0 6.5 7.0 7.5 8.0 8.5 9.0 9.5 10.5 11.5 f2 (ppm) 0 10 20 30 40 50 60 70 80 90 100 110 120 130 140 150 f1 ( pp m )
1.0 1.5 2.0 2.5 3.0 3.5 4.0 4.5 5.0 5.5 6.0 6.5 7.0 7.5 8.0 8.5 9.0 9.5 10.5 11.5 f2 (ppm) 0 20 40 60 80 100 120 140 160 180 200 f1 ( pp m )
Figure S10. 1H-13C HMBC NMR spectrum of 3 in DMSO.
-190 -170 -150 -130 -110 -90 -70 -50 -30 -10 10 30 50 70 90 110 130 150 170 190 f1 (ppm)
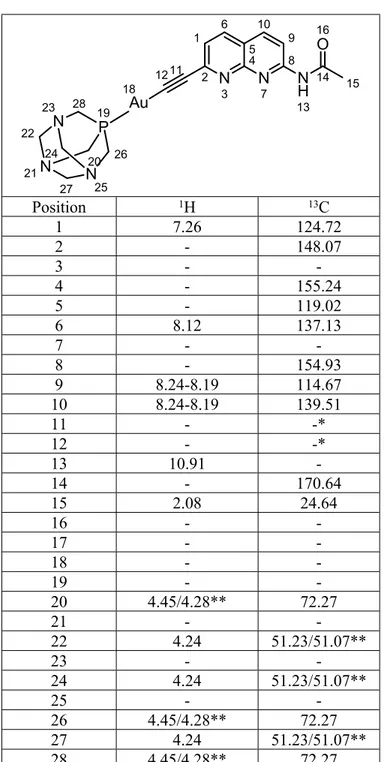
Table S2. NMR peak assignment for 3. 1 2 N 3 4 5 6 N 7 8 9 10 11 12 N H 13 14 15 O 16 Au 18 P 19 20 N 21 22 N 23 24 N 25 26 27 28 Position 1H 13C 1 7.26 124.72 2 - 148.07 3 - -4 - 155.24 5 - 119.02 6 8.12 137.13 7 - -8 - 154.93 9 8.24-8.19 114.67 10 8.24-8.19 139.51 11 - -* 12 - -* 13 10.91 -14 - 170.64 15 2.08 24.64 16 - -17 - -18 - -19 - -20 4.45/4.28** 72.27 21 - -22 4.24 51.23/51.07** 23 - -24 4.24 51.23/51.07** 25 - -26 4.45/4.28** 72.27 27 4.24 51.23/51.07** 28 4.45/4.28** 72.27
*These quaternary carbons were not observed, possibly due to (1) low relaxation times or (2) low sample concentration; **Unequivocal assignment of these signals was not possible on the acquired spectra.
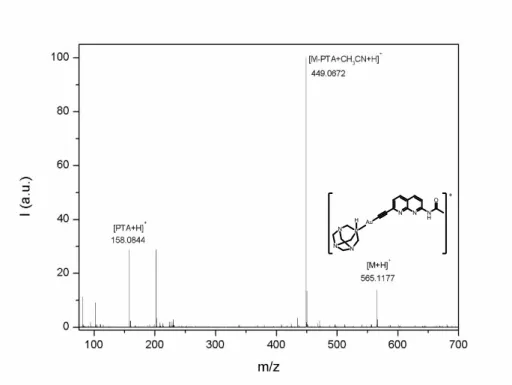
N N N H O Au P N N N H + Figure S12. HR-MS spectrum of 3. 300 400 500 600 700 0.0 0.2 0.4 0.6 0.8 1.0 A bs Wavelength (nm) 0 100 0.0 0.2 0.4 0.6 0.8 343 nm 400 nm A bs [3] (M)
Figure S13. UV-Vis spectra at different concentrations of 3 in water (left); variations of absorbance at 343 nm and 400 nm at different concentrations of 3 (right).
350 450 550 0 1 I (n orm.) Wavelength (nm) 350 550 0 1 I (n orm.) Wavelength (nm) 400 500 600 0 1 I (n orm.) Wavelength (nm)
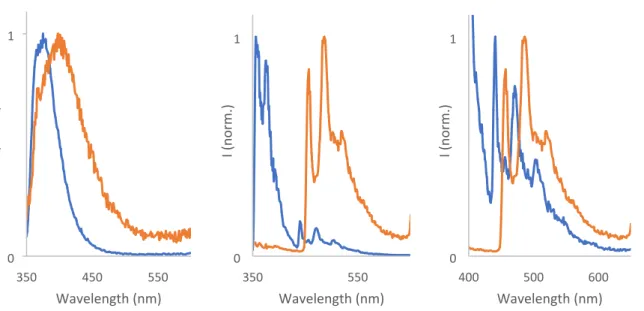
Figure S14. Left: Emission spectra of 2 (blue) and 3 (orange) in methanol at room temperature; Center: Normalized emission of 2 and 3 at 77K; Right: normalized spectra of 2 and 3 in the region between 400-650nm at 77K, for better comparison of the vibrational structure of the bands (λexc = 343 nm for all cases).
Figure S15. Emission spectra of 10 and 90 µM solutions of 3 at 77K in 10 mM HEPES buffer (pH 7.2), exciting at 343 nm (left) and 400 nm (right).
400 500 600 0 0.5 1 10uM 90uM I (a. u. ) Wavelength (nm) 450 550 650 750 0 3 6 9 10uM 90uM Wavelength (nm) I (a. u. )
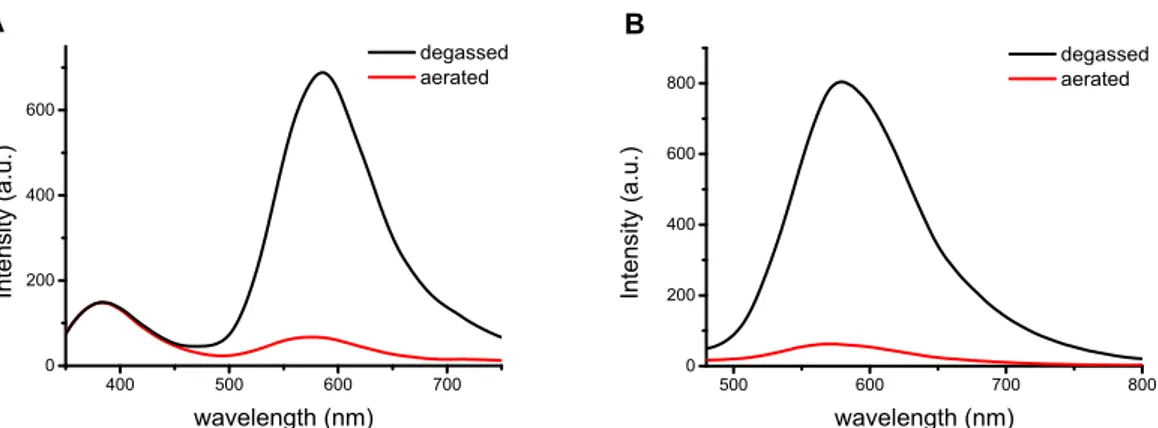
400 500 600 700 0 200 400 600 degassed aerated A In te ns ity ( a. u. ) wavelength (nm) 500 600 700 800 0 200 400 600 800 In te ns ity ( a. u. ) wavelength (nm) degassed aerated B
Figure S16. Steady-state emission spectra of a solid sample (powder) of 3 at room temperature in degassed (black line) and aerated (red line) conditions, exciting at (A) 320 nm and (B) 400 nm.
400 450 500 550 600 650 700 750 800 0.0 0.2 0.4 0.6 0.8 1.0 N or m al iz ed In te ns ity ( a. u. ) wavelength (nm) exc@340nm exc@400nm 0 1 2 3 4 5 0.0 0.2 0.4 0.6 0.8 1.0 I (n o rm .) time (ms) decay 470nm decay 600nm fit 470nm fit 600nm
Figure S17. (A) Time-resolved emission spectra of 3 in solid state, exciting at 340 nm (black) and 400 nm (red). Delay = 0.2 ms; (B) decay profiles of the emission at 470 nm (black) and 600 nm (red). The contributions of each lifetime component are presented in brackets (τaverage= 0.2 ms). Excitation wavelength was 320 nm.
500 600 700 0.0 0.2 0.4 0.6 0.8 1.0 I ( no rm .) Wavelength (nm) 0.2 0.4 0.6 0.8 1.0 0.0 0.2 0.4 0.6 0.8 1.0 decay 600 nm fit 600 nm I ( no rm .) time (ms)
Figure S18. (A) Time-resolved emission spectra of 3 in 10mM HEPES buffer (pH7.2), λexcitation = 400 nm, delay = 0.2 ms.
(B) Decay profile of the emission at 600 nm.
τ 1= 0.37 ms (0.56) τ 2= 0.12 ms (0.44) τ 1= 0.76 ms (0.40) τ 2= 0.14 ms (0.60) τ= 0.10 ms
A
B
A
B
Figure S19. Low resolution structures obtained from SAXS measurements of 3 at 1 x 10⁻⁵ M in 100% DMSO (A and B)
and 10% DMSO/ 90% H2O mixture (C and D). The pairs A/B and C/D represent the same structure at two different views,
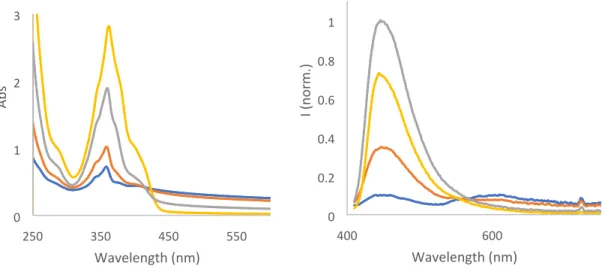
shifted by 90º. 250 350 450 550 0 1 2 3 Wavelength (nm) Abs 400 600 0 0.2 0.4 0.6 0.8 1 Wavelength (nm) I (n orm.)
Figure 20. Absorption and emission (λexc = 410 nm) of 3 (60 µM) in different H2O:DMSO mixtures: 100% water (blue),
90% water:10% DMSO (red), 75% water:25% DMSO (grey), and 50% water:50% DMSO (orange).
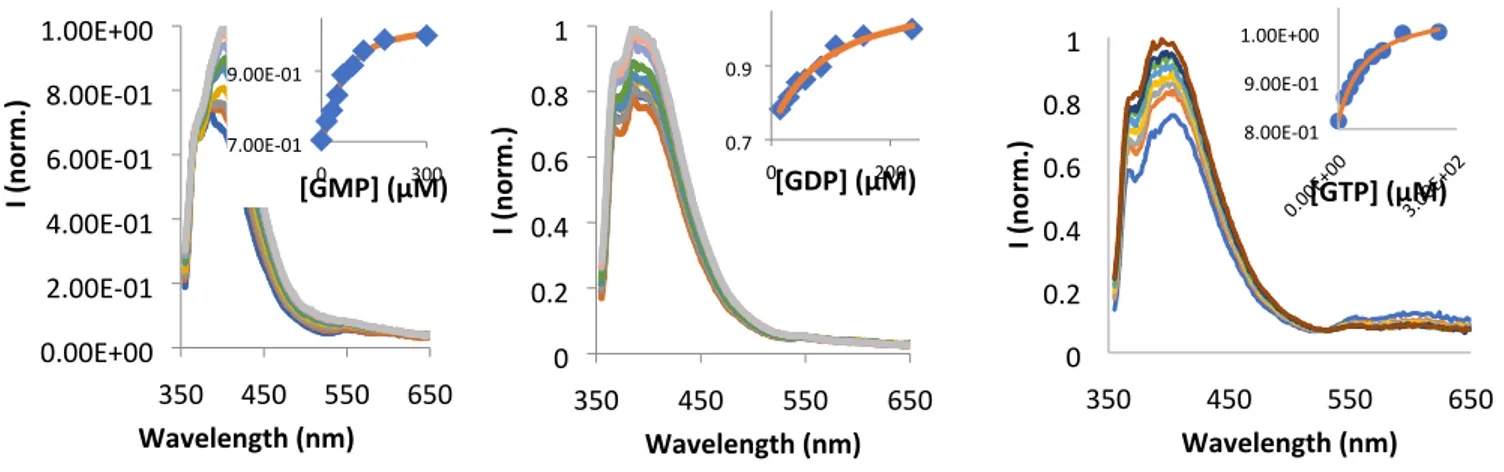
350 450 550 650 0 0.2 0.4 0.6 0.8 1 Wavelength (nm) I ( no rm.) 350 550 0 0.2 0.4 0.6 0.8 1 Wavelength (nm) I ( no rm.) 350 550 0 0.2 0.4 0.6 0.8 1 Wavelength (nm) I ( no rm.) Figure S21. Emission spectra of 3 (10µM, in 10mM HEPES buffer at pH 7.2) in the presence of different amounts of Guanosine nucleotides, λexc = 343 nm. Insets show the trend of the normalized intensity versus concentration of respective
Guanosine derivative. 0 50 0.8 0.9 1.0 [GDP] (µM) 0 50 0.8 0.9 1.0 [GMP] (µM) 0 30 0.8 0.9 1.0 [GTP] (µM)
300 450 600 0.0 0.2 0.4 0.6 0.8 1.0 no GMP 250 M GMP A bs or ba nc e Wavelength (nm)
Figure S22. Variation of absorption of 3 (60 µM in 10 mM HEPES buffer at pH 7.2) in the presence of Guanosine 5’-monophosphate (GMP). 350 450 550 650 0.00E+00 2.00E-01 4.00E-01 6.00E-01 8.00E-01 1.00E+00 Wavelength (nm) I ( no rm.) 350 450 550 650 0 0.2 0.4 0.6 0.8 1 I ( no rm.) Wavelength (nm) 350 450 550 650 0 0.2 0.4 0.6 0.8 1 I ( no rm.) Wavelength (nm)
Figure S23. Emission spectra of 3 (60µM, in 10mM HEPES buffer at pH 7.2) in the presence of different amounts of Guanosine nucleotides, λexc = 343 nm. Insets show the trend of the normalized intensity versus concentration of respective
Guanosine derivative. 0 300 7.00E-01 9.00E-01 [GMP] (μM) 0.00E+00 3.00E+02 8.00E-01 9.00E-01 1.00E+00 [GTP] (μM) 0 200 0.7 0.9 [GDP] (μM)
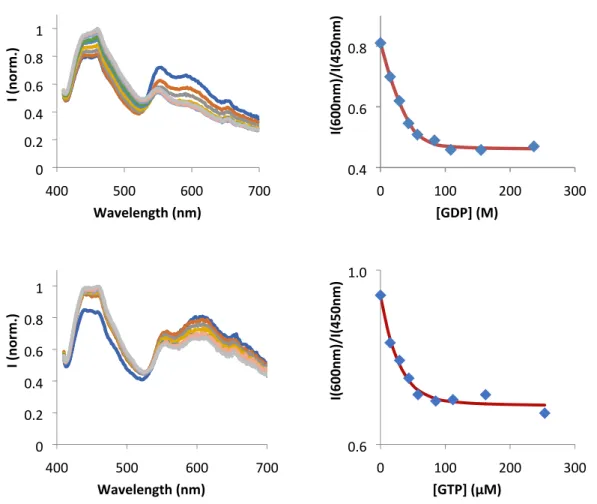
400 500 600 700 0 0.2 0.4 0.6 0.8 1 Wavelength (nm) I ( no rm.) 0 100 200 300 0.4 0.6 0.8 [GDP] (M) I(600n m )/I( 450n m ) 400 500 600 700 0 0.2 0.4 0.6 0.8 1 Wavelength (nm) I ( no rm.) 0 100 200 300 0.6 1.0 [GTP] (µM) I(600n m )/I( 450n m )
Figure S24. Emission spectra of 3 (60µM) in the presence of different amounts of GDP (left, top) and GTP (left, bottom). Respective insets of the ratio between the monomer and aggregates emission are shown on the right
300 320 340 360 380 400 0 0.1 0.2 0.3 0.4 Wavelength (nm) Abs 370 420 470 0 0.5 1 Wavelength (nm) Intensi ty (no rm.) 0 10 20 30 40 0 0.5 1 [Guanine] (µM] Intensi ty (no rm.)
Figure S25. Absorption and emission (λexc = 372 nm) spectra of 2 in dichloromethane (1x10⁻⁵ M), in the presence of
increasing amounts of Guanine. The association constant was determined by fitting the experimental data to a 1:1 Henderson-Hasselbalch model using the Solver Add-In from Microsoft Excel, yielding a value of 4.2x10⁵ M-1.
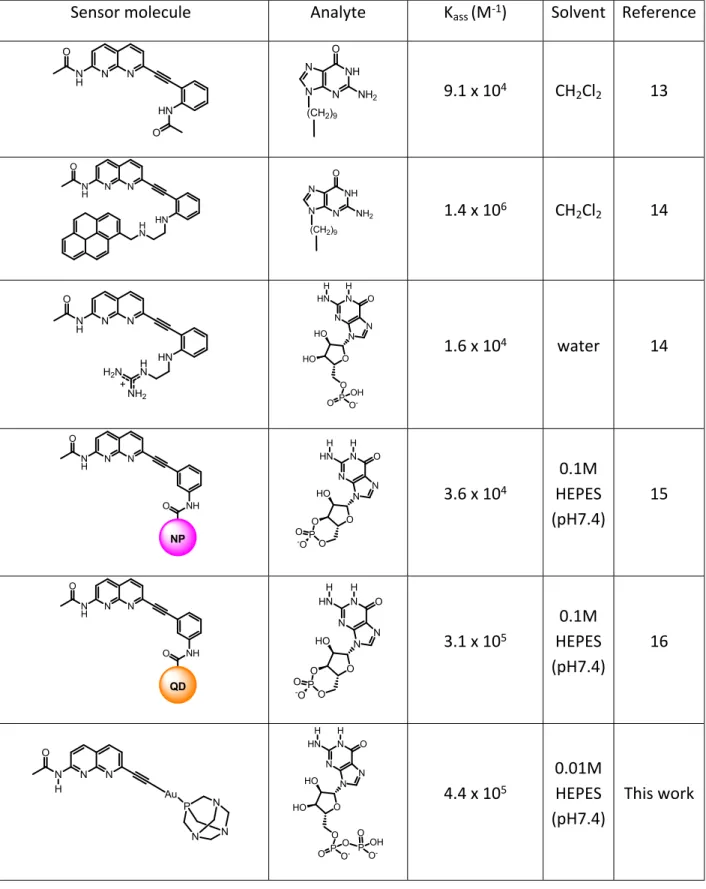
Table S3. Association constants for naphthyridine sensor systems towards Guanine derivatives reported in the literature.
Sensor molecule Analyte Kass (M-1) Solvent Reference
N N N H O HN O N N N NH2 NH O (CH2)9 9.1 x 10⁴ CH2Cl2 13 N N N H O HN H N N N N NH2 NH O (CH2)9 1.4 x 10⁶ CH2Cl2 14 N N N H O HN N H2N NH2 H + HO HO O N N O N HN N P O O OH O -H H 1.6 x 10⁴ water 14 N N N H O NH O NP O HO O N N O N HN N P O O -O H H 3.6 x 10⁴ 0.1M HEPES (pH7.4) 15 N N N H O NH O QD O HO O N N O N HN N P O O -O H H 3.1 x 10⁵ 0.1M HEPES (pH7.4) 16 N N N O H Au P N N N HO HO O N N O N HN N P O O O O -H H P O OH O -4.4 x 10⁵ 0.01M HEPES (pH7.4) This work
Table S4. Crystal data and structure refinement for complex 3.
Empirical formula C12 H9 N3 O
Formula weight 211.22
Temperature 110(2) K
Wavelength 0.71073 Å
Crystal system Monoclinic
Space group C 2/c
Unit cell dimensions a = 24.8320(8) Å α= 90°.
b = 7.2057(3) Å β= 108.7530(10)°. c = 12.0342(4) Å γ = 90°. Volume 2038.99(13) Å3 Z 8 Density (calculated) 1.376 Mg/m3 Absorption coefficient 0.092 mm-1 F(000) 880 Crystal size 0.200 x 0.100 x 0.100 mm3
Theta range for data collection 3.466 to 25.700°.
Index ranges -28<=h<=30, -8<=k<=8, -14<=l<=14
Reflections collected 16950
Independent reflections 1931 [R(int) = 0.0313] Completeness to theta = 25.242° 99.5 %
Refinement method Full-matrix least-squares on F2 Data / restraints / parameters 1931 / 0 / 150
Goodness-of-fit on F2 1.081
Final R indices [I>2sigma(I)] R1 = 0.0351, wR2 = 0.0959 R indices (all data) R1 = 0.0410, wR2 = 0.0986 Largest diff. peak and hole 0.257 and -0.217 e.Å-3
Fig. S25. ORTEP-3 diagram of complex 3, using 30% probability level ellipsoids.
Table S5. Atomic coordinates ( x 104) and equivalent isotropic displacement parameters (Å2x 10³) for complex 3. U(eq) is defined as one third of the trace of the orthogonalized Uij tensor.
x y z U(eq) N(2) 9602(1) 2211(2) 1051(1) 14(1) O(1) 11100(1) 4324(1) 659(1) 23(1) C(8) 8604(1) 445(2) -1725(1) 19(1) N(3) 8693(1) 1098(2) 632(1) 15(1) C(11) 7743(1) 114(2) 269(1) 18(1) C(7) 9133(1) 1495(2) 234(1) 13(1) N(1) 10510(1) 3271(2) 1640(1) 16(1) C(6) 9108(1) 1195(2) -943(1) 15(1) C(4) 10058(1) 2408(2) -445(1) 17(1) C(5) 9591(1) 1684(2) -1254(1) 18(1) C(3) 10047(1) 2634(2) 725(1) 14(1) C(10) 8221(1) 440(2) -141(1) 16(1) C(1) 11001(1) 4080(2) 1580(1) 18(1) C(9) 8161(1) 77(2) -1330(1) 19(1) C(2) 11411(1) 4644(2) 2743(1) 23(1) C(12) 7328(1) -130(2) 534(1) 23(1)
Table S6. Bond lengths [Å] and angles [°] for complex 3.
N(2)-C(3) 1.3205(15) N(2)-C(7) 1.3620(16) O(1)-C(1) 1.2235(16) C(8)-C(9) 1.3596(18) C(8)-C(6) 1.4089(18) C(8)-H(8) 0.9300 N(3)-C(10) 1.3286(16) N(3)-C(7) 1.3566(15) C(11)-C(12) 1.1855(18) C(11)-C(10) 1.4428(17) C(7)-C(6) 1.4139(17) N(1)-C(1) 1.3735(16) N(1)-C(3) 1.3901(16) N(1)-H(1) 0.891(16) C(6)-C(5) 1.4117(17) C(4)-C(5) 1.3557(18) C(4)-C(3) 1.4270(17) C(4)-H(4) 0.9300 C(5)-H(5) 0.9300 C(10)-C(9) 1.4140(18) C(1)-C(2) 1.4982(18) C(9)-H(9) 0.9300 C(2)-H(2A) 0.9600 C(2)-H(2B) 0.9600 C(2)-H(2C) 0.9600 C(12)-H(12) 0.9300 C(3)-N(2)-C(7) 118.44(10) C(9)-C(8)-C(6) 119.12(11) C(9)-C(8)-H(8) 120.4 C(6)-C(8)-H(8) 120.4 C(10)-N(3)-C(7) 117.23(10) C(12)-C(11)-C(10) 175.71(13) N(3)-C(7)-N(2) 115.06(10) N(3)-C(7)-C(6) 122.74(11) N(2)-C(7)-C(6) 122.19(11) C(1)-N(1)-C(3) 128.36(11) C(1)-N(1)-H(1) 118.7(9) C(3)-N(1)-H(1) 112.9(9) C(8)-C(6)-C(5) 124.49(11) C(8)-C(6)-C(7) 118.10(11) C(5)-C(6)-C(7) 117.41(11) C(5)-C(4)-C(3) 118.01(11) C(5)-C(4)-H(4) 121.0 C(3)-C(4)-H(4) 121.0 C(4)-C(5)-C(6) 120.57(11) C(4)-C(5)-H(5) 119.7 C(6)-C(5)-H(5) 119.7 N(2)-C(3)-N(1) 113.52(10) N(2)-C(3)-C(4) 123.35(11) N(1)-C(3)-C(4) 123.10(11) N(3)-C(10)-C(9) 123.83(11) N(3)-C(10)-C(11) 117.17(11) C(9)-C(10)-C(11) 118.99(11) O(1)-C(1)-N(1) 123.34(12) O(1)-C(1)-C(2) 122.18(11) N(1)-C(1)-C(2) 114.49(11) C(8)-C(9)-C(10) 118.94(12) C(8)-C(9)-H(9) 120.5 C(10)-C(9)-H(9) 120.5 C(1)-C(2)-H(2A) 109.5 C(1)-C(2)-H(2B) 109.5 H(2A)-C(2)-H(2B) 109.5 C(1)-C(2)-H(2C) 109.5 H(2A)-C(2)-H(2C) 109.5 H(2B)-C(2)-H(2C) 109.5 C(11)-C(12)-H(12) 180.0
Table S7. Torsion angles [°] for complex 3. C(10)-N(3)-C(7)-N(2) 178.38(11) C(10)-N(3)-C(7)-C(6) -1.48(18) C(3)-N(2)-C(7)-N(3) -179.87(10) C(3)-N(2)-C(7)-C(6) -0.01(18) C(9)-C(8)-C(6)-C(5) -178.17(12) C(9)-C(8)-C(6)-C(7) 1.34(19) N(3)-C(7)-C(6)-C(8) -0.26(19) N(2)-C(7)-C(6)-C(8) 179.89(11) N(3)-C(7)-C(6)-C(5) 179.28(11) N(2)-C(7)-C(6)-C(5) -0.57(18) C(3)-C(4)-C(5)-C(6) 0.78(19) C(8)-C(6)-C(5)-C(4) 179.65(12) C(7)-C(6)-C(5)-C(4) 0.14(19) C(7)-N(2)-C(3)-N(1) -177.17(10) C(7)-N(2)-C(3)-C(4) 1.03(18) C(1)-N(1)-C(3)-N(2) -169.36(12) C(1)-N(1)-C(3)-C(4) 12.4(2) C(5)-C(4)-C(3)-N(2) -1.43(19) C(5)-C(4)-C(3)-N(1) 176.59(12) C(7)-N(3)-C(10)-C(9) 2.23(19) C(7)-N(3)-C(10)-C(11) -176.73(11) C(3)-N(1)-C(1)-O(1) -1.4(2) C(3)-N(1)-C(1)-C(2) 178.74(12) C(6)-C(8)-C(9)-C(10) -0.68(19) N(3)-C(10)-C(9)-C(8) -1.2(2) C(11)-C(10)-C(9)-C(8) 177.76(12)
Table S8. Hydrogen bonds for complex 3 [Å and °].
D-H d(D-H) d(H..A) <DHA d(D..A) A C4-H4 0.930 2.276 119.97 2.856 O1
20
Table S9: XYZ coordinates and energies of adducts 6A and 6B models (kcal/mol)
6A (-6270.17) 1.C -7.861468 1.232261 0.131439 2.C -11.559018 3.174104 -0.141281 3.C -12.677393 2.367529 -0.172148 4.C -12.500427 0.957529 -0.109039 5.N -11.297241 0.370186 -0.021591 6.C -7.862769 2.668720 0.077668 7.C -9.062212 3.323399 -0.010897 8.C -10.277456 2.589090 -0.048994 9.C -10.183892 1.155638 0.009620 10.N -8.990816 0.508779 0.098260 11.H -11.651699 4.257752 -0.187283 12.H -13.679991 2.777286 -0.242585 13.C -13.646252 0.100321 -0.138896 14.H -9.093995 4.410721 -0.053644 15.H -6.913100 3.186319 0.107738 16.C -14.626728 -0.607493 -0.165395 17.H -15.491653 -1.232112 -0.187660 18.N -6.692753 0.499088 0.220823 19.C -5.371781 0.966793 0.282362 20.C -4.347672 -0.146195 0.434262 21.O -5.060949 2.154395 0.241251 22.H -3.364743 0.249802 0.171814 23.H -4.596089 -1.024186 -0.168767 24.H -4.331171 -0.474814 1.482012 25.H -6.810179 -0.539070 0.234685 26.N -9.015048 -2.518943 0.124360 27.C -10.178220 -3.264944 0.065738 28.N -10.187063 -4.596705 0.019975 29.C -8.947757 -5.132415 0.043877 30.C -7.703754 -4.476128 0.109132 31.C -7.698592 -3.046205 0.154017 32.N -8.634525 -6.476388 0.009105 33.C -7.241038 -6.571676 0.055854 34.N -6.657130 -5.395735 0.115639 35.O -6.723473 -2.271150 0.211657 36.N -11.341985 -2.575150 0.067889 37.H -9.073734 -1.484168 0.137318 38.H -9.306026 -7.234043 -0.037848 39.H -6.737946 -7.530882 0.041395 40.H -12.196207 -3.105023 -0.030597 41.H -11.358440 -1.546859 0.034660
6B (-6244.99) 1.C -7.958065 1.663219 0.212870 2.C -11.719758 3.334714 -0.417584 3.C -12.770198 2.448592 -0.482707 4.C -12.506228 1.054630 -0.318989 5.N -11.278261 0.560557 -0.122851 6.C -8.031265 3.086880 0.118014 7.C -9.258661 3.669853 -0.089006 8.C -10.408101 2.846036 -0.202042 9.C -10.225035 1.424064 -0.075013 10.N -9.003695 0.862667 0.133423 11.H -11.884941 4.405296 -0.526302 12.H -13.790832 2.780173 -0.646573 13.C -13.590207 0.122756 -0.358615 14.H -9.358210 4.750011 -0.178006 15.H -7.125365 3.684167 0.185788 16.C -14.513247 -0.657299 -0.396017 17.H -15.315809 -1.360158 -0.431915 18.N -6.692508 1.073798 0.450427 19.C -6.150806 -0.029902 -0.216963 20.C -4.882783 -0.585857 0.417575 21.O -6.649736 -0.510411 -1.224247 22.H -5.128331 -1.569137 0.837203 23.H -4.472966 0.044786 1.213523 24.H -4.128534 -0.735426 -0.361064 25.H -6.079094 1.566581 1.089588 26.N -8.146014 -5.076912 0.010576 27.C -7.861779 -3.781497 -0.369635 28.N -8.719088 -2.793693 -0.246159 29.C -9.904507 -3.171004 0.298164 30.C -10.313376 -4.451603 0.718016 31.C -9.391107 -5.551388 0.594133 32.N -10.977836 -2.345057 0.530694 33.C -11.977020 -3.142852 1.071812 34.N -11.617258 -4.407580 1.202126 35.O -9.493396 -6.738358 0.891388 36.N -6.587279 -3.511957 -0.849455 37.H -7.429844 -5.796502 -0.052216 38.H -11.021770 -1.340195 0.302432 39.H -12.940904 -2.731368 1.343497 40.H -6.526546 -2.570867 -1.249053 41.H -6.150734 -4.236014 -1.411244
Table of Contents (TOC)
Aggregation Induced Emission from a new
Naphthyridine-Gold(I) Complex as a potential tool for sensing Guanosine
Nucleotides in Aqueous Media
Artur J. Moro,a* João Avó,b Marc Malfois,c Francesco Zaccaria,d Célia Fonseca Guerra,d
Francisco J. Caparrós,e,,f Laura Rodríguez,e,,f and João Carlos Limaa
A new organometallic alkynyl-gold(I) complex, bearing a naphthyridine fluorophore is herein presented. The complex is shown to exhibit Aggregation Induced Emission, which is disrupted in the presence of Guanosine nucleotides, via complementary hydrogen bonding with the naphthyridine group in aqueous environment, attesting its potential as luminescent sensor for these nucleotides.
ethynyl-Gold(I) Complex as a potential tool for sensing
Guanosine Nucleotides in Aqueous Media
Artur J. Moro,a* João Avó,b Marc Malfois,c Francesco Zaccaria,d,e Célia Fonseca Guerra,d,f
Francisco J. Caparrós,g,h Laura Rodríguez,g,h and João Carlos Limaa
a LAQV-REQUIMTE, Departamento de Química, CQFB, Universidade Nova de Lisboa,
Monte de Caparica, Portugal. E-mail:[email protected]
bInstituto Superior Técnico, Universidade de Lisboa,
cALBA Synchrotron Light Laboratory (CELLS), Carrer de la Llum 2−26, 08290
Cerdanyola del Vallès, Barcelona, Spain
dDepartment of Theoretical Chemistry, Amsterdam Center for Multiscale Modeling, Vrije
Universiteit Amsterdam, De Boelelaan 1083, 1081 HV Amsterdam, The Netherlands
e Present address: Department of Nanochemistry, Istituto Italiano di Tecnologia, Via
Morego 30, 16163, Genova, Italy
fLeiden Institute of Chemistry, Gorlaeus Laboratories, Leiden University, Einsteinweg 55,
2333 CC Leiden, The Netherlands.
gDepartament de Química Inorgànica i Orgànica. Secció de Química Inorgànica.
Universitat de Barcelona, Martí i Franquès 1-11, 08028 Barcelona, Spain.
h Institut de Nanociència i Nanotecnologia (IN2UB). Universitat de Barcelona, 08028
A new organometallic alkynyl-gold(I) complex, capable of exhibiting Aggregation Induced Emission was designed and synthesized. The linear complex structure possesses a central Au(I) atom, bearing two axial ligands: (1) 1,3,5-Triaza-7-phosphaadamantane; and (2) 2-acetamido-7-ethynyl-1,8-naphthyridine. While the former accounts for its partial solubility in aqueous environment, the latter acts as a receptor unit for binding guanosine nucleotides and derivatives via multiple hydrogen bonding. At high concentrations, aggregation of the complex was observed by the formation of new absorption (λmax ~ 400 nm) and emission bands (550-700 nm). Formation of aggregates of ca. 60 nm diameter was confirmed with Small Angle X-Ray Scattering (SAXS). Disruption of the aggregates in the presence of guanosine derivatives resulted in a ratiometric signal with apparent association constants in the order of 105 M-1 and high sensitivity (around 63% signal change) which are, to the best of our knowledge, in line with the highest recorded for nucleotide sensing based on hydrogen bonding that are capable of working in water. Computational studies indicate the presence of additional hydrogen bonding interactions that account for the strong binding of the Au(I) complex to phosphorylated Guanosine nucleotides.
Keywords: naphthyridine; gold(I) complexes; guanosine sensors; Aggregation Induced Emission.
Over the past years, research on alkynyl-gold(I) complexes (AGCs) has experienced a significant growth, mainly due to their luminescent properties, which confers them with outstanding potential for several applications, including molecular electronics and materials science.1-3
AGCs are linear complexes, with a central Au(I) bound to two axial ligands, one of which is a terminal alkyne. The general strategy for obtaining luminescent AGCs relies on the fact that one of the ligands is, in fact, a fluorophore by itself whose triplet emission is strongly increased due to the strong heavy atom effect induced by Au(I) which favors Inter-System Crossing (ISC).1,4
A particular feature from AGCs that has attracted significant attention from several research groups is their ability to self-assemble in aqueous solution through the formation of intermolecular aurophilic bonds, i.e. between two Au(I) atoms5, which comparable to strong hydrogen bonds.6,7 This self-assembly into larger supramolecular aggregates can promote additional interactions between alkynyl ligands from neighboring complexes, such as π-π stacking, which can originate new luminescence bands, resulting in Aggregation Induced Emission (AIE).8,9
The structure of the alkynyl ligands strongly influences both the luminescence as well as the size and shape of the obtained supramolecules.10 Furthermore, factors such as concentration, solvent polarity, temperature are known to have a significant impact on the kinetics and thermodynamics of aggregation process, which hinders the full control of this phenomenon.11 Recently, our group has reported a series of AGCs bearing fluorophores capable of coordinating divalent metal ions.12 AGCs were found to aggregate in aqueous medium, producing luminescent structures with red emission. However, upon addition of Zn(II), the aggregates were disrupted and recovered their non-aggregated optical properties. Moreover, further addition of a stronger chelating agent (cryptand) allowed for the aggregation to take place once more, thus proving the control of this phenomenon by external stimuli.
Taking this into account, we aim to use the same strategy, i.e. aggregation/de-aggregation as a tool for sensing Guanosine nucleotides based on complementary hydrogen bonding (Watson-Crick interactions). With this in mind, we designed a new AGC possessing a
2-complementarity in hydrogen bonding with Guanine nucleobase (fig. 1b). N N R N O N N N NH N O H H H N N N H O Au P N N N Guanine 2-acetamido-1,8-naphthyridine
a)
b)
Figure 1. a) Structure of the designed AGC; b) Complementary hydrogen-bonding (red) between 2-acetamido-1,8-naphthyridine and guanine.
However, these sensor systems generally present poor water solubility and/or low sensitivity for detecting nucleotides in aqueous media, due to the competition of solvent molecules for the naphthyridine binding sites.13,14 Only few systems capable of performing in water have been reported, and these require complex architectures (nanoparticles with embedded reference dyes/quantum dots) for obtaining a reproducible response.15,16
In this work, we designed an ethynyl-naphthyridine ligand and coupled it with a gold(I) complex, PTA–Au(I)–Cl (PTA = 1,3,5-Triaza-7-phosphaadamantane, highlighted in blue, figure 1a). The synthesis of this complex had three main goals: (1) to improve the solubility of the naphthyridine moiety in water, in order to perform binding with nucleotides in an aqueous environment, a desirable feature when considering biological applications; (2) to shift the luminescence properties to the visible/red region of the UV spectrum, as a result of its supramolecular self-assembling capabilities; (3) to assess the possibility of using the aggregation/de-aggregation capabilities to detect the presence of Guanosine derivatives, based on the complementary hydrogen bonding of the naphthyridine moiety.
2.1. General
All solvents used were of spectroscopic grade. All reagents were purchased from Sigma-Aldrich and used as such without further purification. NMR spectra were recorded on a Bruker Advance III 400 spectrometer (400 MHz for 1H, 101 MHz for 13C, and 161.9 MHz for 31P) at 298 K.
2.2. Synthesis
The synthesis of 2-acetamido-7-chloro-1,8-naphthyridine was performed according to reported literature procedures.17
2.2.1. Synthesis of 2-acetamido-7-(ethynyl-[trimethylsilyl])-1,8-naphthyridine (1)
500 mg of 2-acetamido-7-chloro-1,8-naphthyridine (2.3 mmol), 226 mg of trimethylsilylacetylene (2.3 mmol), 62.8 mg of PdCl2(PPh3)2 (0.09 mmol) and 30.3 mg of CuI (0.16 mmol) were added to a 50 ml round-bottom flask equipped with a magnetic stirrer bar and a rubber seal. Under inert atmosphere, dry THF (12 ml) and dry triethylamine (3.39 ml, 24.3 mmol) were added to the flask. The reaction was left stirring overnight. The mixture was then filtered over a plug of celite and THF was removed in a rotary evaporator. The residue was purified on a Silica-Gel 60 flash chromatography (dichloromethane/acetone 9:1,
Rf =0.31), yielding 300 mg of pure 1 (ɳ=47%). 1H-NMR (400 MHz, CDCl3): δ 9.79 (s, 1H), 8.57 (d, J = 8.9 Hz, 1H), 8.18 (d, J = 8.9 Hz, 1H), 8.09 (d, J = 8.2 Hz, 1H), 7.52 (d, J = 8.2 Hz, 1H), 2.36 (s, 3H), 0.31 (s, 9H).13C NMR (101 MHz, CDCl 3) δ 170.36, 170.36, 154.81, 154.45, 146.26, 138.88, 136.63, 124.09, 119.89, 116.26, 103.87, 97.74, 25.11, -0.35. 2.2.2. Synthesis of 2-acetamido-7-ethynyl-1,8-naphthyridine (2)
Compound 1 (280 mg, 0.99 mmol) was dissolved in a mixture of THF (10 ml) and water (1 ml). The solution was cooled to 0ºC in an ice bath and tetrabutylammonium fluoride (2.2ml, from a 1M solution in THF) was added. The mixture was left to stir at room temperature until TLC revealed full consumption of the reagents (30 min.), at which point solvents were removed in a rotary evaporator. The residue was ressuspended in CH2Cl2 (10 ml), washed
2 2 f
180 mg of 2 (86%) as a light brown powder. A small fraction was dissolved in CHCl3 which, by slow evaporation, resulted in the formation of crystals (see Supporting Information for crystallography data).1H NMR (400 MHz, DMSO) δ 11.11 (s, 1H), 8.44 – 8.38 (m, 3H), 7.61 (d, J = 8.1 Hz, 1H), 4.56 (s, 1H), 2.19 (s, 3H). 13C NMR (101 MHz, DMSO) δ 170.79, 155.47, 154.91, 145.42, 139.82, 138.24, 124.13, 120.13, 115.97, 83.98, 82.40, 24.68. Elemental analysis for C12H9N3O (211.22): calcd C 68.24, H 4.29, N 19.89%; found: C 68.22, H 4.35, N 19.65%.
2.2.3. Synthesis of Au(I) complex (3)
Solid KOH (11.2 mg, 0.2 mmol) was added to a solution of 2 (22.5 mg, 0.1 mmol) in methanol (5 ml). After 5 min of stirring a dichloromethane solution (5 ml) of [AuCl(PTA)] (39.0 mg, 0.1 mmol) was added and the solution was maintained at room temperature protected from light with aluminium foil. After 2 hours of stirring, the solution was concentrated to ca. 2 ml and hexane (5 ml) was added to precipitate a pale yellow solid which was filtered and obtained in 60% yield (34 mg, 0.06 mmol). 1H NMR (500 MHz, DMSO) δ 10.91 (s, 1H), 8.24 – 8.19 (m, 2H), 8.12 (d, J = 8.3 Hz, 1H), 7.26 (d, J = 8.2 Hz, 1H), 4.45 (d, J = 12.7 Hz, 3H), 4.28 (d, J = 13.2 Hz, 3H), 4.24 (s, 6H), 2.08 (s, 3H). 13C NMR (126 MHz, DMSO) δ 170.64, 155.24, 154.93, 148.07, 139.51, 137.13, 124.72, 119.02, 114.67, 72.27, 51.23, 51.07, 24.64. 31P{1H} NMR (161.9 MHz, DMSO-d 6, ppm): -49.2 (s). IR (KBr, cm-1): 2104 (CC), 1641 (C=N). HR-ES-MS (+) m/z: 565.1177 ([M + H+]+, calc: 565.1180).
2.3. UV/Vis and fluorescence spectroscopies
Absorption spectra were obtained in a 1 cm quartz cuvette in acetonitrile on a Varian Cary 100 Bio UV- spectrophotometer. Emission spectra in solution were obtained in fluorescence quartz cuvette 1 cm, using a Horiba-Jobin-Yvon SPEX Fluorolog 3.22 spectrofluorimeter. Solid state emission spectra were acquired in the same apparatus, and the samples were obtained by dropcasting a acetonitrile solution onto a quartz plate.
Luminescence measurements at 77K were performed in the same spectrofluorimeter, equipped with a cryogenic support with liquid nitrogen, in a glass tube. Association constants
2.4. Small-Angle X-Ray Scattering (SAXS)
SAXS data have been performed on the NCD beamline at the synchrotron ALBA at 12.4 keV and the distance sample/detector was 2.2m to cover the range of momentum transfer 0.09 < q <5.6 nm-1. The data were collected on an ImXPad S1400 detector with a pixel size of 130.0x130.0m2. The exposure time was 10s. The q-axis calibration was obtained by measuring silver behenate.18 The program pyFAI19 was used to integrate the 2D SAXS data into 1D data. The data were then subtracted by the background using PRIMUS software.20 The maximum particle dimension Dmax and the pair-distance distribution function P(r) were determined with GNOM.21 The low-resolution structure of the aggregates was reconstructed ab initio from the initial portions of the scattering patterns using the program DAMMIN.22,23
1·10-4 M and 1·10-5 M solutions of complex 3 were prepared in two different water/DMSO mixtures: 90:10 and 0:100.
2.5. Computational Methods
All calculations have been performed using the Amsterdam Density Functional (ADF) program and dispersion-corrected density functional theory (DFT-D3-BJ) at BLYP/TZ2P in gasphase. No symmetry constraint has been imposed. For interactions between ligand 2 and Guanine, only two matches have been reported since Guanine is characterized by a certain structural rigidity and therefore no other association could reasonably be probed.
ΔEBond, the energetic parameter hereby used to estimate the strength of the bonding between chemical structures is expressed as:
(equation 1) ∆𝐸𝐵𝑜𝑛𝑑= 𝐸𝑎𝑑𝑑𝑢𝑐𝑡― 𝐸1― 𝐸2
where E(adduct) is the total bonding energy of the optimized complex and, in turn, E(structure 1) and E(structure 2) represents the energy of each of the chemical structures that compose the adduct, both individually optimized.
3.1. Synthesis
The structure of Au(I) complex for sensing Guanosine nucleotides was designed to present (1) Aggregation Induced Emission (AIE) and (2) strong affinity to Guanosine derivatives via Watson-Crick base-pairing interactions. With respect to the first point, we selected a specific phosphine, namely 1,3,5-Triaza-7-phosphaadamantane (PTA), which coordinates with Au(I) atoms and is able to increase solubility of the final complex in water.24 2-acetamido-1,8-Naphthyridine chromophore was selected for its perfect triple-hydrogen bonding complementarity with Guanine nucleobase.12,13 Figure 2 illustrates the full synthetic pathway for the desired Au(I) complex.
N N N H Cl O CuI, PdCl 2(PPh3)2 Si TBAF THF/H2O, 0ºC N N N H O P Au Cl N N N , KOH N N N H O Au P N N N N N N H O Si dry THF, rt 1 2 3
Figure 2. Synthetic pathway for obtaining PTA-Au(I)-(2-acetamido-7-ethynyl-1,8-naphthyridine) complex 3.
The starting 2-acetamido-7-chloro-1,8-naphthyridine was synthesized according to previously established procedures.17 Addition of an ethynyl moiety was performed via Sonogashira coupling with ethynyl-(trimethyl)silane (1), with subsequent removal of TMS with tetrabutylammonium fluoride, yielding crystals of compound 2 from chloroform (see Supporting Information for crystal data and NMR, figs. S1-S5 and tables S1, S4-S7). The obtained crystal structure shows a nearly perfect planarity of the naphthyridine moiety, ideal for the required complementarity with Guanine.
Information).
3.2. Aggregation studies in water
3.2.1. UV-Vis and fluorescence spectroscopy
Given that detection of nucleotides is to be performed in aqueous media, the influence of concentration increase in the optical properties of 3 in water was assessed.
As can be seen in the UV-Vis spectra (fig. S13), upon increasing the concentration of 3, an increase in the optical density at longer wavelengths (above 500 nm) is observed, which indicates a higher turbidity of the sample, a typical observation when precipitation or aggregation takes place.25 Moreover, a band at around 400 nm becomes more prominent. The absorption from this band follows the same linear trend as the maximum absorption, and may be related to a metal-to-ligand- or ligand-to-metal-charge-transfer transition.
In the corresponding emission spectrum (fig. 3), if we excite the naphthyridine fluorophore at its strongest absorption band (λexc = 343 nm, corresponding to the left shoulder of the band), we obtain a strong emission band with maximum intensity at 385 nm, corresponding to the fluorescence of naphthyridine, and low intensity bands at around 450 nm, 490 nm and 550 nm (fig. 3A). The overall intensity of the spectra reaches a plateau at concentrations above 50 µM, probably due to the increase of inner-filter and self-quenching effects (fig. 3B).
When the sample is excited at λexc = 400 nm, we obtain the previously observed band at 450 nm (fig. 3C), with a similar trend as the one shown in fig. 3B. Moreover, an increase in the intensity between 550 to 600 nm occurs along the studied concentration range, in two incremental steps (fig. 3D). Intersecting the linear trendlines from the two steps yields the Critical Aggregation Concentration (CAC), i.e., the concentration at which aggregation starts to occur, corresponding to 25.1 µM. For this reason, this band was attributed to AIE from complex 3.
400 500 600 700 0.0 0.2 0.4 0.6 0.8 1.0 I ( no rm .) Wavelength (nm) 0 10 20 30 40 50 0.0 0.2 0.4 0.6 0.8 I (385 nm) I ( no rm .) [3] (M) 400 500 600 700 0.0 0.2 0.4 0.6 0.8 1.0 I ( no rm .) Wavelength (nm) 0 10 20 30 40 50 0.0 0.2 0.4 0.6 0.8 1.0 I (440 nm) I (600 nm) I ( no rm .) [3] (M)
Figure 3. Emission spectra of 3 in water at different concentrations: (A) excitation at 343 nm or (C) 400 nm. Respective insets (B and D) show variations at the maximum peak of each spectrum.
In order to gain further insight on the origin of all the observed emission bands, emission spectra of 2 and 3 in methanol were recorded at room temperature and at 77K (fig. S14) (methanol was used due to poor water solubility of 2).
At room temperature, the emission pattern of complex 3 was red-shifted by ca. 16-20 nm when compared to 2. At 77K, ligand 2 exhibits the fluorescence band at 385 nm with vibrational structure, and an additional transition with vibrational resolution was observed with peaks at 441, 472 and 503 nm, tentatively assigned as triplet emission. In contrast, complex 3 displayed almost negligible fluorescence (λmax ~ 395nm), and a strong emission with vibrational structure in the range 440-600 nm. In fact, the vibrational structure of this emission is identical to the triplet emission of ligand 2, although slightly red shifted (457,
y = 0.0040x + 0.0028 R2 = 0.986
y = 0.0077x - 0.0956 R2 = 0.993
induced by the Au(I) center, which promotes Inter-System Crossing (ISC) to the triplet state of the chromophore.
To better mimic the aggregation of 3 in aqueous solution observed in the emission spectra (see fig. 3C above), further experiments at 77K were performed in water. Figure S15 depicts the emission spectra obtained for an aqueous solution of 3 at 10 µM and 90 µM upon excitation at 343 nm and 400 nm. It is evidenced that the increase in concentration leads to a marked increase in the emission at 510 and 550 nm at both excitation wavelengths, while the emission below 500 nm does not change significantly. These results suggest that the complex spectra are composed by the phosphorescence of the “free” complex molecules, below 500 nm, and the phosphorescence of the aggregates, above 510 nm.
Steady-state emission spectra of 3 were also recorded in the solid state at room temperature. Excitation at 320 nm yielded emission bands at 383 and 600 nm, matching the monomer and aggregates bands recorded in solution, respectively (fig. S16A). Excitation at 400 nm yielded only the latter emission band (fig. S16B). This emission band was found to be highly sensitive to oxygen, increasing significantly upon degassing the sample. This suggests that the “aggregates” emission arises from triplet states and is either a delayed fluorescence (DF) or room-temperature phosphorescence (RTP).
Time-resolved spectra of 3 were also acquired, both in solid state and in aqueous solution (fig. S17 and S18). In the solid state, excitation at 320 nm reveals emission bands at 470 and 500 nm, and a strong emission at around 600 nm (identical to that of fig. S16). Decay analysis of emission maxima at 470 and 600 nm fit to a bi-exponential function, with a short lifetime similar for both wavelengths (0.12 and 0.14 ms for 470 and 600 nm, respectively, fig. S17B), and a longer lifetime component which is two times faster for 470 nm (0.37 ms) than for 600 nm (0.76 ms). These results suggest that the two emission bands arise from different states, and they can, thus, be attributed to the phosphoresce of “free” complex 3 and to the DF or RTP of the aggregates of complex 3.
In solution, time-resolved spectra acquired at a concentration of 90 μM revealed only the 600 nm emission, with a single exponential decay of 0.10 ms (fig. S18). Given the similarity in the location and lifetime of the bands with the solid state sample, this is a clear indication
3.2.2. Small-Angle X-Ray Scattering (SAXS)
The formation of aggregates was analyzed by SAXS. Measurements were performed for 1 × 10⁻⁵ and 1 × 10⁻⁴ M solutions of 3 in different H
2O/DMSO proportions. Low-resolution structures were reconstructed ab initio from the scattering patterns using the DAMMIN program22,23 (fig. 4 and S19).
Figure 4. Low resolution structures obtained from SAXS measurements of 3 at 1 x 10⁻⁴ M in 100% DMSO (left,
in blue) and 10% DMSO / 90% H2O mixture (right, white). Two views are shown, shifted by ca. 90º, for
clarification of the overall shape.
This technique indicates that aggregates can exist in the different H2O/DMSO mixtures of the solvents, both at 10 and 100 µM. At the latter concentration, a shoulder at 400 nm is always present, regardless of the DMSO content, which is also consistent with the formation of aggregates. However, no aggregates emission is observed for DMSO percentages above 25% (fig. S20). Additionally, these results show that, for the studied solvent mixtures, the structures present similar shape and comparable sizes, although in water the structures are slightly smaller. As such, the loss in emission of the aggregates at higher DMSO content may be related with (1) different types/conformation of aggregates as previously observed in other AGCs11; and (2) lower overall concentration of aggregates, which translates into a weaker AIE effect.
3.3.1. Influence of Guanosine nucleotides on the optical properties of 3
The absorption and emission spectra of 3 in the presence of several Guanosine nucleotides, GMP, GDP and GTP, were tested in buffered aqueous media (pH 7.2-7.4, where the nucleotides are fully deprotonated) at two concentrations: 10 µM, below CAC; and 60 µM, above CAC.
In the case of the least concentrated solutions (10 µM), for all Guanosine derivatives, the response was similar: negligible changes in the absorption spectra and an emission increase of 20-24% at 383 nm (fig. S21). No aggregates band was observed in any of the samples. For the concentrated solution of 3 (60 µM), both the absorption as well as the emission spectra were strongly influenced by the presence of Guanosine derivatives, although to different extents. The specific case of Guanosine 5’-monophosphate (GMP) is shown below (fig. 5). 400 500 600 700 0.2 0.4 0.6 0.8 1.0 0 250 0.4 0.6 0.8 1.0 Experimental data Fit I60 0 n m / I45 0 n m [GMP] (M) I ( n o rm .) Wavelength (nm)
Figure 5. Variation of emission (B, λexc = 400 nm) of 3 (60 µM in 10 mM HEPES buffer at pH 7.2) in the
presence of Guanosine 5’-monophosphate (GMP). Inset shows the ratio between the emissions at 600 and 450 nm.
being disrupted (fig. S22).
In the emission spectra, an increase in intensity at 450 nm occurs with increasing concentrations of analyte (this is also observed when exciting the samples at 343 nm, fig. S23). Moreover, a concomitant decrease in the emission band of the aggregates (~600 nm) is observed (fig. 5). This effect becomes weaker as we increase the number of phosphates in the nucleotide, indicating that electrostatic repulsion may play a role on the loss of sensitivity of 3 towards more charged Guanosines (fig. S24).
If we plot the ratio of luminescence between the bands at 600 nm and 450 nm, we obtain a system that behaves as a 1:1 association equilibrium between 3 and the analyte, yielding association constants in the order of 105 M-1 (Table 1), which are, to the best of our knowledge, among the highest recorded for chemosensors based on hydrogen bonding capable of working in aqueous environment (see table S3 for comparison with the literature). Furthermore, the strong signal changes upon analyte binding reach up to 63% variation when compared to the absence thereof, which further highlights the unprecedented sensitivity of this system in aqueous environment.
Table 1. Apparent association constants and percentage in signal change (Δ[%]) of Guanosine nucleotides with 3 ([3]=60 μM).
Analyte Ka (105 M-1) Δ[%]
GMP 1.46 63.3
GDP 4.42 42.0
GTP 1.69 28.7
The values for association constants are within the same order of magnitude for the three studied Guanosine derivatives, being higher for GDP. However, the percentage in signal change (Δ[%]) varies with increasing number of phosphate groups (GMP > GDP > GTP), which suggests that the negative charges or bulkiness/sterical effects have a significant influence on the overall emission of the aggregates.
16
3.3.2. Computational studies
Naphthyridines have already been reported in the literature as fluorescent units capable of forming stable bonds with guanine derivatives.11-14 To better understand the specific mode with which our ligand binds to guanine, a series of computational experiments were performed.
We have analyzed two different interaction modes (depicted A and B) by which ligand 2 and Guanine could interact via hydrogen bonding (fig. 6).
N N N O HN N N N N O O NH2 HO O N N N N O H H H H H Guanine L-Glutamine N N N O N OH O H H H O H2N N N N O H O NH2 NH2 O O H N N N O H N N N O H O N N H H H H GlnL2 GlnL3 GlnL4 O N H H N H H O OH GlnL1 N N N N N O N N H O H H H N H GL2 GL1 H H
Fig 1: Schematic and ball & sticks representation of analyzed species
Figure 6. Ball & stick representation of two interactions modes, A and B, as possible adducts formed between
2 and Guanine, illustrating the complementarity of hydrogen bonds.
The schematic representation of model A was found to be significantly more stable, since it involves three hydrogen bonding interactions, yielding a complex adduct with nearly perfect planarity, while B comprises only 2 hydrogen bonds (see Table S2, in the Supp. Information). Absorption and emission spectra of 2 in the presence of increasing amounts of Guanine are indicative of this strong interaction, yielding an association constant of 4.2 x 10⁵ M-1 (fig. S25).
In order to gain further insight on why the association of 3 and phosphorylated Guanosine nucleotides is higher, additional energy calculations were also conducted for the adduct formed from 3 and GMP (fig. 7).
1.66 3.14 2.41 2.34 1.79 1.94 1.86
Figure 7. Ball & stick representation of the adduct from 3 and GMP. Hydrogen bonding interactions are highlighted, with their respective distances.
Apart from the complementary hydrogen bonds between the naphthyridine ligand and the nucleobase, additional hydrogen bonds are present, between the phosphine ligand and both the sugar and phosphate moieties of the nucleotide. Furthermore, one hydrogens from the guanine nucleobase may also interact with the Au(I) metal center of 3, given their close proximity (~3 Å). The resulting conformation yields an adduct with a significantly higher stabilization than the adduct formed between 2 and Guanine. The energetic parameter ΔEBond for all adducts is summarized in table 2.
Table 2. ΔEBond (kcal/mol) at BLYP-D3/TZ2P in gasphase for all studied adducts.
Adduct ΔEBond
Fig. 6A -29.9
Fig. 6B -4.8
A new Naphthyridine-ethynyl-Gold(I) complex 3 was synthesized and its structure fully characterized. UV-Vis spectra recorded in water at higher concentrations showed an increase in the baseline, indicating the presence of aggregation. The corresponding emission spectra revealed the appearance of a band with maximum at 550-600 nm, which was absent when the spectra were acquired in a good solvent (DMSO). This Aggregation Induced Emission (AIE) was probably favored by intermolecular (1) π-π interactions and (2) aurophilic interactions. Comparison of the emission bands with solid state samples led us to conclude that the AIE band observed in water solutions results from higher aggregates in suspension, since both the position and the lifetimes are essentially the same. Formation of aggregates of around 60 nm diameter was confirmed by SAXS experiments.
Interaction of complex 3 with Guanine derivatives in aqueous media quenched the luminescence of the aggregates while simultaneously increasing the luminescence of free complex, which suggest that the formation of hydrogen bonds with naphthyridine ligand disrupted intermolecular aurophilic bonds, thus diminishing AIE. Apparent association constants and sensitivity (signal variation) were found to be among the highest involving hydrogen bonding sensors in water, to be best of our knowledge. Computational studies comparing adducts formed by the pairs 2/Guanine and 3/GMP have further evidenced the strong binding nature of 3 towards phosphorylated Guanosine nucleotides.
The aggregation phenomena of AGCs and their inherent luminescence properties in aqueous environment provide an additional tool for sensing applications based on hydrogen bonding, capable of circumventing the intrinsic competition of water molecules for H-binding sites.
This work was supported by the Associate Laboratory for Green Chemistry- LAQV which is financed by national funds from FCT/MCTES (UID/QUI/50006/2019). The authors are also grateful to the Ministry of Economy, Industry and Competitiveness of Spain (AEI/FEDER, UE Projects CTQ2016-76120-P). SAXS experiments were performed at the NCD-BL11 beamline of the ALBA Synchrotron Light Facility in collaboration with the ALBA staff. A.J.M. and J.A. thank FCT for postdoctoral grants (SFRH/BPD/69210/2010 and SFRH/BPD/120599/2016, respectively). The NMR spectrometers are part of The National NMR Facility, supported by FCT/MCTES (RECI/BBB-BQB/0230/2012).
2. R. Chico, E. Castillejos, P. Serp, S. Coco, P. Espinet, Inorg. Chem., 2011, 50, 8654–8662. 3. A. M. Kuchison, M. O. Wolf, B. O. Patrick, Inorg. Chem., 2010, 49, 8802–8812.
4. J. C. Lima, L. Rodríguez, Chem. Soc. Rev., 2011, 40, 5442-5456.
5. R. Gavara, J. Llorca, J. C. Lima, L. Rodríguez, Chem. Commun., 2013, 49, 72-74. 6. T. Steiner, Angew. Chem. Int. Ed., 2002, 41, 48-76.
7. D. Blasco, J. M. López-de-Luzuriaga, M. Monge, M. E. Olmos, D. Pascual, M. Rodríguez-Castillo, Inorg. Chem., 2018, 57, 3805-3817
8. J. Mei, N. L. C. Leung, R. T. K. Kwok, J. W. Y. Lam, B. Z. Tang, Chem. Rev. 2015, 115, 11718– 11940.
9. A. Pinto, N. Svahn, J. C. Lima, L. Rodríguez, Dalton Trans., 2017, 46, 11125-11139.
10. E. Aguiló, R. Gavara, C. Baucells, M. Guitart, J. C. Lima, J. Llorca, L. Rodríguez, Dalton Trans. 2016, 45, 7328-7339.
11. R. Gavara, E. Aguiló, C. Fonseca Guerra, L. Rodríguez, J. C. Lima, Inorg. Chem., 2015, 54, 5195-5203.
12. E. Aguiló, A. J. Moro, R. Gavara, I. Alfonso, Y. Pérez, F. Zaccaria, C. Fonseca Guerra, M. Malfois, C. Baucells, M. Ferrer, J. C. Lima, L. Rodríguez, Inorg. Chem., 2018, 57, 1017–1028. 13. L. Shao-Hung, S. Srinivasan, F. Jim-Min, J. Org. Chem., 2007, 72, 117-122.
14. L. Shao-Hung, P. Riping, F. Jim-Min, Org. Lett., 2016, 18, 1724−1727.
15. P. J. Cywinski, A. J. Moro, T. Ritschel, N. Hildebrandt, H.-G. Löhmannsröben, Anal. Bioanal. Chem., 2011, 399, 1215–1222.
16. P. J. Cywinski, A. J. Moro, H.-G. Löhmannsröben, Biosens. Bioelectron., 2014, 52, 288–292. 17. P. S. Corbin, S. C. Zimmerman, P. A. Thiessen, N. A. Hawryluk, T. J. Murray, J. Am. Chem.
Soc., 2001, 123, 10475-10488.
18. T. C. Huang, H. Toraya, T. N. Blanton, Y. Wu, J. Appl. Crystallogr., 1993, 26, 180. 19. J. Kieffer, D. Karkoulis, J. Phys.: Conf. Ser., 2013, 425, 202012.
20. V. Konarev, V. V. Volkov, A. V. Sokolova, M. H. J. Koch, D. Svergun, D. I. J. Appl. Crystallogr., 2003, 36, 1277-1282.
22. D. I. Svergun, Biophys. J., 1999, 76, 2879-2886.
23. A. Krebs, H. Durchschlag, P. Zipper, Biophys. J., 2004, 87, 1173-1185.
24. J. M. Forward, Z. Assefa, J. P. Fackler, Jr., J. Am. Chem. Soc., 1995, 117, 9103-9104.
25. J. Arcau, V. Andermark, E. Aguiló, A. Gandioso, A. Moro, M. Cetina, J. C. Lima, K. Rissanen, I. Ott, L. Rodríguez, Dalton Trans., 2014, 43, 4426-4436.
26. A. J. Moro, B. Rome, E. Aguiló, J. Arcau, R. Puttreddy, K. Rissanen, J. C. Lima, L. Rodriguez, Org. Biomol. Chem., 2015, 13, 2026-2033.