UNIVERSITÀ DEGLI STUDI DI NAPOLI “FEDERICO II”
SCUOLA DI MEDICINA E CHIRURGIA
Dipartimento di Neuroscienze, Sicenze Riproduttive ed Odontostomatologiche
DOTTORATO IN NEUROSCIENZE – XXXI CICLO
Coordinatore: Prof. Maurizio Taglialatela
TESI DI DOTTORATO IN NEUROSCIENZE
Post mortem and in vivo study of multiple sclerosis pathogenesis
RELATORE CANDIDATO
Prof. Dott.
Vincenzo Brescia Morra Marcello Moccia
2
To my dad and to my sister,
a family source of scientific rigour
3
LIST OF ABBREVIATIONS
APC: antigen-presenting cell CNS: central nervous system CoQ10: coenzyme Q10
CSF: cerebrospinal fluid CSV: comma-separated values DMT: disease modifying treatment DTI: diffusion tensor imaging
EAE: experimental autoimmune encephalomyelitis EDSS: expanded disability status scale
fMRI: functional magnetic resonance imaging GM: grey matter
IFN: interferon-gamma IL: interleukin
MT: magnetization transfer MTR: magnetization transfer ratio MRI: magnetic resonance imaging MRS: magnetic resonance spectroscopy MS: multiple sclerosis
NA: normal-appearing ROI: region of interest TNF: tumor necrosis factor WM: white matter
4
Post mortem and in vivo study of multiple sclerosis pathogenesis
TABLE OF CONTENTS
1. Abstract p. 5
2. State of the art p. 8
3. Objectives p. 17
4. Defining the pathology of multiple sclerosis with latent-profile models
4.1 Introduction p. 18
4.2 Methods p. 19
4.3 Results p. 25
4.4 Discussion p. 29
5. Pathological correlates of magnetization transfer ratio in multiple sclerosis
5.1 Introduction p. 34
5.2 Methods p. 35
5.3 Results p. 41
5.4 Discussion p. 48
6.Peripheral markers of oxidative stress and inflammation in multiple sclerosis
6.1 Introduction p. 52
6.2 Methods p. 53
6.3 Results p. 61
6.4 Discussion p. 73
7. Conclusions and future perspectives p. 78
8. Acknowledgements p. 80
5
1. Abstract
Multiple Sclerosis (MS) is a chronic inflammatory disease of the central nervous system. A number of pathological mechanisms could be responsible for acute demyelination and chronic tissue remodelling in MS, including inflammation, oxidative stress, microglia activation, and astrocyte infiltrates. In the present work, we aim to further explore the heterogeneity of MS pathogenesis on
post mortem brains, and to evaluate the possibility to study MS pathogenesis by using magnetic
resonance imaging (MRI) and peripheral blood biomarkers.
In the first part of the study, we applied a data driven approach to classify MS patients in relation to the variety of pathological changes occurring in lesional and normal-appearing (NA) white matter (WM) and grey matter (GM), with subsequent clinical correlates. Tissue blocks from 16 MS brains were immunostained and quantified for neuro-axonal structures (NF200), myelin (SMI94), macrophages (CD68), B-lymphocytes (CD20), T-lymphocytes (CD3), cytotoxic T-lymphocytes (CD8), microglia (IBA1), astrocytes (GFAP), and mitochondrial damage. After semi-automatic registration of digitized histologic sections, regions-of-interest (ROIs) were manually defined in lesion and NA WM and GM. A latent class analysis was employed to characterize pathology subtypes in MS; different goodness of fit parameters (AIC, BIC, and G2 statistics) were used to identify the number of classes that better characterize the MS sub-populations. Profile 1 (active remodelling) was characterized by normal-appearing neuro-axonal structures and intact energetic metabolism, with high levels of macrophages/microglia and astrocytes. Profile 2 (mitochondrial dysfunction) was characterized by severely impaired mitochondrial function, along with demyelination and neuroaxonal loss, and ongoing inflammatory changes, mainly driven by cytotoxic T-cells (CD8+); patients in profile 2 presented with more severe symptoms at onset and faster disability accrual, when compared with other profiles. Profile 3 (inactive) was characterized by severe demyelination
6
and axonal loss, with similarly reduced mitochondrial function, without any concomitant pathological process contributing to further tissue remodelling and/or damage. The possibility to classify each patient depending on his/her prevalent pathology profile support the concept of MS immunopathological homogeneity within the same patient and heterogeneity between different patients, and could be used to better profile MS patients and individualize their treatment.
In the second part of the study, we explored post mortem pathology-MRI correlates and specifically focused on an advanced MRI technique (magnetization transfer ratio -MTR-), ideally detecting myelin content. MTR is widely used in MS observational studies and clinical trials, but its pathological correlates remain unclear. MTR maps were acquired at 3 Tesla from sixteen fixed MS brains and four healthy controls. 101 tissue blocks were immunostained and quantified, as previously described. After semi-automatic registration of digitized histologic sections and MTR maps, ROIs were manually defined. Associations between MTR and each stain were explored using linear mixed regression models (with cassettes nested within patients); differences in the associations between ROIs were explored using interaction terms. Lower MTR was associated with lower levels of NF200, SMI94, CD68, IBA1 and GFAP, with higher levels of CD8 and greater mitochondrial damage; MTR was more strongly associated with SMI94 in GM than WM. In a multivariate linear mixed regression model including all ROIs and brains, SMI94 was the best correlate of MTR. Myelin immunostain intensity is the strongest correlate of MTR, especially when measured in the GM. However, the additional histological correlates of MTR have to be kept in mind when interpreting the results of MTR clinical studies and designing experimental trials in MS.
Finally, we evaluated the possibility to study (and to modify) MS pathology in vivo, by using biomarkers in the peripheral blood. Considering that oxidative stress is a driver of MS pathology, we evaluated the effect of coenzyme Q10 (CoQ10) on laboratory markers of oxidative stress and
7
inflammation, and on MS clinical severity, and, then, calculated the sample size needed to detect significant variations to define most promising biomarkers. We included 60 relapsing-remitting MS patients treated with Beta1a-44μg with CoQ10 for 3 months, and with Interferon-Beta1a-44μg alone for 3 more months (open-label cross-over design). At baseline, 3- and 6-month visits, we measured markers of scavenging activity, oxidative damage and inflammation in the peripheral blood, and collected data on disease severity. After 3 months, CoQ10 supplementation was associated with improved scavenging activity (as mediated by uric acid), reduced intracellular reactive oxygen species production, reduced oxidative DNA damage, and shift towards a more anti-inflammatory milieu in the peripheral blood (with higher IL-4 and IL-13, and lower Eotaxin, GM-CSF, HGF, IFN-γ, IL-1α, IL-2R, IL-9, IL-17F, MIP-1α, RANTES, TNF-α and VEGF). Also, CoQ10 supplementation was associated with lower expanded disability status scale, fatigue severity scale, Beck's depression inventory, and visual analogic scale for pain. For sample size estimates, we used adjusted-beta-coefficients of observed 3-month variation for each laboratory measure (and respective standard deviation); we assumed that the observed variation was the highest achievable treatment effect (100%), and we estimated sample size for conservative treatment effects (e.g., 70%), smaller than what observed. Setting 5% alpha-error and 80% power, low sample size requirements to detect 70% observed variation from a baseline pre-treatment timepoint to a 3-month follow-up were found for IL-3 (n=1), IL-5 (n=1), IL-7 (n=4), IL-2R (n=4), IL-13 (n=6), IL-6 (n=14), IL-8 (n=22), IL-4 (n=23), RANTES (n=25), TNF-α (n=26), IL-1β (n=27), and uric acid (n=29). CoQ10 supplementation improved scavenging activity, reduced oxidative damage, and induced a shift towards a more anti-inflammatory milieu, in the peripheral blood of relapsing-remitting MS patients treated with Interferon-Beta1a 44μg, along with clinical improvements. Peripheral biomarkers of oxidative stress and inflammation could be used in small proof-of-concept studies to quickly screen the mechanisms of action of new or already-existing medications for MS.
8
2. State of the art
2.1 Multiple Sclerosis
2.1.1. General definition
Multiple Sclerosis (MS) is a chronic inflammatory demyelinating disease of the central nervous system (CNS) affecting approximately 2.5 million people worldwide, particularly young adults and women (C. A. Dendrou et al., 2015; Thompson et al., 2018). Typically, diagnosis occurs around the age of 30, with symptoms including motor difficulties, visual defects, cognitive issues, and bladder/bowel dysfunction (National Multiple Sclerosis Society, 2016). Patients may become wheelchair-bound some years after diagnosis and, ultimately, fatal complications such as infections and aspirational pneumonia are common (Rodríguez-Antigüedad Zarranz et al., 2014).
2.1.2 Aetiology
The causes of MS are unknown. Genetics represent only part of the disease risk, with genes being related primarily to proteins involved in the immune system regulation (Steri et al., 2017). Equally, environmental factors such as smoking and viruses (such as Epstein-Barr virus), are thought contribute to disease risk and progression (C. A. Dendrou et al., 2015; Magliozzi et al., 2013; M. Moccia, Lanzillo, Palladino, et al., 2015).
2.1.3 Clinical phenotypes of MS
MS can be divided into 3 main clinical types: relapsing remitting MS (RRMS), primary progressive MS (PPMS), and secondary progressive MS (SPMS). Patients may initially be diagnosed with RRMS, experiencing waxing and waning of symptoms. Partial or even full recovery can occur in remission stages. After 10-15 years of RRMS, 50% patients experience secondary progressive MS (SPMS), in
9
which symptoms no longer relapse and remit, but remain continuously present and progress, and patients experience clinical deterioration, perpetuating over time (Correale et al., 2017). Currently, there is no clear distinction between RRMS and SPMS, with transition occurring gradually over time (Lublin et al., 2014). This is contrasting with primary progressive MS (PPMS) in which patients experience progressive disease from onset, with or without inflammatory features (Lublin et al., 2014) (Figure 1).
Figure 1. Classification of MS, and disability over time. RRMS exhibits waxing and waning of neurological symptoms
and disability. This may last years or even decades, before some progression to SPMS, with a constant degeneration of neurological function and increasing disability. PPMS refers to a similar degeneration, but from the onset, in the absence of a relapsing-remitting stage. Adapted from Dendrou et al. (2015).
2.2 MS pathogenesis
The pathogenesis of MS remains largely unknown. It is generally accepted that MS is an immune-mediated disease with inflammatory leukocytes infiltrating the central nervous system (CNS) and ultimately leading to demyelination and neuro-axonal loss (Göbel et al., 2018).
10
Although initial events triggering MS are currently unknown, multiple layers of pathology are observed (autoimmunity, inflammation, tissue remodelling and, more recently recognised, mitochondrial dysfunction), overall resulting in demyelination and neuronal loss, with white matter (WM) and grey matter (GM) lesions and atrophy (Figure 2) (C. A. Dendrou et al., 2015; Magliozzi, Reynolds, et al., 2018; Martinez Sosa and Smith, 2017; Nicol et al., 2015). As such, a number of cells and mechanisms are involved in MS pathology within both normal-appearing (NA) and lesional WM and GM (M Moccia and Ciccarelli, 2017).
Figure 2. White and grey matter lesions in MS. RRMS exhibits a high level of WM lesions, with GM lesions occurring
more in progressive disease. Previously, GM lesions were largely undetected; development of MRI technology has now revealed their prevalence to a similar degree to WM lesions, with a prominent role in disability. Adapted from Dendrou
et al., 2015
2.2.1 Macrophages and microglia
Macrophages are innate, phagocytic antigen-presenting cells (APCs), which can activate (and are activated by) lymphocytes, through the release of cytokines influencing lymphocyte activity and generating a pro-inflammatory loop in the brain parenchyma (C. Dendrou et al., 2015).
11
Progression of experimental autoimmune encephalomyelitis (EAE) (the most commonly used animal model of MS) is correlated to macrophage infiltration from the periphery to the CNS (Ajami et al., 2011). Some studies in EAE have implicated macrophages in the initial stages of demyelination and lesion formation, with microglia following in later stages (C. Dendrou et al., 2015). Indeed, microglia represent a late maturation stage of macrophages. Microglia act as the resident innate immune cells of the brain, with cytokine release, astrocyte and lymphocyte activation, and cellular debris scavenging (Prins et al., 2015).
2.2.3 Astrocytes
Formerly, astrocytes were only considered relevant to MS in the formation of glial scars after lesion resolution, whilst they are currently appreciated to have a more dynamic role. Astrocytes activated by inflammation are abundant in MS, advocating their involvement from early inflammatory stages (Ponath et al., 2018). In the long-term, astrocytes have been shown to heighten inflammation by releasing pro-inflammatory mediators, adhesion molecules, and chemokines, associated with microglia/macrophages migration into the parenchyma (Ponath et al., 2018). A continuous crosstalk between astrocytes and microglia/lymphocytes has been documented (Legroux and Arbour, 2015).
2.2.4 T- and B-lymphocytes
Different lymphocyte subsets interact among each other and contribute to the maintaining of a pro-inflammatory milieu through the production of a variety of soluble mediators (e.g., cytokines and chemokines) (Göbel et al., 2018) (Figure 3).
Pro-inflammatory T-lymphocytes are traditionally thought to be the key effectors in MS pathogenesis and, in keep with this, most approved MS therapies primarily target T cells by modulating their access and/or function within the CNS (Kinzel and Weber, 2016). T-lymphocytes
12
infiltrate the CNS in later stages of lesion formation (C. A. Dendrou et al., 2015), through direct activation of resident APCs (Bartholomäus et al., 2009). After invasion, these activated immune cells produce soluble mediators (e.g., cytokines and chemokines) that maintain a pro-inflammatory milieu compartmentalized within the CNS (Göbel et al., 2018).From a pathological perspective, CD4+ (helper) T cells are more concentrated in the peri-vascular cuff, whereas CD8+ (cytotoxic) T cells are widely distributed within the parenchyma (Reich et al., 2018).
More recently, the dramatic success of B-cell-depleting antibodies in reducing MS clinical and radiological progression has shed light on the role of B-lymphocytes in MS pathogenesis (Gasperini
et al., 2013; Greenfield and Hauser, 2018; Kinzel and Weber, 2016). After migrating to the CNS, B
cell-derived plasma cells are responsible for the production of cerebrospinal fluid (CSF)-specific antibodies (oligoclonal bands) that have diagnostic and clinical relevance (Arrambide et al., 2018; Kinzel and Weber, 2016; Reich et al., 2018). Also, B-lymphocytes produce a set of cytokines, chemokines and survival factors, such as tumor necrosis factor alpha (TNF-α), interferon-gamma (IFN-γ), granulocyte macrophage-colony stimulating factor (GM-CSF) and interleukin (IL)-15, that contribute to developing and maintaining a B cell-friendly milieu (Cervantes-Gracia and Husi, 2018; Kinzel and Weber, 2016; Steri et al., 2017). B cells also secrete IL-6 that induces CD4+ T-17 differentiation and inhibits the generation of regulatory T cells (Duddy et al., 2007). In the meanwhile, the ability of B cells to produce anti-inflammatory cytokines (such as IL-10) is inhibited (Kinzel and Weber, 2016). This could be important in more advanced disease stages, where infiltration of immune cells from the periphery is decreased (Howell et al., 2011), and B-lymphocytes accumulate in the meninges and subpial regions, in the form of follicle-like structures (Magliozzi et
al., 2010). B-lymphocyte-rich follicle-like structures have been associated with a gradient of
neuronal loss and demyelination, and with shorter time to wheelchair, and younger age at onset and death. (Howell et al., 2011; Magliozzi et al., 2007).
13 Fi gu re 3 Im m un ity in t he p er ip he ry a nd t he CN S re le va nt t o M S W he th er a ut oi m m un ity is in iti at ed in t he p er ip he ry o r th e CN S is n ot k no w n, h ow eve r in e ith er c as e, a fe ed ba ck lo op b et w ee n th e tw o m ay b e im po rt an t. In na te c el ls c an b e ac tiv at ed th ro ug h m im ic ry , i nfi ltr at io n of a nti ge ns in to th e CN S or a nt ig en s e sc ap in g th e CN S in to th e pe rip he ry . T he se indu ce inf la m m at io n and ac tiv at e ada pt iv e im m uni ty . D ue to B BB br ea kdo w n, a nd ent ry v ia C SF -me ni ng ea l p at hw ay , t he se a da pt iv e imm un e TC a nd B Cs ca n en te r t he C N S an d pe rp et ua te in fla m m at io n an d bre ak do w n of m ye lin . BC : B -ce ll; T C: T -ce ll; B BB : b lo od -br ai n ba rr ie r. Or ig in al fi gu re .
14
2.3 Magnetic resonance imaging in MS
Advances in magnetic resonance imaging (MRI) techniques have enriched our understanding of the disease. Conventional MRI has become a pivotal tool for diagnosing and clinical monitoring of MS (Thompson et al., 2018). More recently, several quantitative MRI techniques have been developed, presenting with a higher specificity towards the pathological aspects of MS, when compared with conventional MRI (Filippi et al., 2012; Filippi and Rocca, 2011; M Moccia and Ciccarelli, 2017).
2.3.1 Brain lesion count and volume
Lesion measures are pivotal for MS diagnosis and clinical monitoring, and include the number of gadolinium-enhancing and new/enlarging T2 lesions, and their related volumes (Tur et al., 2018). Lesions are the best biomarker of active inflammation in MS, acting as a surrogate measure of clinical relapses, and allowing the screen for early disease activity in phase 2 clinical trials in RRMS (Sormani and Bruzzi, 2013). On the contrary, lesion-derived measures play a secondary -but not negligible- role in the study of progressive MS. In PPMS, the burden of T2-visible lesion load and of gadolinium-enhancing lesions is low, despite clinical severity (Miller and Leary, 2007), and seems to have only a minimal impact on the disability accrual over time (Khaleeli et al., 2010).
2.3.2 Global and regional brain atrophy
Brain atrophy is detectable on MRI scans from the earliest clinical stages of MS and is a biomarker of irreversible neurodegenerative processes (Ontaneda and Fox, 2017). Global brain atrophy has been associated with the degree of disability in large cohorts of both RR and progressive MS (Khaleeli et al., 2008; Rovaris et al., 2008). Besides, improvements in MRI post-processing have allowed to segment WM and GM (both cortical and deep) separately, allowing refinement of association with clinical features (Fisniku et al., 2008; Magliozzi, Reynolds, et al., 2018; Rocca et al., 2012; Scalfari et al., 2018). Regional volumes might show a greater change over time (Eshaghi,
15
Marinescu, et al., 2018; Eshaghi, Prados, et al., 2018; Kapoor et al., 2010), resulting in higher sensitivity and smaller sample size when compared with global measures (Healy et al., 2009). Intriguingly, brain atrophy has not been associated with relapse risk in RRMS, suggesting that atrophy is probably driven more by (possibly independent) neurodegenerative changes than inflammatory lesions, which further support the use of this measure in progressive MS (Moccia, Quarantelli, et al., 2017; Ontaneda and Fox, 2017).
2.3.3 Advanced MRI techniques
Conventional neuroimaging techniques lack specificity with regard to different pathophysiological substrates of MS, and are not able to explain the heterogeneous and long-term clinical evolution of the disease (Bodini et al., 2015; Friese et al., 2014; Popescu et al., 2013; Sormani et al., 2014). Advanced MRI techniques, such as magnetization transfer ratio (MTR), diffusion tensor imaging (DTI), and magnetic resonance spectroscopy (MRS), may provide higher pathological specificity for the more destructive aspects of the disease (i.e., demyelination and neuroaxonal loss), and be more closely associated with clinical correlates (Barkhof et al., 2009; Enzinger et al., 2015). Moreover, functional MRI (fMRI) is contributing to the definition of the role of cortical reorganization after MS tissue damage (Rocca et al., 2012).
Among a variety of quantitative MRI measures, the MTR calculated from magnetization transfer (MT) imaging has emerged as a measure of particular interest. MTR values reflect the efficiency of the magnetization exchange between mobile protons in tissue water and those bound to the macromolecules, such as myelin. MTR might have a potential role in correlating with clinical and cognitive disability (Z. Khaleeli et al., 2007; Ranjeva et al., 2005), predicting clinical progression (Z Khaleeli et al., 2007; Khaleeli et al., 2008), and monitoring treatment efficacy in MS (van den Elskamp et al., 2010). In view of this, MTR has been included in several clinical trials in progressive
16
MS and has been measured in GM, WM, T2 lesions, putamen, thalamus and optic nerve (ClinicalTrials.gov, 2016; Connick et al., 2012; Fox et al., 2016; Romme Christensen et al., 2014).
MRI alone provides only indirect information about the underlying pathological changes of the disease (Filippi et al., 2012). Therefore, to shed light on the exact pathological substrates reflected by MRI abnormalities, correlative pathological and further MRI studies are certainly needed (Moccia, de Stefano, et al., 2017).
17
3. Objectives
The present study aims to explore the pathogenesis of MS on post mortem brain samples and in
vivo, and, in particular, has three main objectives:
1. Defining the pathology of MS with latent-profile models
In the first part of the study, we analysed post mortem MS brain samples with a data driven approach in order to define pathology profiles of MS, with their possible clinical correlates.
2. Pathological correlates of MTR in MS
The second part of the study is based on post mortem MRI and its pathological correlates. In particular, we explored pathological correlates of an advanced MRI technique (MTR), ideally designed to detect myelin content, but possibly affected by the variety of MS pathology.
3. Peripheral markers of oxidative stress and inflammation in MS
Finally, we explored the feasibility of studying (and modifying) oxidative stress and inflammation in vivo by measuring biomarkers in the peripheral blood.
18
4. Defining the pathology of multiple sclerosis with latent-profile models
4.1 Introduction
Classifications of MS ought to reflect its clinical course and, ideally, its pathological background. Accurate patient profiling is crucial for prognostic and therapeutic purposes in the clinical practice, and to recruit homogeneous populations in observational studies and clinical trials designed to address specific questions (Broman et al., 1965; Ntranos and Lublin, 2016).
Current clinical classification of MS phenotypes is based on the assessment of inflammatory activity (relapses or active lesions on MRI), and of progression of disability (either together or separately) (Fred D. Lublin et al., 2014). This descriptive classification fits perfectly with currently-available disease modifying treatments (DMTs) for MS that are specifically able to target inflammation (Ntranos and Lublin, 2016), and has been a cornerstone to prove their efficacy on progressive patients with inflammatory features (Hughes et al., 2018; Kappos et al., 2018; Montalban et al., 2017).
In past decades, a number of pathological classifications have been proposed based on the degree of demyelination and immune cell interactions in lesional and peri-lesional white matter (WM) (Bö
et al., 1994; Bruck et al., 1995; Kuhlmann et al., 2017; Lassmann et al., 1998; Lucchinetti et al., 2000;
Sanders et al., 1993; Van Der Valk and De Groot, 2000). These qualitative classifications were thought to depict the temporal evolution of demyelination and inflammation (e.g., active lesions progressively becoming inactive), and shared common pathogenetic elements (Kuhlmann et al., 2017; Van Der Valk and De Groot, 2000), that have been used for studying potential therapeutic targets (Lassmann, 2017). However, patterns of demyelination and inflammation across different
19
lesions were consistently heterogenous between MS patients, but remained substantially homogenous within the same patient, also in serial biopsies (Breij et al., 2008; Lucchinetti et al., 2000; Metz et al., 2014). These findings suggest that different subgroups of MS patients share similar pathogenetic mechanisms leading to demyelinating inflammatory lesions (Breij et al., 2008; Lucchinetti et al., 2000).
A variety of pathogenetic mechanisms occurs in MS along with inflammation and demyelination (e.g., axonal loss, astrocyte reaction, mitochondrial damage), and involves both lesional and NA tissue in the WM and GM (Haider et al., 2016; Kawachi and Lassmann, 2017; Lassmann, 2018). Thus, assuming intraindividual immunopathological homogeneity, we hypothesize that MS patients can be classified in relation to the variety of pathological changes occurring in lesional and NA WM and GM, with subsequent clinical correlates. The present study aims to: 1) define pathology profiles of MS with a data-driven approach (latent-profile analysis); 2) evaluate pathological features of each pathology profile; 3) evaluate clinical correlates of each pathology profile.
4.2 Methods
4.2.1 Subjects
Tissue for this study was provided by the United Kingdom MS Tissue Bank at the Imperial College London, under ethical approval from the National Research Ethics Committee. The study followed Human Tissue Act guidelines. All MS patients (n=16) had provided informed consent to donate tissue for MS research. Informed consent of the next of kin of the healthy subject was obtained before the inclusion of the tissue in this study. Demographic and clinical characteristics are reported in Table 1.
20 Ta bl e 1. Pa tien ts a nd p at ho lo gy pr of iles . The tabl e show s de m ogr aphi c and cl ini cal fe at ur e of M S pat ie nt s and the ir pr eval ent pat hol ogy pr of ile . MS : mu lti pl e sc le ro si s; E DS S: e xp an de d di sa bi lit y st at us s ca le ; M: ma le ; F : f ema le ; S E: s ep si s; A P: a sp ira tio n pn eu mo ni a; P E: pul m onar y em bol is m ; S U : s ui ci de ; Py r: py ra m id al ; S en : s en so ry ; O N : o pti c ne ur iti s; SC : s pi na l c or d; Ce r: ce re be lla r; SP : s ec on da ry p ro gr es si ve ; P P: pr im ar y pr og res si ve MS c as e 1 2 3 4 5 6 7 8 9 10 11 12 13 14 15 16 Ge nde r M F F F F F M M F F F M F M F M Ag e, ye ars 75 61 68 66 71 53 50 64 69 75 71 66 75 65 63 66 Cau se of d ea th SE AP AP AP SE AP AP PE AP AP AP SU AP AP AP AP Ag e at ons et , y ea rs 60 47 22 34 35 26 35 37 29 31 51 40 38 32 47 43 Sy st em o f o ns et Py r Py r Se n ON Se n SC SC SC Se n Se n Cer SC Py r Se n Cer SC Cl in ic al p hen ot yp e PP PP SP SP SP PP PP SP SP SP SP SP SP SP PP SP Ti m e to ED SS 7. 0, ye ars 7 10 30 23 22 14 9 12 25 39 10 11 26 30 7 13 Ti m e to ED SS 10 , y ea rs 15 14 46 32 36 27 15 27 40 44 20 26 37 33 16 23 Pa th ol og y pr of ile 2 1 1 1 1 2 2 2 3 1 1 2 3 1 2 2 Pr ev al en ce of th e pr of ile 41. 6% 47. 1% 48. 1% 47. 3% 47. 8% 47. 6% 50. 0% 47. 1% 38. 5% 46. 7% 58. 3% 52. 9% 41. 2% 47. 6% 41. 2% 44. 3%
21
4.2.2 Tissue handling and immunohistochemistry
From each brain, a single coronal cut through mammillary bodies was done to separate brain into anterior and posterior halves. Then, 1 cm-thick coronal slices were cut through the entire brain using the 1 cm guide and, for the present study, the second slice posterior to the mammillary bodies towards the occipital pole was included. Slices were immersed in 10% buffered formaldehyde solution for a minimum of seven days, allowing full fixation.
After scanning, brain slices were sectioned into different 5 mm-tick tissue blocks (each approximately 20×30 mm in size) (85 blocks in 16 cases, on average 5.3 blocks per brain slice) (Fig 1A). Serial sections were cut through the block at 5 μm section thickness using the Tissue-Tek AutoSection automated microtome (Sakura Finetek).
Cassettes were paraffin-embedded and immunostained by IQPath under the supervision of Prof Sebastian Brandner (UCL Queen Square Institute of Neurology, University College London). Immunostaining was performed using the Ventana Discovery XT instrument and the DAB Map detection Kit (760-124), in compliance with manufacturer instructions. Cassettes were immunostained for neuro-axonal structures (NF200), myelin (SMI94), macrophages (CD68), microglia (IBA1), B-lymphocytes (CD20), T-lymphocytes (CD3), cytotoxic T-lymphocytes (CD8), astrocytes (GFAP), and mitochondrial activity (COX4, VDAC). Slides were counterstained with hematoxylin (HE). Positive and negative controls were included initially when optimizing the stains and, then, only positive controls were included for antigens not expected to be present abundantly in the tissue. Details of immunostains are reported in Table 2.
22 Ta bl e 2. I m m un os ta in s. The tabl e show s de tai ls of im m unos tai ns w ith ant ibodi es , t ar ge ts and pr oce ss ing. An tig en Pr e-tr ea tm en t Di lut ion Pr im ar y an tibody in cu ba tio n Sec on dar y an tib od y 1: 200 Ta rg et So ur ce Sw in e αr ab bi t Da ko E0353 Rabbi t αm ous e Da ko E0354 CD 20 Mi ld R ib o CC * 1: 200 1h 32m in Ne ur of ila m en ts (n eu ro -ax on al st ru ct ur es ) Da ko 7D1 CD 3 St an da rd C C1 ** 1: 100 1h 32m in My el in b as ic p ro te in Le ic a PA 01 22 CD 8 St an da rd C C1 ** 1: 100 1h 32m in Ti ss ue m ac ro ph ag e an tig en Da ko M 7103 NF 20 0 Pr ot ea se 1 4’ 1: 200 32m in 32m in Cl us ter s of di ffer en tia tion of B ce lls Si gm a N 53 89 SM I94 Ex te nde d CC1** 1: 500 32m in 32m in Cl us ter s of di ffer en tia tion of T cel ls Co vanc e SM I94 -R CD 68 St an da rd R ib o CC * 1: 100 1h 32m in Cl us ter s of di ffer en tia tion of cy to to xi c T ce lls Da ko PG -M1 IB A1 St an da rd C C1 ** 1: 250 1h 32m in Io nizin g ca lciu m -bi ndi ng adap tor m ol ec ul e 1 (m ic ro gl ia ) Wa ko 0 19 -19741 GF AP Pr ot ea se 1 4’ 1: 1000 32m in 32m in Gl ia l f ibr ill ar y ac idi c pr ot ei n (a st ro cy te s) Da ko Z0334 CO X4 St an da rd C C1 * 1: 100 1h 32m in Mi to ch on dr ia l i nn er m em br an e pr ot ei n (in ta ct mi to ch on dr ia ) Ab ca m a b1 47 44 VD AC St an da rd C C1 * 1: 100 1h 32m in 32m in Mi to ch on dr ia l o ut er m em br an e pr ot ei n (d am ag ed m ito ch on dr ia ) Ab ca m a b1 58 95 *1Ri bo CC: ci tr at e-bas ed buf fe r and Pr oCl in 300. **CC1: ce ll condi tioni ng 1.
23
Immunostained slides were digitalized as 8-bit RGB images at 40× magnification using a Leica SCN400F slide scanner (Leica Microsystems), and analysed with Definiens Tissue Studio software 3.6 (Definiens AG, Munich, Germany) (Patodia et al., 2018), with a resolution of 5× for tissue identification and a resolution of 10× for stain analysis, taking care to exclude any artefacts (e.g., breaks in the section). Images were segmented into pixels of 250×250 µm2 (0.0625 mm2). The intensity threshold for positive labelling was set separately for each immunostain, using an automatic histogram method accounting for variation in background stain levels (Otsu, 1979). Separate thresholds were set for HE counterstaining which allowed identification of nuclei.
For each pixel, immunostain intensity and its coordinates were exported in comma-separated values (CSV) files, including brown intensity for immunostains and blue for HE.
4.2.3 Registration
To align histology spatially, a subject-wise space was created by group-wise registration of digitized histological images, via consecutive rounds of rigid, affine and non-linear registrations, with NiftyReg (version 1.3.9) (Modat et al., 2010, 2014; Pichat et al., 2018).
4.2.4 Image analysis and data extraction
ROIs were manually delineated on the co-registered histology with 3D Slicer (version 4.4.0). The detection of ROIs was primarily guided by histological images with higher contrast (e.g., NF200, SMI94, GFAP, COX4, VDAC). ROI area was variable depending on the amount of included tissue. The following ROIs were drawn (number of included ROIs is reported): NAWM (n=98), WM lesions (n=62), cortical NAGM (n=89), and cortical GM lesions (n=53) (on average 2.9±1.8 ROIs per block). Overall, 302 records (from different cases/controls, tissue blocks, and ROIs) were included in the statistical models.
24
Mean immunostain intensity (percentage of stained area) and ROI area were extracted for each ROI using FSL (version 5.0.9). For data analysis, the intensity of mitochondrial immunostains was combined as follows: percentage of damaged mitochondria = (VDAC-COX4)/VDAC (Roman et al., 2005; Shoshan-Barmatz et al., 2010).
4.2.5 Clinical variables
Clinical variables were extracted by a neurologist blinded to the pathological analysis, from retrospective review of detailed patients’ records. Clinical variables were: functional system involved at onset (cerebellar symptoms, optic neuritis, pyramidal dysfunction, sensory symptoms, spinal cord motor dysfunction), clinical course at death (SP or PPMS), time to wheelchair dependence (expanded disability status scale -EDSS- 7.0 equivalent, measured as the time from onset to wheelchair dependence), and time to death (EDSS 10 equivalent, measured as the time from onset to death) (Howell et al., 2011). Causes of death were MS-related (Cutter et al., 2015). Full data are reported in Table 1.
4.2.6 Statistics
A latent class analysis was employed to characterize pathology subtypes in MS considering quantified pathology (aim 1). Different goodness of fit parameters (AIC, BIC, and G2 statistics) were considered to identify the number of classes that better characterize the MS sub-populations.
Differences in stain intensity between pathology profiles (aim 2) were explored using linear mixed regression models including group indicator (pathology profile 1, 2 or 3) as main variable of interest, and using profile 1 as statistical reference. Fixed effect variables included in the model were different stains (NF200, SMI94, CD20, CD3, CD8, CD68, GFAP, IBA1, and percentage of damaged
25
mitochondria, measured as (VDAC-COX4)/VDAC). These models used the cassettes as unit of the analysis, with a random subject intercept to account for the nested structure of the data (cassettes nested within patients). Results are presented as coefficients (Coeff) and 95% confidence interval (95%CI).
Each patient was then classified on the basis of his/her prevalent pathology profile (Table 1). Clinical differences between pathology profiles (aim 3) were estimated with chi-square test for categorical variables (e.g., functional system at onset, clinical phenotype) and with ANOVA for continuous variables (e.g., time to EDSS 7.0 and EDSS 10).
Statistical analyses were performed with Stata 15.0. Statistical significance was set at p<0.05.
4.3 Results
4.3.1 Pathology profiles of MS
Three pathology profiles were obtained from latent profile analysis with highest goodness of fit parameters (Figure 4).
4.3.2 Pathological correlates of pathology profiles
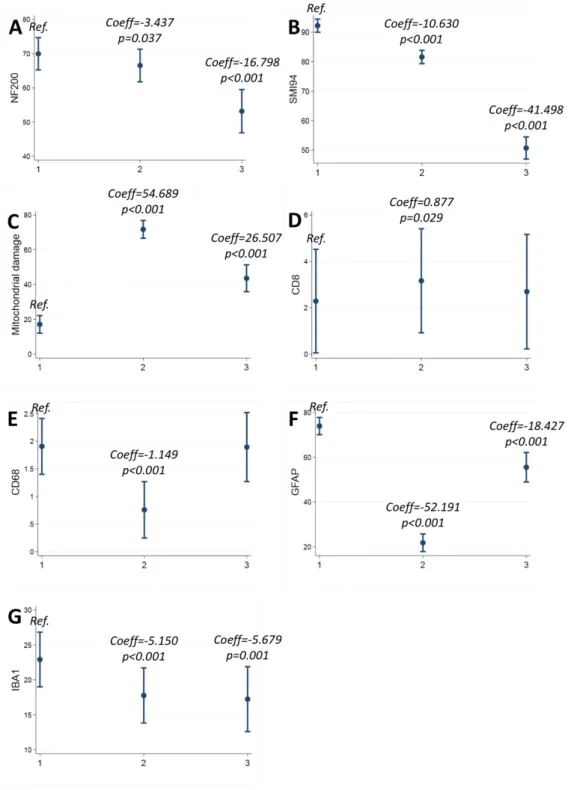
When compared with profile 1, profile 2 presented with lower NF200 (Coeff=-3.437; 95%CI:-6.675/-0.199; p=0.037), SMI94 (Coeff=-10.630; 95%CI=-13.219/-8.041; p<0.001), CD68 (Coeff=-1.149; 95%CI=-1/427/-0.872; p<0.001), GFAP (Coeff=-52.191; 95%CI=-56.701/-47.682; p<0.001), and IBA1 (Coeff=-5.150; 95%CI=-7.074/-3.226; p<0.001), and with higher CD8 (Coeff=0.877; 95%CI=0.089-1.665; p=0.029), and mitochondrial damage (Coeff=54.689; 95%CI=49.929/59.448; p<0.001) (Table 3; Figure 4; Figure 5).
26
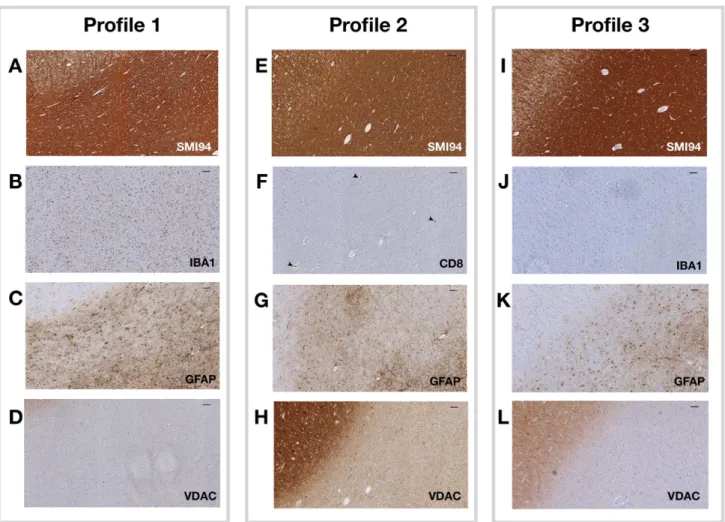
Figure 4. Pathology profiles.
Representative images are shown from the 3 pathology profiles. NAGM is presented in the upper left corner, with the remaining of the image being NAWM (consistently in different images/profiles). In profile 1 (patient 11),
macrophages/microglia (IBA1) and astrocytes (GFAP) infiltrates were found in the context of relatively normal myelin content (SMI94) and in the absence of mitochondrial dysfunction (VDAC) (A-D). In profile 2 (patient 12), an
apparently-normal myelin content (SMI94) was associated with damaged mitochondrial function (VDAC) and with cytotoxic
T-lymphocytes (CD8) infiltrates (mainly perivascular, arrowheads), in absence of significant astrocyte levels (GFAP) (E-H). In profile 3 (patient 9), overall levels of myelin (SMI94) were reduced, consistently with mitochondrial function (VDAC),
27
When compared with profile 1, profile 3 presented with lower NF200 (Coeff=-16.798; 95%CI:-22.206/-11.391; p<0.001), SMI94 41.498; 95%CI=-45.498/-37.497; p<0.001), GFAP (Coeff=-18.427; 95%CI=-25.457/-11.396; p<0.001), and IBA1 (Coeff=-5.679; 95%CI=-8.905/-2.454; p=0.001), and with higher mitochondrial damage (Coeff=26.507; 95%CI=18.864/34.151; p<0.001) (Table 3; Figure 4; Figure 5).
Table 3. Pathological correlates of pathology profiles.
The table shows pathological correlates of different pathology profiles. Coefficients (Coeff), 95% confidence intervals
(95%CI) and p-values are shown from mixed effect regression models (with cassettes nested within patients) including
group indicator (pathology profile 1, 2 or 3) as main variable of interest; profile 1 was used as reference (* indicates p<0.05).
Profile 1
(reference)
Profile 2 Profile 3
Coeff 95%CI p-values Coeff 95%CI p-values
Lower Upper Lower Upper
NF200 -3.437 -6.675 -0.199 0.037* -16.798 -22.206 -11.391 0.026* SMI94 -10.630 -13.219 -8.041 <0.001* -41.498 -45.498 37.497 <0.001* CD20 0.211 -0.284 0.706 0.403 0.077 -0.749 0.905 0.854 CD3 0.553 -0.100 1.206 0.097 0.340 -0.746 1.428 0.539 CD8 0.877 0.089 1.665 0.029* 0.408 -0.937 1.754 0.552* CD68 -1.149 -1.427 -0.872 <0.001* -0.012 -0.483 0.457 0.957 GFAP -52.191 -56.701 -47.682 <0.001* -18.427 -25.457 -11.396 <0.001* IBA1 -5.150 -7.074 -3.226 <0.001* -5.679 -8.905 -2.454 0.001* Damaged mitochondria 54.689 49.929 59.448 <0.001* 26.507 18.864 34.151 <0.001*
28
Figure 5. Pathological correlates of pathology profiles.
Margins plots show coefficients (Coeff) and 95% confidence intervals (95%CI) from mixed effect regression models (with cassettes nested within patients) including group indicator (pathology profile 1, 2 or 3) as main variable of interest;
29
4.3.3 Clinical correlates of pathology profiles
Seven patients were included in profile 1, 7 in profile 2 and 2 in profile 3, in accordance with his/her prevalent pathology profile (Table 1).
Most common symptoms at onset were sensory in profile 1 (57.1%), spinal cord in profile 2 (71.4%), and optic neuritis and sensory in profile 3 (50% and 50%) (p=0.017). Time to EDSS 7.0 was shorter in profile 2 (10.4±4.5 years), when compared with profile 1 (23.4±10.7 years) and 3 (25.5±0.7 years) (p=0.012). Time to EDSS 10 was shorter in profile 2 (20.5±6.8), when compared with profile 1 (32.1±11.7 years) and 3 (38.5±2.1) (p=0.038). No difference in pathology profile distribution was found between SPMS and PPMS (p=0.237).
4.4 Discussion
Our data driven analysis was able to detect three main profiles of MS pathology, each of which characterized by specific pathology and clinical correlates. This is the first attempt to classify MS pathology by using quantitative immunohistochemistry for a number of pathogenetic mechanisms, including NA and lesional WM and GM, applying advanced statistical methods, and validating towards clinical features of MS. The possibility to classify each MS patient into his/her pathology profile has specific clinical consequences in terms of disease profiling and treatment.
Profile 1 (active remodelling) was characterized by normal-appearing neuro-axonal structures and intact energetic metabolism, with high levels of macrophages/microglia and astrocytes, possibly contributing to subtle but continuous tissue remodelling and damage (Domingues et al., 2016; Kawachi and Lassmann, 2017). Patients in profile 1 presented with relatively benign onset and mild progression, corresponding to the presence of inflammatory activity (driven by macrophages/microglia) without obvious signs of neurodegeneration (Fred D. Lublin et al., 2014).
30
In this pathology profile, chronic tissue remodelling that macrophages/microglia and astrocytes exert, could be treated with medications modulating their function. Of note, currently available DMTs minimally affect macrophage/microglia and astrocyte function and, so, this subgroup of patients could be considered for trials with medications crossing the blood-brain-barrier and directly modulating these cells (Du et al., 2017).
Profile 2 (mitochondrial dysfunction) was characterized by severely impaired mitochondrial function, along with demyelination and neuroaxonal loss, and ongoing inflammatory changes, mainly driven by cytotoxic T-cells (CD8+). Patients in profile 2 presented with severe symptoms at onset and faster disability accrual, corresponding to the presence of inflammation and neurodegeneration (Fred D. Lublin et al., 2014). In this pathology profile, the ongoing inflammatory activity should be treated with immunomodulatory treatments; interventions aiming to support energetic metabolism should also be considered (Campbell and Mahad, 2018).
Finally, profile 3 (inactive) was characterized by severe demyelination and axonal loss, with similarly reduced mitochondrial function, without any concomitant pathological process contributing to further tissue remodelling and/or damage. Patients in profile 3 presented with relatively benign clinical features, corresponding to the absence of disease activity (Fred D. Lublin et al., 2014). In this pathology profile, medications with putative neuro-regenerative effects should be evaluated.
Pathogenic mechanisms depicted by our classification are not new and have already been described and differently named in previous qualitative studies on lesional and NA MS brain tissue (Table 4) (Bö et al., 1994; Bruck et al., 1995; Kuhlmann et al., 2017; Lassmann et al., 1998; Lucchinetti et al., 2000; Sanders et al., 1993; Van Der Valk and De Groot, 2000).
31 Ta bl e 4. C la ss ific at io n o f M S p at ho lo gy . The tabl e sum m ar is e pat hol ogi cal fe at ur es of our cl as si ficat ion of M S pat hol ogy bas ed on lat ent pr of ile anal ys is , and show s its si m ila riti es to p re vi ou s cl assi fic ati on s. Pr of ile Pa th ol og ic al fe at ur es Ku hl m an n et a l. Ac ta N eu ro pa th ol 2017 Ha id er e t a l. Br ai n 2016 Lu cc hi ne tt i e t a l. An n N eu ro l 2000 La ssm an n et a l. J N eu ro im m un ol 1 99 8 Br üc k et a l. An n N eu ro l 1995 Bö et a l. J N eu ro im m un ol 1994 1 Activ e re m od el lin g My el in a nd n eu ro -ax on s Ma cr op ha ge s/ m ic ro gl ia As tr oc yt es Ac tiv e le si on Pa tt er n I a nd II le sio ns In fa m m at or y+ de m ye lin at in g and in flam m at or y le si ons Ea rly /la te ac tiv e le si on Ac tiv e le si on 2 Mito ch on dr ia l dy sf un ct io n ¯ My el in a nd n eu ro -ax on s Mi to ch on dr ia l d am ag e CD 8+ cy tot ox ic T -ly m ph oc yt es Mi xe d ac tiv e/ inac tiv e le sio n Pa tt er n I o f ne ur ode ge ne ra tion Pa tt er n III a nd IV le sio ns In fa m m at or y+ de m ye lin at in g and de m ye lina ting le si ons Ea rly /la te re m ye lin at in g le sio n Chr oni c ac tiv e le sio n 3 Inac tiv e ¯¯ ¯ My el in a nd n eu ro -ax on s Mi to ch on dr ia l d am ag e ¯ Ma cr op ha ge s/ m ic ro gl ia /a st ro cy te s In ac tiv e le si on Pa tt er n II of ne ur ode ge ne ra tion In ac tiv e le si on In ac tiv e le si on Chr oni c ina ct iv e le sio n
Inflammation was mainly driven by macrophages/microglia in profile 1 and CD8+ cytotoxic T-lymphocytes in profile 2. However, these cells are generally considered end-effectors of MS pathogenesis and a contribution from CD4+ T- and B-lymphocytes should be considered (C. Dendrou
et al., 2015; Magliozzi et al., 2007; Magliozzi, Howell, et al., 2018). Mitochondrial dysfunction was
described in profile 2 and 3, and in both cases was associated with neuro-axonal loss. Indeed, mitochondrial damage is a marker of chronic cellular dysfunction, can exacerbate inflammation and ultimately causes neurodegeneration (Campbell and Mahad, 2018; Haider et al., 2016; Lucchinetti
et al., 2000; Yang and Dunn, 2018). Finally, in a subset of patients (profile 3, inactive), disease activity
might eventually cease, leaving signs of previous inflammatory changes (neuro-axonal loss and mitochondrial damage) without concomitant pathogenetic changes.
Limitations of the present study include reproducibility on independent and larger samples. The use of an independent sample would be helpful to reproduce our results also on tissue with different processing and by using different stains. However, latent profile models are very conservative, are data driven (and so cannot be affected by any preliminary hypothesis), and are minimally affected by sample size. Still, a larger sample size would have allowed more thoughtful clinical correlations.
In conclusion, we defined three main profiles of MS pathology characterized by subtle chronic tissue remodelling with diffuse infiltrates of macrophages/microglia and astrocytes (profile 1 – active remodelling), mitochondrial dysfunction and active inflammation (profile 2 – mitochondrial dysfunction), and chronic tissue damage in absence of active pathogenetic processes (profile 3 – inactive). Each profile presented with rather specific clinical correlates. The possibility to classify each patient depending on his/her prevalent pathology profile support the concept of MS immunopathological homogeneity within the same patient and heterogeneity between different patients. Of course, each patient presented with a dominant pathology profile (Table 1), but
33
different pathogenic mechanisms occurred at the same time. In the future, in vivo detection of pathology profiles should consider already existing neuroimaging techniques that are able to detect the main determinants of each profile (e.g., neuro-axonal/myelin content, microglia, and mitochondrial function) (Ciccarelli et al., 2014; J. van Horssen et al., 2012; Marcello Moccia and Ciccarelli, 2017).
34
5. Pathological correlates of magnetization transfer ratio in multiple
sclerosis
5.1 Introduction
Defining the pathological specificity of MRI techniques improves their usefulness in clinical trial design and the interpretation of observational studies (Wattjes et al., 2015). However, post-mortem MRI-pathological studies are scarce because of the technical challenges posed by the integration of
post mortem MRI with histologic analysis, the difficulty in obtaining post mortem material, the long
duration of scanning, and the need for interpretation of normal post mortem changes (Filippi et al., 2012).
MTR is an objective index of the capacity of macromolecules to exchange magnetization with the surrounding water, indirectly estimating the extent of tissue damage (Mallik et al., 2014). MTR values are lower in patients with MS than healthy controls (Bodini et al., 2016), especially in patients with progressive MS, and with worse motor and cognitive disability (Stangel et al., 2017). Longitudinal evaluation of MTR changes has been used to detect in-vivo a progression of MS pathology (Bodini et al., 2016; Chen et al., 2008), and to measure the effect of new medications in clinical trials (Brown et al., 2016; Fox, 2018; Romme Christensen et al., 2014).
MTR assessment in these clinical trials has been mostly interpreted as a method to probe myelin status within WM lesions (Brown et al., 2016; Schwartzbach et al., 2017), although axonal loss may also contribute to MTR changes in MS (Chen et al., 2013; Fisher et al., 2007; Moll et al., 2011; Schmierer et al., 2004; Schmierer, Parkes, et al., 2010). Therefore, the main pathological determinant of MTR changes remain unclear.
35
We aimed to identify the main histologic correlate(s) of MTR and to investigate whether they varied between lesions and NA WM and GM by applying a novel methodology to align MRI to histology (Pichat et al., 2018), on a large sample of patient and healthy control brain tissue, with comprehensive histology analysis.
5.2 Methods
5.2.1 Subjects
Tissue for this study was provided by the United Kingdom MS Tissue Bank at the Imperial College London, under ethical approval from the National Research Ethics Committee. The study followed Human Tissue Act guidelines. All MS patients (n=16) and controls (n=4) had provided informed consent to donate tissue for MS research. Informed consent of the next of kin of the healthy subject was obtained before the inclusion of the tissue in this study. The methods are summarized in Figure 6.
5.2.2 Tissue handling
From each brain, a single coronal cut through mammillary bodies was done to separate brain into anterior and posterior halves. Then, 1 cm-thick coronal slices were cut through entire brain using the 1 cm guide and, for the present study, the second slice posterior to the mammillary bodies towards the occipital pole was included. Slices were immersed in 10% buffered formaldehyde solution for a minimum of seven days, allowing full fixation.
36
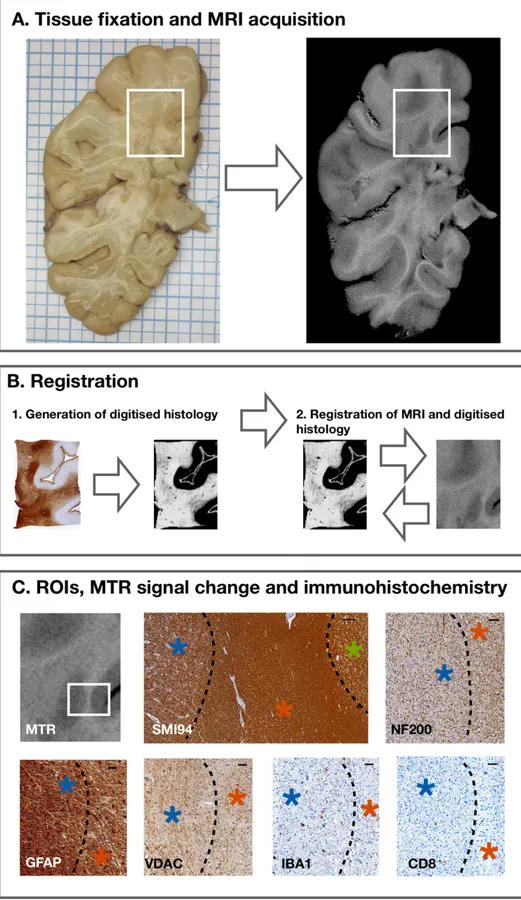
Figure 6. Tissue fixation, MRI acquisition, immunohistochemistry, registration and ROI definition.
In (A), a fixed brain slice on the left and its corresponding MTR image on the right are shown. Several tissue blocks were obtained from each slice, based on MRI and visual inspection. An example of a cassette is shown in the white box. In
(B), digitized quantifiable histological images are shown; they were generated for each stain and aligned spatially (1). MRI images were then registered to the space of digitized quantified histological images (2). In (C), different ROIs were
analysed on both MRI and
immunohistochemistry. MTR image and its corresponding
immunohistochemistry (white
box) are presented. Higher MTR signal corresponded to
compact myelin (SMI94, scale
bar 250μm) in NAWM (red asterisk), followed by WM
lesion (blue asterisk), and NAGM (green asterisk). In WM
lesions, there was reduction in
neuro-axonal structures (NF200, scale bar 50μm),
astrocyte infiltrates (GFAP,
scale bar 50μm), and impaired mitochondrial function (VDAC,
scale bar 50μm), compared with NAWM. Also, infiltrates
of microglia/macrophages and cytotoxic T-cells were studied
(IBA1 and CD8, respectively,
37
5.2.3 MRI acquisition
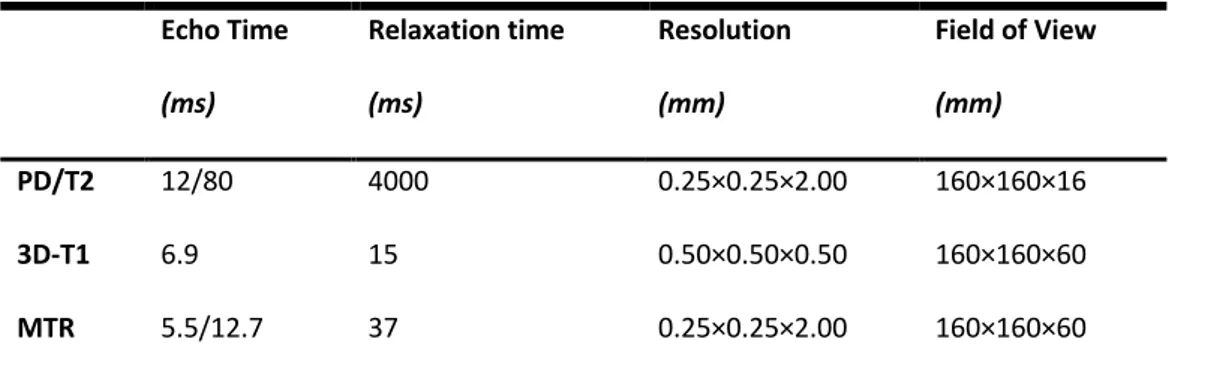
Before scanning, formalin-fixed tissue was washed thoroughly with phosphate-buffered saline (PBS), and placed flat in an MRI-compatible container made of Plexiglas and filled with PBS. The MRI plane was positioned parallel to the coronal tissue slice. Proton density-weighted (PD), T2-weighted (T2) and T1-weighted (T1) spin-echo, and gradient-echo MTR sequences were acquired using a clinical scanner (3T Philips Achieva, Philips Healthcare, Best, Netherlands) with a 32-channel head coil and multi-transmit technology. The MRI acquisition included the whole 1 cm-thick tissue slice. For MTR measurement, two sets of images were obtained using a 3D slab-selective FFE sequence with two echoes (TE1/TE2=5.5/12.7ms), with (MS) and without (M0) sinc-Gaussian shaped MT pulses of nominal α=360o, offset frequency 1 kHz. Then, MTR maps were calculated using the standard equation: (M0−MS/M0)×100. The entire scanning protocol lasted approximately 5 hours and was run at room temperature. Further details on MRI acquisitions are given in Table 5.
Table 5. Parameters of MRI sequences Echo Time (ms) Relaxation time (ms) Resolution (mm) Field of View (mm) PD/T2 12/80 4000 0.25×0.25×2.00 160×160×16 3D-T1 6.9 15 0.50×0.50×0.50 160×160×60 MTR 5.5/12.7 37 0.25×0.25×2.00 160×160×60
MRI: magnetic resonance imaging; PD: proton density-weighted sequence; T2: T2-weighted sequence; 3D-T1:
T1-weighted sequence; MTR: magnetization transfer ratio.
5.2.4 Immunohistochemistry
After scanning, brain slices were sectioned into different 5 mm-tick tissue blocks (each approximately 20×30 mm in size) (101 blocks in 20 cases/controls, on average 5.0 blocks per brain slice) (Figure 6A). Blocks' selection was guided by MRI and visual inspection to improve the
38
sensitivity of the selection process (Bö et al., 2004). Serial sections were cut through the block at 5 μm section thickness using the Tissue-Tek AutoSection automated microtome (Sakura Finetek).
Cassettes were paraffin-embedded and immunostained by IQPath (University College London), under the supervision of Prof Sebastian Brandner. Immunostaining was performed using the Ventana Discovery XT instrument and the DAB Map detection Kit (760-124), in compliance with manufacturer instructions. The cassettes were immunostained and quantified for neuro-axonal structures (NF200), myelin (SMI94), macrophages (CD68), B-lymphocytes (CD20), T-lymphocytes (CD3), cytotoxic T-lymphocytes (CD8), microglia (IBA1), astrocytes (GFAP), and mitochondrial activity (COX4, VDAC). Slides were counterstained with hematoxylin (HE). Details of all immunostains are reported in Table 2. Positive and negative controls were included initially when optimizing the stains and, then, only positive controls were included when the antigen was not expected to be present abundantly in the tissue (e.g., CD immunostains).
Immunostained slides were then digitalized as 8-bit RGB images at 40× magnification using a Leica SCN400F slide scanner (Leica Microsystems) (Figure 6B). Digital image analysis was performed with Definiens Tissue Studio software 3.6 (Definiens AG, Munich, Germany) (Patodia et al., 2018), with a resolution of 5× for tissue identification and a resolution of 10× for stain analysis, taking care to exclude any artefacts. Artefacts are excluded from the analysis (e.g., breaks in the section). Images were segmented into pixels of 250×250 µm2 (0.0625 mm2). Considering that the degree of background staining from secondary antibodies can vary greatly among tissue blocks, the intensity threshold for positive labelling was set separately for each immunostain, using an automatic histogram method accounting for variation in background stain levels (Otsu, 1979). This histogram method finds the optimal threshold by minimizing the intraclass intensity variance, which simultaneously maximizes interclass variance. Separate thresholds were set for HE staining which
39
allowed identification of nuclei. Also, the use of nested statistical models further accounted for possible inter-subject variability.
For each pixel, immunostain intensity and its coordinates were exported in CSV files, including brown intensity for immunostains and blue for HE.
5.2.5 Registration
For each cassette, the following three steps were applied to obtain a 2D spatial alignment of MRI and histology (Figure 6B):
1) A subject-wise space was created by group-wise registration of digitized histological images, via consecutive rounds of rigid, affine and non-linear registrations with NiftyReg (version 1.3.9) (Modat et al., 2010, 2014; Pichat et al., 2018);
2) The T2-weighted image that best resembled a given histological image with good contrast was chosen. The selected MR plane was cropped to narrow down the search space and, then, rigid registration was performed (Modat et al., 2014). Rigid registration was preferred over non-rigid to preserve the original shape of the tissue without deformation, thereby reducing the possibility of false correspondences between histology and MRI (Lee et al., 2005; Pichat et al., 2018);
3) MRI sequences were brought to the group-wise space by applying the inverse transformation from the second step to the selected planes (Modat et al., 2010; Pichat et al., 2018).
5.2.6 Image analysis and data extraction
Regions-of-interest (ROIs) were manually delineated on the co-registered MRI and histology with 3D Slicer (version 4.4.0). The detection of ROIs was primarily guided by T2-weighted images, with other MR and histological images used as references, to cover the full spectrum of MS pathology
40
(Kilsdonk et al., 2016). Thus, the normal-appearing tissue was identified on MRI images, but confirmed on histological images with higher contrast (e.g., NF200, SMI94, IBA1, GFAP, COX4, VDAC) (Figure 6C). ROI area was variable depending on the amount of included tissue. The following ROIs were drawn (number of included ROIs is reported): NAWM (n=98), WM lesions (n=61), cortical NAGM (n=89), and cortical GM lesions (n=50) (on average 2.9±1.8 ROIs per tissue block in MS, and 1.8±0.4 in controls). Overall, 298 records (from different cases/controls, blocks, and ROIs) were included in the statistical models.
Mean MTR signal, mean immunostain intensity (percentage of stained area) and ROI area were extracted for each ROI using FSL (version 5.0.9). For data analysis, the intensity of mitochondrial immunostains was combined as follows: percentage of damaged mitochondria = (VDAC-COX4)/VDAC (Roman et al., 2005; Shoshan-Barmatz et al., 2010).
5.2.7 Statistics
First, we explored population characteristics. Differences in age, gender, death-to-fixation interval and cassettes between cases and controls were measured with the chi-square test, Fisher's exact test or Mann-Whitney test, as appropriate. Differences in MTR across ROIs, when considering all patients and controls together, were measured with linear mixed regression models accounting for the hierarchical structure of data (cassettes nested within patients).
Secondly, the association between MTR and each stain (dependent variables) were explored using linear mixed regression models. Fixed-effect variables included in the model were MTR, demographics (age, gender), group indicator (case/control), factors possibly affecting MTR measurement (death-to-fixation interval, T1-weighted values corresponding to the same ROI) (Schmierer et al., 2007), and factors possibly affecting histology quantification (ROI area, total cell
41
count as measured on HE counterstain). These models used the cassettes as the unit of the analysis, with a random subject intercept to account for the nested structure of the data (cassettes nested within patients). In a first model, we additionally fitted an interaction term between group and MTR to explore possible differences in the association of MTR and each stain between patients and controls. Similarly, an interaction term between ROI (using NAWM as reference) and MTR was set to explore possible variations in the association of MTR and each stain between different ROIs.
Finally, to assess the association between MTR and multiple stains simultaneously, so that the strongest correlate(s) of MTR values could be detected, we fitted a multivariate linear mixed regression model (assuming inter-correlation between stains). As multiple outcomes were dependent variables of this model, we selected the stains that were to be significantly associated with MTR in previous models. The multivariate linear mixed regression model was fitted using generalized structural equation modelling. Residuals were checked to confirm model assumptions. Results are presented as coefficients (Coeff), 95% confidence intervals (95%CI) and p-values.
Results were considered statistically significant if p-values were <0.05. Stata 15.0 was used for data processing and analysis.
5.3 Results
The study included 101 tissue blocks from 16 MS brains and four healthy controls, from which we derived 298 ROIs. Mean brain weight was 1241.8±151.8 grams. Death-to-fixation interval was 27.1±11.7 hours. Cases and controls were similar in age, gender, death-to-fixation interval, and the number of cassettes (Table 6). Both secondary progressive MS (n=11) and primary progressive MS (n=5) brains were studied.
42
Table 6. Characteristics of MS cases and healthy controls.
MS (n=16) Controls (n=4) p-values Age, years 66.1±7.1 72.5±7.8 0.199 Gender, female (%) 10 (62.5%) 2 (50.0%) 0.535
Death-to-fixation interval, hours 28.8±11.6 20.2±10.5 0.216
Cassettes, number from each slice 5.2±1.0 4.5±0.6 0.199
PPMS/SPMS, number 5/11
P-values are shown from chi-square test, Fisher's exact test or Mann-Whitney test, as appropriate.
Considering all patients and controls together, MTR values changed across tissue classes, with higher values in NAWM (35.7±8.4), followed by WM lesions (32.5±9.0), NAGM (28.3±8.1), and GM lesions (26.2±7.4) (all p<0.001) (Figure 7).
Figure 7. MTR values across ROIs.
Box-and-Whisker plots show mean MTR values across ROIs. P-values are shown form linear mixed regression models
43
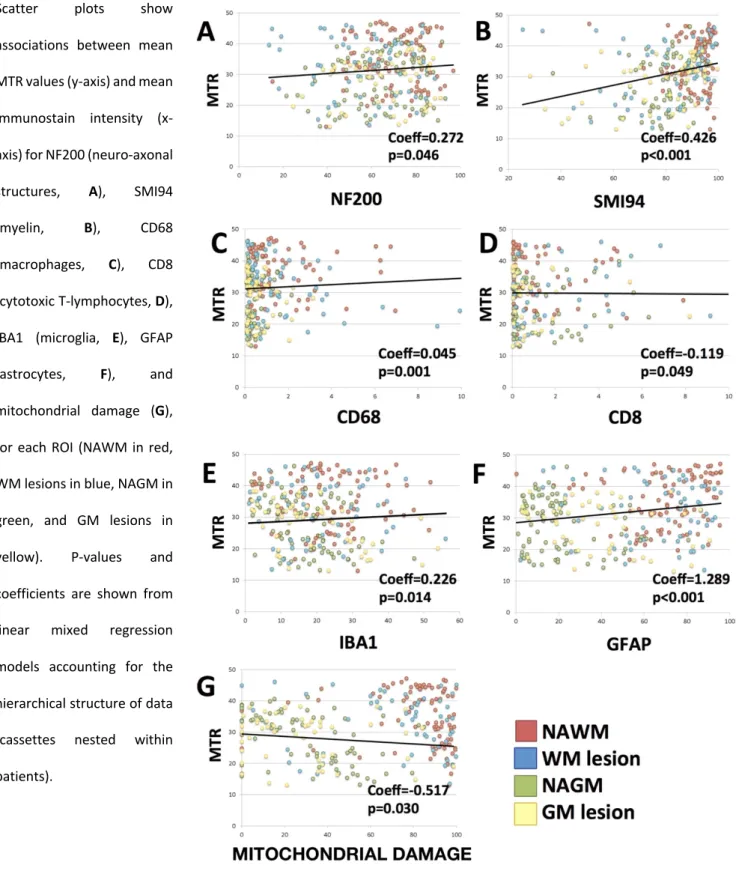
When investigating the association between MTR and histological stains in brains of patients and controls together, lower MTR values were associated with lower NF200, SMI94, CD68, IBA1, and GFAP, with higher CD8, and with a more extensive mitochondrial damage (estimated by combining VDAC and COX4). Coefficients, 95%CI and p-values are reported in Table 7 and Figure 8.
When looking at the differences in the associations of MTR and histological stains between patients and controls and between ROIs, we found that the relationship between MTR and mitochondrial damage was stronger in MS brains when compared with controls (coefficients, 95%CI and p-values are reported in Table 7) and that the strength of the associations varied between GM and WM regions. In particular, when compared with NAWM, the association between MTR and NF200 was stronger in GM lesions, the association between MTR and SMI94 was stronger in NAGM and GM lesions, and the association between MTR and mitochondrial damage was stronger in NAGM, (coefficients, 95%CI and p-values are reported in Table 7). Additionally, when compared with NAWM, the association between MTR and CD68 was less strong in WM lesions, and the association between MTR and IBA1 and GFAP was less strong in NAGM and GM lesions (coefficients, 95%CI and p-values are reported in Table 7).
In the multivariate linear mixed regression model, MTR was independently associated with SMI94, whereas no associations were detected for the remaining stains (coefficients, 95%CI and p-values are reported in Table 7).