Journal of Physics: Conference Series
PAPER • OPEN ACCESS
On-line 2D monitoring of rolling contact
fatigue/wear phenomena in dry tests
To cite this article: I. Bodini et al 2017 J. Phys.: Conf. Ser. 882 012012View the article online for updates and enhancements.
Related content
Feasibility study of a vision system for on-line monitoring of rolling contact fatigue tests
I Bodini, G Sansoni, M Lancini et al.
-Critical plane analysis of multiaxial fatigue experiments leading to White Etching Crack formation
S Averbeck and E Kerscher
-Microscopic observation of shear-mode fatigue crack growth behavior under the condition of continuous hydrogen-charging Y Akaki, T Matsuo, Y Nishimura et al.
-1234567890
XXIV A.I.VE.LA. Annual Meeting IOP Publishing
IOP Conf. Series: Journal of Physics: Conf. Series 882 (2017) 012012 doi :10.1088/1742-6596/882/1/012012
On-line 2D monitoring of rolling contact fatigue/wear
phenomena in dry tests
I. Bodinia, C. Petrogallia, A. Mazzùa, M. Faccolia, M. Lancinia, S. Pasinettib, G. Sansonia, F. Docchioa
aDepartment of Mechanical and Industrial Engineering, via Branze, 38, 25123,
Brescia, Italy
bDepartment of Information Engineering, via Branze, 38, 25123, Brescia, Italy
Abstract. We present the in-field use of a recently developed on-line, real time, optical
monitoring system for bi-disk rolling contact tests on railway-wheel- and rail- steel disks, based on laser illumination and a high-speed camera. Qualitative, as well as quantitative information can be obtained by the use of specific indexes derived from the images using blob analysis. Monitoring the tests provides information about the initial transients of turning-crest removal, on the steady state reached, and on the dynamics of the surface in between. Blob anisotropy is a key element to draw information of the mechanisms governing this intermediate state.
1. Introduction
Bi-disk tests on steels are an effective method to characterize the material response to rolling-sliding contact, as they are able to reproduce the damage phenomena of real components at a laboratory scale in controlled working conditions. These testing procedures have been widely used to characterize materials for bearings, gears, railway wheels and rails (see some examples in [1]-[4]).
In bi-disk rolling contact tests different damage mechanisms can interact and affect each other, such as wear, Rolling Contact Fatigue (RCF), strain hardening, ratcheting, etc., as presented in [5], and [6]. Recognizing and monitoring all these phenomena is a key issue for material characterization. However, usually this is performed by means of “gross” parameters, such as weight loss and coefficient of friction, which emphasize the main effects of these phenomena, but do not yield information about the mechanisms leading to them (adhesive or abrasive wear, pitting or spalling, etc.).
A deeper knowledge of the temporal evolution of the surface topology can provide additional key information for identifying damage phenomena, even providing clues of what is happening under the contact surface, which can be directly detected only by means of destructive testing. Surface topology is usually monitored by means of image acquisition systems, able to give a qualitative idea of what is happening at the contact surface [7]-[9].
The major limitations of the present instrumentation for bi-disk tests are (i) the need to periodically dismount the disks to perform ultrasonic cleaning, weight loss ans Barkhausen noise measurements
1234567890
XXIV A.I.VE.LA. Annual Meeting IOP Publishing
IOP Conf. Series: Journal of Physics: Conf. Series 882 (2017) 012012 doi :10.1088/1742-6596/882/1/012012
[3], (ii) the need to slow-down the testing apparatus for image analysis, and (iii) the non-quantitative output of the image analysis itself.
In a recent paper [10] we presented a novel approach to bi-disk tests, which allows in-line, time dependent, quantitative 2D and 3D analysis of the disk surfaces during the test. The approach is based on (i) multiple laser source illumination (diffuse and line-shaped), a fast camera, and an analog encoder for on-line disk angular position measurement. The analysis of the images is performed using blob analysis and specific indexes that quantify the effects of wear and of RCF at each stage of the test.
We are currently using the test bench presented in [11] for an extensive series of bi-disk tests on innovative steels to be used for train wheels in the near future. These tests, apart from their obvious importance “per se”, are an ideal benchmark to assess the validity of our apparatus in relation to its ability to yield the same information about the sample as derived from the standard approaches, although on a non-invasive, real-time and more quantitative way.
In this paper we show, using four of the steels under tests, how our approach is effective to compare the surface characteristics (i) among the different steels, and (ii) for a single steel, during the test duration, to study the evolution of the disk damage during the test. In particular, we show that the image-analysis indexes are reliable indicators of the state-of-art knowledge on the wear and RCF processes.
2. Materials, instrumentation and procedures
2.1. Materials
Dry rolling contact tests are carried out on disk-shaped samples with diameters of 60 mm and thickness of 15 mm. Four wheel steels have been tested, and in the following, they will be called WS01, WS02, WS03 and WS04, respectively.
Table 1. Hardness [HB] of the four tested wheel steels and Ultimate Tensile Strength (UTS) [MPa].
Hardness [HB] UTS [MPa] WS01 245 623
WS02 286 758 WS03 355 738 WS04 286 758
Due to non-disclosure-agreement, we cannot disclose the chemical composition of the steels, but, in Table 1, we give information about their mechanical properties: WS02 and WS04 have the best mechanical properties among the group and hardness intermediate between WS01 and WS03. This last is characterised by the highest value of hardness. During the test wheel steels samples were coupled with UIC 900A-rail-steel samples, and the friction coefficient was calculated [3]. Figure 1 shows a specimen of WS01 at the end of the test.
1234567890
XXIV A.I.VE.LA. Annual Meeting IOP Publishing
IOP Conf. Series: Journal of Physics: Conf. Series 882 (2017) 012012 doi :10.1088/1742-6596/882/1/012012
2.2. The optical layout and the test bench
A detailed description of the optical apparatus for 2D and 3D surface analysis is given in [10].
The apparatus has been integrated in the bi-disk test bench, as shown in Figure 2. The bench has two input windows W1 and W2, which enable the optical access to the disks under test. L1a and L1b are the two defocused laser sources that provide diffuse light illumination of the sample. L2 is the laser stripe used for 3D measurements (not used in the present set of experiments), whereas L3 is the additional laser stripe that is used, in combination to the analogue encoder mounted coaxially with the sample, to measure on-line the angular position of the sample.
Figure 2. Vision-based measurement system assembled in the RCF test bench.
C is the high-speed camera (Promon 501, AOS Technologies). In these tests it operates at 377 frames per second at a resolution of 1,280x240 px, 8-bit. The images are acquired with an exposure time of 40 μs. The camera lens has the focal length of 50 mm, and this results in a field of view (FOV) of 35 mm × 6.5 mm, with a spatial resolution Rs of 0.027 mm/px.
2.3. Acquisition procedure during the tests
All the samples roll with the same maximum contact pressure of 1.1 GPa, at a speed of 500 rpm and a sliding/rolling ratio of 1%. To comply with the standard testing procedures, the acquisitions are performed before the test (0 kcycles, where a cycle corresponds to a 360° rotation) and after 10, 20, 30, 50, 70, 100 and 130 kcycles. All tests are performed in dry conditions, i.e., air-cooled. Each
1234567890
XXIV A.I.VE.LA. Annual Meeting IOP Publishing
IOP Conf. Series: Journal of Physics: Conf. Series 882 (2017) 012012 doi :10.1088/1742-6596/882/1/012012
acquisition consists of a 2 s-long video stream, and it is acquired @ 377 fps, corresponding to 754 frames.
A typical image obtained by the camera on a rotating disk is shown in Figure 3. In Figure 3(a), as a reference, the sample under test is shown as seen from window W2, illuminated by the diffused sources and by the encoder stripe. In Figure 3(b), the image taken by the camera is shown. Two areas are visible: the left area contains the encoder stripe, whose length is proportional to the angular position, whereas the right area contains the speckle field produced by the rough surface illuminated by the two diffused sources. As described in [10], Regions of Interest (ROIs) are defined within the image for analysis: these are shown in Figure 3(b), delimited by the dashed perimeters. ROI3 is used, in each frame of the sequence, to associate the angular position of the disk to the frame, whereas ROI1 is used for the subsequent image analysis.
(a) (b)
Figure 3. Photograph of the sample under test and acquired image. (a): illumination patterns; (b)
corresponding image. The regions of interest ROI1 and ROI3 are drawn in dashed lines.
2.4. Image analysis and quantitative frame evaluation
Each 2-s video produced on the disk rotating at the operating speed of 500 rpm consists of NT=754
frames equally subdivided over j=1 to 17 revolutions, each in turn formed by k =1 to 46 frames. The situation is depicted in Figure 4. We note that, due to the constraints imposed by (i) the camera settings, and (ii) the field of view deriving from the camera focal length, the frames are partially superimpose. To avoid the redundancy in the analysis, the dimension of ROI1 is set to 4.7 mm (Figure 3(b)).
Figure 4. Diagram of the frames of each acquired video: k-th frame in the j-th revolution.
Y
X
ENCODER
SPECIMEN
k j
1234567890
XXIV A.I.VE.LA. Annual Meeting IOP Publishing
IOP Conf. Series: Journal of Physics: Conf. Series 882 (2017) 012012 doi :10.1088/1742-6596/882/1/012012
Indexes are obtained in two ways: (i) integral indexes, obtained by averaging on the entire frameset, (ii) angle-dependent indexes, obtained by averaging over frames corresponding to the same angular position of the sample on the shaft.
For every blob in each frame, we derive:
• The blob area, a.
• The blob asymmetry index, as, defined as the ratio between the height and the width of the
rectangle enclosing the blob (if as > 1 the blob is oriented along the vertical direction Y, if
as < 1 the blob is oriented along the horizontal direction X, if as = 1 the blob is
round-shaped).
For every frame (j,k), we derive the blob number n(j,k), i.e., the number of blobs in the ROI, and hence:
• The average blob area , , in the ROI;
• The damage ratio index, , , i.e., the ratio of , divided by the total ROI area;
• The average asymmetry , in the ROI.
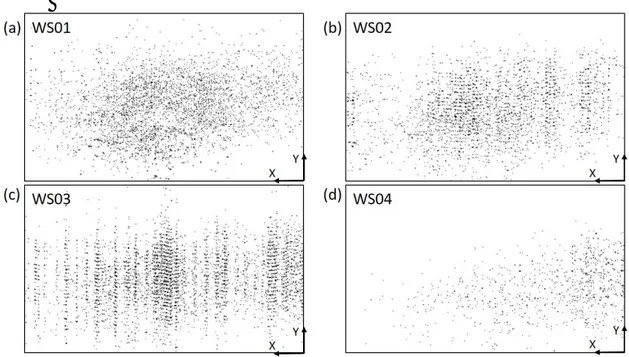
Figure 5. Blob-rendered pictures of the four steels used in the study after 30 kcicles. (a) specimen
WS01, (b) WS02, (c) WS03, and (d) WS04.
As an example of the different appearance of the blobs in different situation and/or in different materials, Figure 5 shows the blob-rendered pictures of the four steels used in the study after 30 kcycles (the angular position is 0°, corresponding to j = k = 1). The blobs in the four images differ in size, number, asymmetry (with particular emphasis to Figure 5(b) and Figure 5(c) where they are evidently horizontally oriented) and position in the frame (the blobs in Figure 5(d) are predominantly in the bottom-right part of the frame). This justifies the choice of the above parameters to characterize the phenomenon.
A further level of detail is reached by dividing the blobs into classes, depending on the blob dimensions. Classes are defined as illustrated in Table 2.
For every frame (j,k), we derive the blob number , , i.e., the number of blobs in the ROI belonging to the i-th class, and hence:
• The average blob area , , in the ROI
1234567890
XXIV A.I.VE.LA. Annual Meeting IOP Publishing
IOP Conf. Series: Journal of Physics: Conf. Series 882 (2017) 012012 doi :10.1088/1742-6596/882/1/012012
• The average asymmetry , , .
Global indexes can be derived by averaging each of the above indexes over all the frames having the same angular position, or over the entire frameset. In particular, in the following, we use:
• RB, i.e. the average of , over the entire frameset;
• Ni, i.e., the average of , over the entire frameset;
• AS,i, i.e., the average of , , over the entire frameset.
The standard uncertainty of each of the above indexes has been calculated as the standard deviation of the populations , , , , and , , , respectively.
Table 2. Classification of the blobs.
Class Area range [10-3 mm2]
C1 1.5 <a < 3.7 C2 3.7 <a < 10.9 C3 10.9 <a < 21.9 C4 21.9 <a < 51.0 C5 a > 51.0 3. Results
3.1. Time evolution of the steel disk damage
The efficacy of the on-line derived indexes resulting from the application of the optical setup described above can be demonstrated with the use of examples of time-dependent behaviours of single or multiple steels used in the current tests. An example is given by the time-related behaviour of the damage ratio RB as a function of the number of cycles in steel W02. The results are summarized in
Table 3. From the table we note that RB has a markedly time-dependent behaviour, starting from
0 kcycles where it is negligible, reaching a peak at 10 kycles, decreasing up to 50 kcycles, and remaining almost constant thereafter until the end of the test (given the standard uncertainties, the values are compatible).
Table 3. Time-evolution of the average damage ratio RB of the surface of the specimen made of
WS02.
Number of cycles [kcycles] RB [%]
0 0.011 ± 0.019 10 9.23 ± 0.73 20 5.66 ± 0.54 30 4.14 ± 0.61 50 0.85 ± 0.17 70 0.97 ± 0.13 100 0.81 ± 0.11 130 1.46 ± 0.49
These results are consistent with the known mechanism of material removal described in [12]. In fact, it is well-known that, during bi-disk tests, the wear phenomenon exhibits two experimentally recognizable stages: an early stage, with transient wear-rate, and a consequent steady-state stage, with quasi-stable wear-rate [13]. The former stage is mainly caused by the contact between the asperities of the two specimen surfaces. The latter stage (occurring after 50 kcycles) is due to the well-known competition between wear and RCF [4], where wear continuously removes surface material layers and flattens out the product of RCF (that is, the formation of cracks) [10]. This is , to our knowledge, the first time where the evidence of these sequence of phenomena and of their competition is demonstrated quantitatively and located correctly in time with non-invasive way, and online, without the need of examining the sample at different stages of test.
1234567890
XXIV A.I.VE.LA. Annual Meeting IOP Publishing
IOP Conf. Series: Journal of Physics: Conf. Series 882 (2017) 012012 doi :10.1088/1742-6596/882/1/012012
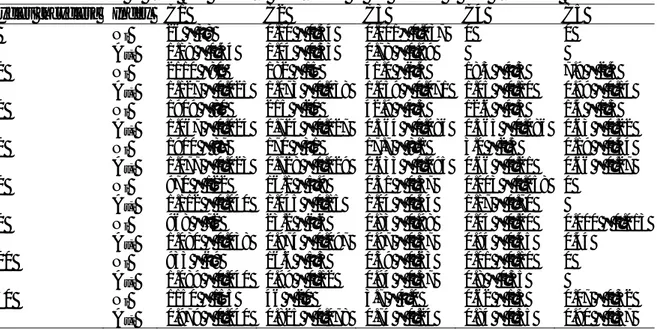
Table 4. Time-evolution of the indexes Ni and As,i, for the specimen made of WS02, grouped into
classes of area. The standard uncertainty of the indexes is also presented. Cycles [kcycles] Index C1 C2 C3 C4 C5
0 Ni 26 ± 38 0.10 ± 0.34 0.001± 0.037 0 0 As,i 1.18 ± 0.44 1.04 ± 0.53 0.78 ± 0.99 10 Ni 2110 ±80 182 ± 15 41.0 ± 6.4 18.3 ± 4.3 7.9 ± 2.4 As,i 1.127 ± 0.025 1.073 ± 0.038 1.059 ± 0.071 1.05 ± 0.10 0.99 ± 0.14 20 Ni 1909 ± 80 215 ± 20 42.9 ± 4.3 12.6 ± 4.3 1.4 ± 1.3 As,i 1.067 ± 0.024 0.724 ± 0.027 0.564 ± 0.086 0.565 ± 0.086 0.63 ± 0.22 30 Ni 1900 ± 87 170 ± 31 17.7 ± 8.1 3.0 ± 2.5 0.19 ± 0.44 As,i 1.077 ± 0.023 0.728 ± 0.029 0.633 ± 0.095 0.66 ± 0.21 0.66 ± 0.27 50 Ni 970 ± 122 16.1 ± 5.9 0.31 ± 0.57 0.003 ± 0.058 0 As,i 1.112 ± 0.040 1.045 ± 0.15 1.04 ± 0.44 1.17 ± 0.70 70 Ni 968 ± 72 23.2 ± 6.6 0.83 ± 0.98 0.04 ± 0.20 0.000 ± 0.013 As,i 1.080 ± 0.038 0.974 ± 0.097 0.97 ± 0.37 0.94 ± 0.45 0.44 100 Ni 933 ± 69 16.6 ± 5.3 0.39 ± 0.63 0.01 ± 0.10 0 As,i 1.089 ± 0.040 0.99 ± 0.12 0.94 ± 0.37 0.8 ± 0.35 130 Ni 1150 ± 155 46 ± 20 3.7 ± 4.0 0.62 ± 1.3 0.07 ± 0.32 As,i 0.979 ± 0.040 0.825 ± 0.078 0.74 ± 0.24 0.84 ± 0.35 0.90 ± 0.37
The above evidence is further supported by the analysis of the temporal evolution of (i) the class-specific number of blobs Ni, and (ii) their average asymmetry index AS,i. This evolution is shown in
Table 4. At 0 kcycles the only particles having non-negligible number are the very small (C1) ones. They are predominantly round-shaped, and this is consistent with the machined surface of the new specimens. At 10 kcycles, the blobs of all classes increase in number and are almost all round-shaped: this is consistent with the hypothesis of crest removal during the contact in the early stage.
Between 10 and 30 kcycles, while the smallest (C1) and the largest (C4-C5) decrease in number, the intermediate ones (C2-C3) increase in number. All blobs apart from the smallest are horizontally oriented.
Between 30 and 50 kcycles, all blobs decrease rapidly with respect to their peak value: the smallest blobs (C1) remain round-shaped whereas the others (C2-C5) maintain their orientation. After 50 kcycles, all classes of blobs remain constant in number, with strong prevalence of the smallest ones, and the previously horizontal ones become round shaped again.
This behaviour of the class- and time-dependent blob number and asymmetry is very well consistent with the state-of-art knowledge of the phenomenon. On one side, it confirms the evidence that, after 50 kcycles, all blobs are fairly constant and round-shaped, thus demonstrating the presence of the steady state with quasi-stable wear rate. On the other side, the change of shape between 20 and 30 kcycles towards the horizontal direction is very well consistent with the assumed onset of unidirectional friction of the contact surfaces with an induced plastic flow, which results in the formation of corrugations with a typical wavy aspect [11].
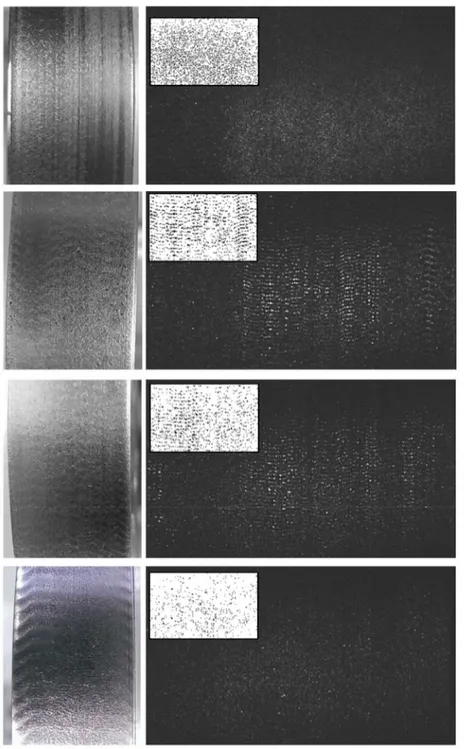
To visually appreciate the data given in tabular form and discussed above, we show in Figure 6 the visual appearance (left) and the acquired frame with a zoomed view of the blobs (right) of WS02 in the most significant sections of the test, i.e., after 10, 20, 30 and 50 kcycles (top to bottom). In the visual sample the onset of the wavy pattern is well evident at 20 and 30 kcycles, with no trace of it at 10 and 50 kcycles. The wavy pattern visible on the sample after 50 kcycles is due to variations of the surface colour related to the oxidation of the material, during the test. Correspondingly, the light pattern acquired from the camera, evidenced by the zoomed blob patterns, clearly show the horizontal elongation of larger blobs, and the round shape of the smaller ones.
1234567890
XXIV A.I.VE.LA. Annual Meeting IOP Publishing
IOP Conf. Series: Journal of Physics: Conf. Series 882 (2017) 012012 doi :10.1088/1742-6596/882/1/012012
Figure 6. Visual appearance of the sample surface (left), acquired frames with a zoomed view of the
blobs of steel W02 (right) from 10 to 50 kcycles (top to bottom).
3.2. Material synopsis and comparison
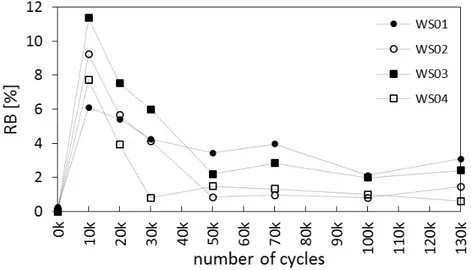
The on-line, non-contact characterization of disks using our optical setup is able to highlight differences in the time evolution between the steels described in Section 2. As an example, Figure 7 shows the time evolution of the damage ratio RB, of the four steel disks. All RB curves present a peak
at 10 kcycles, followed by a decrease and a final steady state. However, the peak amplitude, the descent slope and the final state level are evidently material dependent. WS01 exhibits the lowest peak
1234567890
XXIV A.I.VE.LA. Annual Meeting IOP Publishing
IOP Conf. Series: Journal of Physics: Conf. Series 882 (2017) 012012 doi :10.1088/1742-6596/882/1/012012
value. The descent slope is very soft until the final value at 130 kcycles, the highest value of all samples.
Figure 7. Time evolution of the damage ratio RB, calculated for the four tested steels. Dotted lines are
inserted to increase the clarity of the graph, they do not represent data.
WS04 exhibits a peak value higher than that of WS01, and the highest slope after the peak, with the steady state starting already after 30 kcycles at very low RB values. WS02 and WS03 show the highest
peak values, together with intermediate descent slopes.
The above evidence is well justified by considering steel hardness (Table 1): disks with higher hardness exhibit higher values. Depending on hardness, different mechanisms are responsible for the initial turning-crest removal: in hard materials, crests are removed mainly by brittle micro-fracture, leaving more micro-pits on the contact surface (higher RB). In softer materials, the crests are mostly
flattened by plastic flow, leaving a smoother surface (lower RB) [4], [6], and [8].
The behaviour of RB for WS03 and WS04 is similar to the one observed in steel WS02. In fact,
these three steels present well-separated early stage and steady stage. However, each steel is characterised by a different duration of the early stage, which is typical of the material.
1234567890
XXIV A.I.VE.LA. Annual Meeting IOP Publishing
IOP Conf. Series: Journal of Physics: Conf. Series 882 (2017) 012012 doi :10.1088/1742-6596/882/1/012012
Equally enlightening is the examination of the end-test RB values of the four disks: WS01 and
WS03 exhibit similar RB values, higher than the other two. This is well in agreement with the friction
coefficient measured during the test and shown in Figure 8. Friction calculated for the four studied steels.. WS01 and WS03 have similar friction coefficients and the same holds for WS02 and WS04. The steels with higher RB in the steady state are the ones with higher friction coefficient.
3.3. Detection of possible discontinuous damage over a specimen
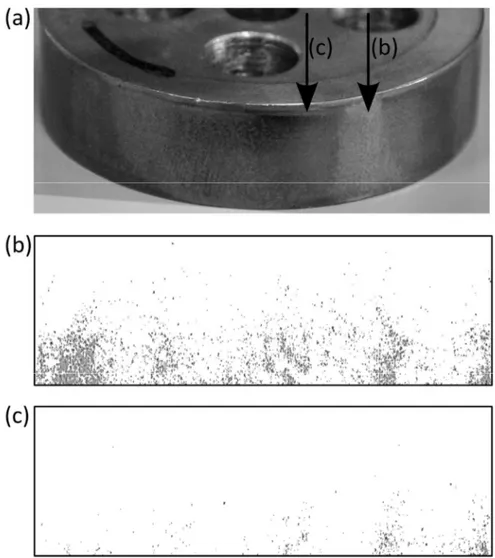
A unique advantage of the online optical system stems from its ability to monitor the temporal evolution of a disk under test on an angle-dependent basis. This makes it possible to quantify and follow in time the so called “polygonal” effect [14]. Figure 9 gives a clear example: the specimen in Figure 9(a) is made of UIC 900 A, which is a rail steel. It underwent an 800 kcycles-long dry test against a wheel-specimen made of Superlos®, and became polygonal during the test, i.e. portions of surface that appear very rough alternated with portions that appear very smooth characterize it.
Figure 9. Detection of damage discontinuity. (a) Polygonal specimen; (b) particles on a portion of the
specimen; (c) particles on another portion of the same specimen.
Considering measurement points evenly spaced, 15° apart one from another, the vision-based measurement system recognizes these two situations in Figure 9(b) and in Figure 9(c), respectively. The former shows a portion with many particles, to which correspond an RB value of
1234567890
XXIV A.I.VE.LA. Annual Meeting IOP Publishing
IOP Conf. Series: Journal of Physics: Conf. Series 882 (2017) 012012 doi :10.1088/1742-6596/882/1/012012
(10.28 ± 0.18) %, the latter shows the consecutive portion, which has a small number of particles and RB equal to (0.880 ± 0.072) %.
The ability of the system to recognize, on-line, a non-uniformity in the damage of different portions of the same surface can be very useful because it is an indicator of incorrect specimen mounting, which should lead to stop the test.
4. Conclusions
In this paper, we have presented, with a number of examples taken by extensive tests in progress in our laboratories, the performance of the on-line, real-time optical monitoring system described in [10]. We have also presented the ability of the indexes derived to provide, in a quantitative way, indications on the temporal evolution of the specimen under test without altering the test flow (e.g. by slowing it or stopping it), and especially without removing the disk for weighing or inspection.
In particular, the optical system can accurately follow the evolution of the surface by identifying the early transient stage and the subsequent steady-state stage. The synthetic indexes introduced are effective in quantitatively describing the surface topology, and can be correlated to quantities used in the common practice to define the steel behaviour in rolling contact tests (such as weight loss and friction).
One of the clear advantages of using the optical system in bi-disk tests is the ability to predict, based on the value of the various indexes, when the specimen is in a steady state, therefore to define the total duration of the test, suggesting to stop it as further monitoring is not important.
The optical system has now firmly become a monitoring companion in bi-disk tests, with a high added value in combination with the measurement of other parameters such as torque, friction, vibrations, and weight loss.
References
[1] Wang W J Lewis R Yang B Guo L C Liu Q Y and Zhu M H 2016 Wear and damage transitions of wheel and rail materials under various contact conditions Wear vol 362-363 p 146
[2] Wei J Zhang A Q and Gao P 2016 A study of spur gear pitting under EHL conditions: Theoretical analysis and experiments Tribology International vol 94 p 146
[3] MazzùA Solazzi L Lancini M Petrogalli C Ghidini A Faccoli M 2015 An experimental procedure for surface damage assessment in railway wheel and rails steels Wear vol 342-343 p 22
[4] Donzella G Faccoli M Ghidini A Mazzù A Roberti R 2005 The competitive role of wear and RCF in a rail steel Engineering Fracture Mechanics vol 72 p 287
[5] Ekberg A and Kabo E 2005 Fatigue of railway wheels and rails under rolling contact and thermal loading – an overview Wear vol 258(7-8) p 1288
[6] Mazzù A Petrogalli C and Faccoli M 2015 An integrated model for competitive damage mechanisms assessment in railway wheel steels Wear vol 322-323 p 181
[7] Zhang J Korsten M and Regtien P 2003 A vision system for online wear detection Proceedings,
XVII Imeko World Congress June 22 – 27 Dubrovnik Croatia p 1960
[8] Soleimani S Sukumaran J Douterloigne K De Baets P and Philips W 2016 Online wear detection using high-speed imaging. Microscopy and Microanalysis vol 22 p 820
[9] Li L and An Q 2016 An in-depth study of tool wear monitoring technique based on image segmentation and texture analysis Measurement vol 79 p 44
[10] Bodini I Sansoni G Lancini M Pasinetti S and Docchio F 2016 A novel optical apparatus for the study of rolling contact wear/fatigue based on a high-speed camera and multiple-source laser illumination, Review of Scientific Instruments vol 87 n. 083701
[11] Donzella G Faccoli M Mazzù A Petrogalli C and Roberti R 2011 Progressive damage assessment in the near-surface layer of railway wheel-rail couple under cyclic contact Wear vol 271 p. 408
1234567890
XXIV A.I.VE.LA. Annual Meeting IOP Publishing
IOP Conf. Series: Journal of Physics: Conf. Series 882 (2017) 012012 doi :10.1088/1742-6596/882/1/012012
[13] Archard J F 1953 Contact and rubbing of flat surfaces Journal of Applied Physics vol 24 p 981 [14] Meywerk M 1999 Polygonalization of railway wheels Archive of Applied Mechanics vol 69
p 105
Acknowledgments
We wish to thank Mr. Gabriele Coffetti and Mr. Silvio Bonometti for their precious support in the experimental activities.
![Table 1. Hardness [HB] of the four tested wheel steels and Ultimate Tensile Strength (UTS) [MPa]](https://thumb-eu.123doks.com/thumbv2/123dokorg/5499757.63198/3.892.266.650.906.1072/table-hardness-tested-wheel-steels-ultimate-tensile-strength.webp)


![Synthesis and characteriation of water soluble C2
and C3 symmetric multi-calix[4]arene dendrimers
and pillararenes a novel class of macrocycle in
supramolecular chemistry](data:image/gif;base64,R0lGODlhAQABAIAAAP///wAAACH5BAEAAAAALAAAAAABAAEAAAICRAEAOw==)