L’AMBIENTE ED IL TERRITORIO
XII Ciclo - Nuova Serie (2011-2013)
DIPARTIMENTO DI INGEGNERIA CIVILE,UNIVERSITÀ DEGLI STUDI DI SALERNO
TESI DI DOTTORATO
QUANTIFYING THE RISK TO LIFE POSED
BY HYPERCONCENTRATED FLOWS
(ANALISI QUANTITATIVA DEL RISCHIO PER LA VITA UMANA DA FLUSSI IPERCONCENTRATI)
ING.GIOVANNA DE CHIARA
Relatore:
PROF. ING.LEONARDO CASCINI Correlatore:
PROF. ING.SETTIMIO FERLISI
Coordinatore
QUANTIFYING THE RISK TO LIFE POSED BY HYPERCONCENTRATED FLOWS
_________________________________________________________________ Copyright © 2014 Università degli Studi di Salerno – via Giovanni Paolo II, 132 – 84084 Fisciano (SA), Italy – web: www.unisa.it
Proprietà letteraria, tutti i diritti riservati. La struttura ed il contenuto del presente volume non possono essere riprodotti, neppure parzialmente, salvo espressa autorizzazione. Non ne è altresì consentita la memorizzazione su qualsiasi supporto (magnetico, magnetico-ottico, ottico, cartaceo, etc.).
Benché l’autore abbia curato con la massima attenzione la preparazione del presente volume, Egli declina ogni responsabilità per possibili errori ed omissioni, nonché per eventuali danni dall’uso delle informazione ivi contenute.
TABLE OF CONTENTS
Table of contents ... i List of figures ... v List of tables ... xi Sommario ... xiii Abstract ... xvii Acknowledgements ... xxiAbout the author ... xxiii
1 Introduction ... 1
2 The flow-like phenomena ... 5
2.1 Classification and general features ... 7
2.2 Debris flows ... 14
2.3 Hyperconcentrated flows ... 16
3 Risk analysis... 21
3.1 General framework of the risk management process ... 23
3.2 Risk analysis ... 25
3.2.1 Scope definition ... 25
3.2.2 Hazard analysis ... 26
3.2.3 Consequence analysis ... 28
3.2.4 Risk estimation ... 34
3.2.1 Qualitative or Quantitative risk estimation ... 34
4 Risk zoning ... 39
4.1 General tools ... 40
4.2 The italian case study ... 45
4.3 Risk zoning in Italy ... 47
4.4 From qualitative to quantitative risk analisys and zoning ... 49
5 Quantitative risk analysis at medium scale: the Campania Region case study ... 51
5.1 The Campania Region ... 53
5.2 The historical database ... 54
5.3 F-N curves for the Campania Region ... 55
5.4 Features of different flow-like phenomena ... 58
5.5 Frequency analysis at regional scale of the two considered classes of flow-like phenomena ... 69
6 Investigation at site-specific scale for QRA ... 77
6.1 The test site ... 78
6.2 Geological and Hydrogeological settings ... 79
6.3 Geomorphological setting ... 82
6.4 In situ tests ... 84
6.5 Laboratory test results ... 87
6.6 In situ test results ... 88
6.6.1 Spatial distribution of the pyroclastic soils and their thickness ... 88
6.6.1 Soil suction regime ... 94
6.7 Analysis of historical incident data ... 95
6.7.1 Results of the historical analysis ... 96
7 Slope evolution model of Monte Albino massif ... 101
7.1 Analysis of geomorphological processes ... 101
7.2 Characterisation of morphological units ... 103
7.3 Characterisation of mountain catchments ... 106
7.4 Characterisation and classification of alluvial fans ... 112
7.5 Empirical analysis of field surveys results ... 115
7.6 Geomorphological slope evolution ... 118
7.7 General features of the prevailing slope instabilities ... 126
8 Geotechnical model and hazard analysis at site-specific scale ... 129
8.1 Susceptibility analysis ... 129
8.2 The frequency analysis ... 131
8.3 Modelling the triggering mechanisms ... 133
8.3.1 Modelling of surface erosion phenomena: The LISEM MODEL ... 135
8.3.2 Modelling of surface erosion phenomena: The input parameters ... 140
8.3.3 Modelling of the channel’s sides instability ... 147
8.4 Hazard analysis ... 151
8.5 Run-out analysis ... 156
9 Quantitative estimation of the risk for life loss at the site-specific scale 165 9.1 The adopted procedure ... 165
9.2 Consequences analysis ... 166
9.2.1 Element at risk and their temporal-spatial probability .... 166
9.2.1 Vulnerability of the elements at risk ... 169
LIST OF FIGURES
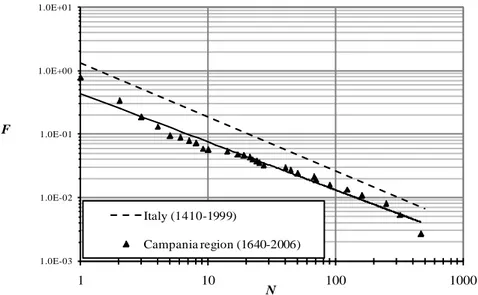
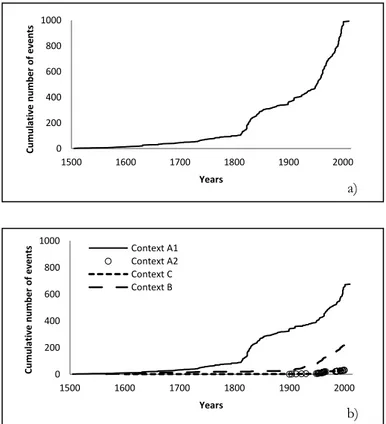
Figure 2.1 Number of natural disasters between 1900 - 2011 (source EM-DAT www.emdat.be)... 6 Figure 2.2 Main type of flow-like phenomena (Hutchinson, 1988). ... 9 Figure 2.3 Continuous spectrum of sediment concentration. (Hutchinson, 1988)... 10 Figure 2.4 Classification of flow-like phenomena as a function of solid fraction and material type (Coussot and Meunier, 1996). ... 11 Figure 2.5 Processes causing dilution of mass and hyperconcentrated flows (Svendsen et al., 2003). ... 19 Figure 3.1 Framework for landslide risk management (Fell et. al, 2008).24 Figure 3.2 Vulnerability curves adopted in the QRA process by the Engineering Control Office in Hong Kong (Wong et al., 2005). ... 34 Figure 4.1 Landslide Index (%). Calculated on a mesh size of 1 km expresses the landslides incidence on the regional territory potentially affected by landsliding phenomena (www.isprambiente.gov.it). ... 46 Figure 5.1 a) The territory of the Campania region (southern Italy); b) Map of the areas of the Campania region where pyroclastic soils cover different bedrocks (modified from Vitolo, 2009). ... 53 Figure 5.2 F-N curves related to fatal landslides in the territory of Campania region and Italy (Cascini et al., 2008 b, modified). ... 56 Figure 5.3 F-N curves related to fatal landslides in the Campania region and in different geo-environmental contexts. All curves refer to a 366-year period between 1640 and 2006 (Cascini et al., 2008 b). ... 57 Figure 5.4 Cumulative curve of flow-like phenomena occurred a) in the territory of Campania region and b) in the geological contexts (A1, A2, B, C) from the 16th century to 2011. ... 59
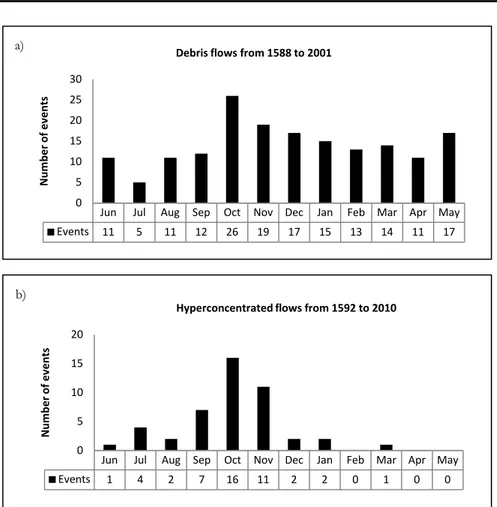
Figure 5.5 Montly distribution of a) debris flows and b) hyperconcentrated flows in the geo-environmental context A1 of the Campania region. ... 61 Figure 5.6 Example of frontal rainfall events triggering debris flows (reconstruction obtained by CERIUS, 2003). ... 63
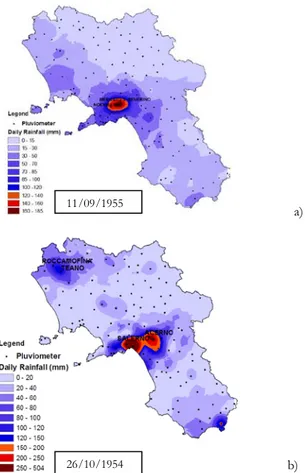
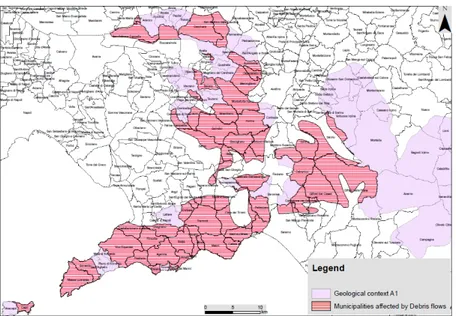
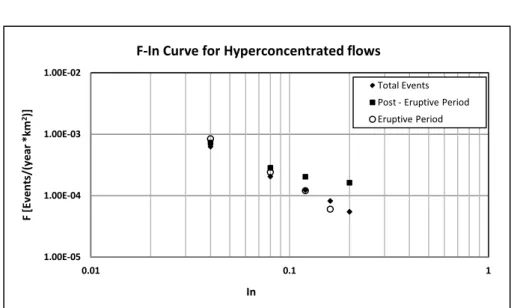
Figure 5.7 Rain events monitored at a) Lauro Town for the debris flows occurred in May 1998 and at b) S. Martino Valle Caudina Town for the debris flows occurred in December 1999 (reconstruction obtained by CERIUS, 2003). ... 64 Figure 5.8 Example of meteorological structures attributable to the occurrence of hyperconcentrated flows: a) Isolated convective cells; b) Hurricane - like rainfall. ... 65 Figure 5.9 Rain events monitored at a) Nocera Inferiore Town for the hyperconcentrated flows occurred in September 1955 and at b) Salerno Town for the hyperconcentrated flows occurred in October 1954. ... 66 Figure 5.10 Spatial distribution in the geological context A1 of municipal territories historically affected by hyperconcentrated flows. ... 67 Figure 5.11 Spatial distribution in the geological context A1 of municipal territories historically affected by debris flows... 68 Figure 5.12. F-In curves for hyperconcentrated flows and debris flows. 70
Figure 5.13 F-Ia curves for hyperconcentrated flows and debris flows. .. 71
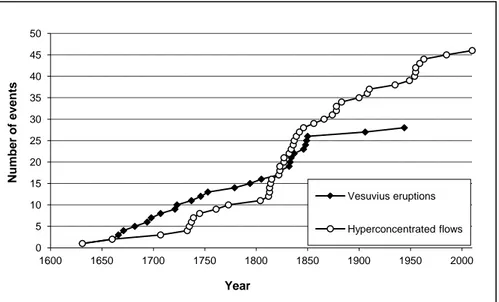
Figure 5.14 Cumulative curves of hyperconcentrated flows events and Vesuvius eruptions interesting the geological context A1. ... 72 Figure 5.15 F-In curves for hyperconcentrated flows with reference to
different time periods. ... 73 Figure 5.16 F-N curve for hyperconcentrated flows with reference to the 20th century. ... 74
Figure 5.17 F-N curves for hyperconcentrated flows and debris flows. . 74 Figure 6.1 a) Geographical setting of the test site of Monte Albino (Google Earth image); b) General overview of Monte Albino slope (photo dated 2011). ... 78 Figure 6.2 Geological map of Monte Albino. ... 80 Figure 6.3 Hydrogeological map of Monte Albino. ... 82 Figure 6.4 DTM obtained on the basis of the data achieved via a LIDAR survey technique (Avioriprese s.r.l., edition of 2005, 1:1,000 scale), with indication of the sites where the in-situ tests were carried out. ... 85 Figure 6.5 In-situ tests: a) Iron-rod drilling; b) Man-made pit; c) Suction measurement; d) Seismic field test; e) Seismograph; d) Dynamic Penetration test. ... 85 Figure 6.6 Grain size distribution of the investigated pyroclastic soil specimens. ... 88 Figure 6.7 Soil cover thickness map. ... 90 Figure 6.8 Typical trend of vertical stratigraphic intervals. ... 91
Figure 6.10 Areal distribution of the class A' lithotype. ... 93
Figure 6.11 Areal distribution of the class B' lithotype. ... 93
Figure 6.12 Soil suction measurements. ... 94
Figure 6.13 Suction value for Pizzo d'Alvano massif (Cascini and Sorbino, 2002). ... 95
Figure 6.14 Urbanised areas affected by hyperconcentrated flows occurred during the 18th and the 19th centuries. ... 97
Figure 6.15 Cumulative distributions of: i) Vesuvius explosive eruptions occurred from 1631 up to now; ii) hyperconcentrated flow incident data (events occurred after the Vesuvius eruptions are circled in red). ... 99
Figure 6.16. Monthly distribution of the hyperconcentrated flows which, in the past, interested the Monte Albino hillslope. ... 100
Figure 7.1 Morphotypes map. ... 102
Figure 7.2 Slope angle map. ... 104
Figure 7.3 Exposure map. ... 105
Figure 7.4 Morphological zoning map. ... 106
Figure 7.5 Mountain catchments along the Monte Albino hillslopes superimposed to a DTM derived from 1-m resolution data achieved via a LiDAR survey. ... 107
Figure 7.6 Longitudinal and transversal track section. ... 108
Figure 7.7 Typical longitudinal profile. ... 109
Figure 7.8 Typical transversal profile. ... 111
Figure 7.9 Transversal profile type distribution. ... 111
Figure 7.10 Alluvial fan distribution. ... 113
Figure 7.11 Field surveys deriving from ISPRA and Nocera Inferiore Municipality. ... 114
Figure 7.12 Iron-rod drillings data correlation with a) slope angle, b) slope angle with N-E exposure, c) elevation and d) curvature. ... 116
Figure 7.13 Dynamic penetration tests correlation with a) slope angle, b) exposure towards the North, c) elevation and d) curvature... 116
Figure 7.14 Correlation between the real thickness of the pyroclastic soils and the slope angle. ... 117
Figure 7.15 Map of theoretical thickness of the pyroclastic soils. ... 118
Figure 7.16 Ranking of Es,bi index. ... 120
Figure 7.17 Ranking of Em,bi index. ... 121
Figure 7.18 Ranking of Em,ui index. ... 122
Figure 7.19 Frontal view of the landslide occurred on March 2005. ... 128 Figure 8.1 Susceptibility map of triggering area of hyperconcentrated
Figure 8.2 Cumulative distributions of hyperconcentrated flow events and Vesuvius explosive eruptions. ... 132 Figure 8.3 Pluviometric probabilistic curves for the Monte Albino test site. ... 134 Figure 8.4 Flowchart of the LISEM model (from De Roo and Jetten, 1999). ... 137 Figure 8.5 Different scenarios of rainfall event. ... 140 Figure 8.6 The adopted soil-water retention relationships (adapted from Bilotta et al., 2005). ... 142 Figure 8.7 Computational slope section constituted of a) pyroclastic soils belonging to class B’ and b) pyroclastic soils belonging both lithotypes (A' and B'). ... 143 Figure 8.8 Soil loss volume value per unit area for different rainfall scenario. ... 145 Figure 8.9 Mixture hydrograph and relative volumetric concentrations at the outlet of mountain catchment B1 for different return period T. .... 146 Figure 8.10 Examined cross-section tracks. ... 147 Figure 8.11 Local coordinate system. ... 148 Figure 8.12 Instability analysis for a) T=50 years, b) T=100 years, c) T=200 years... 150 Figure 8.13 F-M curves for Monte Albino slope. ... 152 Figure 8.14 Hazard maps of hyperconcentrated flows: a) T= 50 years, b) T=100 years and c) T=200 years. ... 154 Figure 8.15 Relationship between hazard and susceptibility in terms of mobilised normalised volumes. ... 155 Figure 8.16 Map of the run-out simulation, via the use of FLO-2D numerical code, of hyperconcentrated flows occurred on 12 September 1955. ... 161 Figure 8.17 Maps of the maximum flow depth (d) reached by the FLO-2D simulated flowing mixtures in each of the computational grid cells for the three considered hazard scenarios (T = 50, 100 and 200 years). ... 163 Figure 8.18 Maps of the maximum flow velocity (v) reached by the FLO-2D simulated flowing mixtures in each of the computational grid cells for the three considered hazard scenarios (T = 50, 100 and 200 years). ... 164 Figure 9.1 Map of the census tracts (data from the Italian National Institute of Statistics-ISTAT 2001 census). ... 168
Figure 9.2 Individual total risk map for the average exposed people in open space posed by hyperconcentrated flows. ... 171 Figure 9.3 Individual total risk map for the most exposed people living within buildings potentially impacted by hyperconcentrated flows. ... 172 Figure 9.4 Urbanised sectors at risk. ... 173 Figure 9.5 Ranking of the urbanised sectors at risk. ... 174
LIST OF TABLES
Table 2.1 Global landslides statistics between 1900-2011 (source EM-DAT www.emdat.be). ... 6 Table 2.2 Abbreviated classification of Slope Movements (Cruden, 1978). ... 8 Table 2.3 Landslides velocity scale (Cruden and Varnes, 1996). ... 8 Table 2.4 General Rheologic Classification of Water and Sediment Flows in Channels (Costa, 1988). ... 11 Table 2.5 Classification of flow-like phenomena (Hungr et al., 2001). ... 13 Table 2.6 Observed or measured characteristics of hyperconcentrated flows to approximate times of peak sediment (Pierson, 2005) ... 17 Table 3.1 Example of assessment by a direct approach of Vulnerability for person in open space (extracted from Finlay et al., 1997). ... 33 Table 3.2 Example of a method for qualitative risk estimation to property (Extracted from AGS, 2000). ... 35 Table 4.1 Methods, levels, and types of zoning at different scales (Cascini, 2008 mod.). ... 43 Table 4.2 Landslide zoning mapping scales and their application (Fell et al., 2008 mod.). ... 44 Table 5.1 Classification of area at risk with reference to flow-like phenomena. ... 57 Table 5.2. Fatal events of hyperconcentrated flows recovered in the 20th
century. ... 73 Table 6.1 Range of main physical properties of A’ and B’ ashy soils. ... 87 Table 6.2 Average values of shear strength parameters of A’ and B’ ashy soils. ... 87 Table 6.3 Recorded incident data of hyperconcentrated flows occurred from 1707 to 1846, with indication of the affected areas. ... 97 Table 7.1 Morphometric characteristics of the mountain catchments. . 107 Table 7.2 Active alluvial fan volume. ... 115 Table 7.3 Es,bi index value for each mountain catchment of Monte Albino
hillslope. ... 119 Table 7.4 Em,bi index value for each mountain catchment of Monte
Table 7.5 Residual pyroclastic soil volumes per unit area. ... 123 Table 7.6 Vm Index value... 124
Table 7.7 Comparison of morphological indices at the mountain catchment scale. ... 125 Table 8.1 Susceptibility matrix for the triggering of hyperconcentrated flows. ... 130 Table 8.2 Main data on the critical rainfalls that triggered hyperconcentrated flows over Monte Albino hillslope. ... 133 Table 8.3 Rainfall characteristics for Monte Albino test site. ... 134 Table 8.4 Input parameter values of LISEM for the different types of use of land. ... 143 Table 8.5 Sediment concentration by volume and soil loss volume at the outlet of mountain catchments for different return period T. ... 144 Table 8.6 Instability channel’s sides volumes and volumetric concentration of sediments. ... 151 Table 8.7 Hazard matrix for the triggering of hyperconcentrated flows. ... 153 Table 8.8 An overview of several 2D dynamic numerical run-out models (from Quan Luna, 2012) ... 158 Table 9.1 Global indicator values (GIk) associated to the different census
tracts and the corresponding temporal-spatial probabilities pertaining to the average persons at risk living within. ... 168 Table 9.2 Temporal-spatial probability value adopted on the basis of the age of the inhabitants for most exposed persons. ... 169 Table 9.3 V(D:T) values adopted with reference to the vulnerability of the
average person in open space exposed at the hyperconcentrated flow risk. ... 170 Table 9.4 V(D:T) values adopted with reference to the vulnerability of the
person most exposed at the hyperconcentrated flow risk. ... 170 Table 9.5. Average number of expected casualties per event for each of the considered urbanised sector at risk. ... 173
SOMMARIO
Nei ultimi anni, a causa del notevole incremento della pressione demografica e dell’uso indiscriminato del territorio, i disastri causati dai fenomeni franosi sono risultati in tragico aumento.
Nell’ambito delle diverse tipologie di frane, alla categoria dei “flussi” - che in molti casi affliggono aree vaste – si associano le più gravi conseguenze in termini di perdita di vita umana e di danni economici. Pertanto, la comprensione dei meccanismi che si associano alle loro diverse fasi di movimento, come pure la previsione e la mitigazione del rischio ad esse associato, rappresentano aspetti conoscitivi e applicativi di fondamentale importanza nelle iniziative mirate alla salvaguardia della vita umana. Per la rilevanza del tema, si è assistito ad un crescente interesse da parte della Comunità tecnica e scientifica verso lo sviluppo di criteri volti all’analisi del rischio da frana, promuovendo il ricorso a metodologie di tipo quantitativo (Corominas et al., 2013).
La presente Tesi si concentra sull'utilizzo di procedure di analisi quantitative del rischio (QRA) finalizzate, nello specifico, alla stima del rischio di perdita di vita da fenomeni franosi di flusso.
Le forti ricadute applicative del QRA risiedono nella possibilità di superare alcuni limiti insiti nelle procedure di stima qualitativa, permettendo di affrontare in maniera compiuta e semplice i problemi legati alla gestione del rischio (ad esempio, la classificazione delle aree che prioritariamente necessitano di azioni di mitigazione del rischio o l'allocazione delle risorse finanziarie ed economiche ad esse associate). Tuttavia, a livello internazionale sono forniti principalmente contributi di carattere teorico sull’argomento. Tale circostanza è da legare alla intrinseca complessità delle procedure da adottare nel QRA e alla significativa mole di dati di input necessari (sia di natura tecnica e sia di natura socio-economica). A tal proposito, la presente Tesi si pone il principale obiettivo di superare le difficoltà insite nel QRA applicando, migliorando ed ottimizzando il suo impiego come strumento formale e strutturato utile ai professionisti coinvolti nel complesso processo di gestione del rischio da frana.
A tal riguardo, le attività di ricerca si sono concentrate sulla stima quantitativa del rischio di perdita di vita umana, a scala media e di sito, a seguito del verificarsi di flussi iperconcentrati.
La Tesi fornisce, preliminarmente, una descrizione delle principali caratteristiche dei fenomeni di flusso, rivolgendo particolare attenzione alle colate e ai flussi iperconcentrati. Vengono, nel seguito, discussi i fondamenti teorici e gli approcci metodologici (con i loro limiti e potenzialità) dell'analisi del rischio e della conseguente zonazione condotta con procedure di stima qualitativa e quantitativa. Si presenta, quindi, un inquadramento generale della zonazione del rischio vigente in Italia, condotta attraverso procedure di stima qualitativa.
Sulla base di tali premesse, si evidenziano i benefici rilevanti che, a livello regionale e a scala di sito, possono derivare dall'impiego di una procedura di stima quantitativa del rischio rispetto ad una qualitativa.
A scala media, l'analisi di documenti storici di eventi franosi occorsi nella regione Campania (sud Italia) ha consentito l'individuazione e la caratterizzazione delle differenti fenomenologie di flusso rapido che in essa possono manifestarsi. In particolare, queste ultime sono state individuate in un contesto geologico omogeneo, i cui versanti carbonatici sono ricoperti da terreni piroclastici sistematicamente affetti da fenomeni di instabilità, legati ad eventi pluviometrici critici, evoluti - spesso con catastrofiche conseguenze in termini di perdita di vita e di proprietà - in colate o flussi iperconcentrati.
Studi così approfonditi hanno consentito il raggiungimento di risultati originali dai quali sono scaturite considerazioni di grande interesse applicativo sulla distribuzione spaziale e temporale (in termini di frequenza) delle fenomenologie di interesse e sulle condizioni iniziali e al contorno che preludono al loro accadimento.
A scala di dettaglio, l'attività di ricerca si è incentrata sulla stima quantitativa del rischio di perdita di vita con riferimento alla popolazione residente nell’area urbanizzata ai piedi del Monte Albino (ubicato nel Comune di Nocera Inferiore (SA), Regione Campania), a seguito del verificarsi di flussi iperconcentrati.
L'originalità delle procedure proposte consiste nel coniugare i fondamenti della teoria del rischio con l'approccio geotecnico, puntando alla profonda comprensione della meccanica che presiede alle diverse e complesse fasi di movimento dei fenomeni oggetto d’interesse.
versante e di identificare i fattori che lo predispongono a differenti fenomeni di instabilità, di caratterizzare la distribuzione areale delle coltri piroclastiche e il loro assetto lito-stratigrafico) ed analisi di laboratorio (al fine di avere una completa caratterizzazione fisica e meccanica dei terreni coinvolti). Tale studio ha rappresentato il presupposto indispensabile per la corretta modellazione ingegneristica dei fenomeni a scala di dettaglio - dalla fase di innesco a quella di propagazione - pervenendo in tal modo a diversi scenari di pericolosità.
I risultati ottenuti sono stati impiegati per la stima delle conseguenze attese in termini di perdita di vita umana con riferimento sia all'individuo maggiormente esposto all'interno di ciascun edificio impattato dal flusso (a cui compete la più alta probabilità spaziale e temporale) e sia all'individuo mediamente esposto al rischio in spazi aperti (il cui comportamento è mediamente rappresentativo di un insieme di persone).
La procedura di stima quantitativa del rischio ha consentito, infine, di classificare le porzioni di territorio urbanizzato a rischio e, di conseguenza, di individuare le aree che necessitano prioritariamente di interventi strutturali di mitigazione del rischio.
ABSTRACT
In recent years, the disasters caused by landslides tragically increased due to the demographic growth and the indiscriminate use of land. Among the different types of landslides, flow-like phenomena - often simultaneously affecting large areas - are associated with the most catastrophic consequences in terms of loss of human life and economic damage.
Understanding, forecasting and controlling the risk posed by flow-like phenomena are now recognised to be a priority for the safety of human life. As a result, a growing interest of both technical and scientific Communities, in performing risk analyses aimed at estimating the risk in a quantitative way has been recorded (Corominas et al., 2013).
This PhD Thesis focus on the use of the quantitative risk analysis (QRA) procedures, specifically aimed at estimating the risk to life posed by flow-like phenomena.
The use of QRA can allow the overcoming of some limits inherent to qualitative risk analyses in addressing practical problems (i.e. the prioritisation of management and mitigation actions as well as the allocation of associated resources). However, mainly theoretical contributions are provided on the topic at the international level. This can be due to the complexity of the procedures to be adopted for QRA purposes as well as to the significant amount of required input data (of both technical and socio-economic nature). The main goal of this research is to fill this gap by applying, improving and optimising the use of the QRA as a formal and structured tool for professionals involved in the management of the risk posed by flow-like phenomena.
In this regard, the research activities focus on the quantitative estimation of the risk for loss of life, at medium and site-specific scale, posed by the occurrence of hyperconcentrated flows.
The Thesis preliminarily provides a description of the main features of the flow-like phenomena, with an emphasis to those dealing with debris flows and hyperconcentrated flows. Then, the basic concepts and methodological approaches (with their limits and potentialities) of both qualitative and quantitative risk analysis and zoning are discussed. An
overview of the current risk zoning in Italy, performed via qualitative risk analyses, is thus presented.
On the basis of the above premises, the relevant benefits that, at regional and at site-specific scales, can be achieved passing from a qualitative to a quantitative risk analysis are highlighted.
At medium scale, the analysis of historical records of landslide events in the Campania region (southern Italy) allows the identification and the characterisation of the different flow-like phenomena that may occur. In particular, these latter are individuated within a homogeneous geological context where carbonate slopes are covered by pyroclastic soils systematically affected by rainfall-induced slope instabilities later propagating as – often catastrophic in terms of life and properties losses – debris flows or hyperconcentrated flows.
The thorough studies and researches carried out as well as the original results achieved allow to make relevant considerations – from both technical and scientific points of view – concerning both their spatial and temporal distribution (in terms of frequency) and the initial and boundary conditions which influence their occurrence.
At detailed scale, the research activity focus on the quantitative estimate of the risk to life loss with reference to residents at the toe of Monte Albino (located in the Municipality of Nocera Inferiore (SA), Campania region), posed by the occurrence hyperconcentrated flows.
The novelty of the proposed procedure consists in conjugating the fundaments of the risk theory with the geotechnical approach, providing a deeper understanding of the mechanisms that leads to the different and complex stages of movement. To this aim, a thorough in-situ investigations (with the purpose of framing the geological and geomorphological characteristics and to identify the 'hillslope' proneness to different slope instabilities, to characterise the spatial distribution of soil pyroclastic covers and their litho-stratigraphic structure) and laboratory tests (in order to have a complete physical and mechanical characterisation of the involved soils) are carried out. This study represents the indispensable prerequisite for the correct engineering modelling of phenomena at detailed scale - from the triggering stage to the propagation stage - obtaining in this way the definition of different hazard scenarios.
The obtained results are used to estimate the expected consequences in terms of loss of human life with reference both to the most exposed
highest temporal-spatial probability) and to the average exposed person in open space (representing the average behaviour of a group of people). Finally, the procedure of quantitative risk estimate has allow to rank the portions of the urbanised territory at risk and, consequently, to provide a prioritisation of the areas needing structural mitigation measures.
ACKNOWLEDGEMENTS
The extraordinary experience of the PhD course has been characterised by an infinite variety of positive emotions and great satisfaction. It would not have been possible without the involvement of many people to whom I want to express my deepest and most sincere gratitude.
Above all, I would like to say a special thanks to my tutor Prof. Leonardo Cascini for making possible the attainment of this long path of cultural and human growth and for his trust in me, for which I will always be indebted. I am very grateful for his continuous encouragement and guidance throughout this exciting challenge.
Words can never be enough to thank my co-tutor Prof. Settimio Ferlisi that can be defined as my “SHADOW”. He was always available in good
and bad times, with the right solution and smart approach for every situation. Thanks for going through every word of this thesis and making the right comments.
Special thanks go to Doct. Fabio Matano for his availability and for the interesting discussion about the geologic aspects that allowed me to improve this work.
A heartfelt thanks to Prof. Sorbino who with his critical spirit has given me valuable suggestions and support for the development of the thesis. I am sure that in heaven He can appreciate and He will be proud of the obtained results.
A dutiful thanks go to the whole Teachers's College of the PhD Course of Civil and Environmental Engineering for the helpful suggestions provided.
I cannot miss in this list all colleagues and all people that animate the geotechnical laboratory "Giuseppe Sorbino" and that, in one way or another, have contributed to my scientific work giving me friendship and moral support.
A big thanks goes to my parents and my family who have supported and encouraged me during these years of study keeping me always harmonious.
I would like to thank Tommaso, the special person with whom I shared joys, concerns and satisfactions...Thanks for always being there for me! The work carried out in this PhD Thesis was partially founded by POR CAMPANIA Rete di Eccellenza FSE. Progetto“Tecnologie e monitoraggio ambientale per la sostenibilità delle Aree Vaste” (TEMASAV), cod Ufficio
ABOUT THE AUTHOR
Giovanna De Chiara si laurea nel Settembre 2010 in Ingegneria per
l'Ambiente ed il Territorio - Difesa del Suolo - presso l'Università degli Studi di Salerno con votazione 110/110 e lode. Nel Febbraio 2011 supera l'esame di ammissione al Dottorato di Ricerca in Ingegneria Civile per l'Ambiente ed il Territorio (XII ciclo Nuova Serie) presso l'Università degli Studi di Salerno. Durante il Corso di Dottorato si dedica a tematiche di ricerca inerenti la stima del rischio, per il singolo individuo e per la società, connesso all'accadimento di fenomeni franosi di flusso rapido. Allo scopo di approfondire tali tematiche segue numerosi seminari e corsi nell'ambito di Scuole di Alta Formazione, svolgendo parte dell'attività di studio e ricerca presso la facoltà di Geo-Information Science and Earth Observation dell’Università di Twente in Enschede, Olanda.
Giovanna De Chiara graduated in September 2010 in Environmental
Engineering at the University of Salerno with 110/110 cum laude. In February 2011 she passed the admission exam for the PhD course in Civil and Environmental Engineering (XII cycle- New Series) at the University of Salerno. During the PhD course she developed research topics on individual and societal risk estimation, related to the occurrence of fast moving flow-like landslides. To deepen these themes, she has taken several seminars and courses within PhD International Schools, undertaking part of her study and research activities at the Faculty of Geo-Information Science and Earth Observation of the University of Twente in Enschede, Netherlands.
In recent years, due to a significant increase of human pressure and the consequent aggressive and indiscriminate use of land, landslides have became a major problem with regard to the safety of the population and damage to residential areas, infrastructures, service networks and to the environmental heritage. Specifically, the most serious consequences in terms of loss of life and damage to the economic goods are, generally, associated with flow-type slope movements, widespread all over the World and involving different geological contexts. The catastrophic characters of these phenomena are essentially related to the little or no warning signs, long travel distances and high velocities during the propagation stage. The relevance of societal consequences require the setting up of proper protection strategies aimed at avoiding or mitigating their effects. To this aim, the landslide risk analysis surely represents a fundamental issue as it provide, for a given area, the estimation of the level of risk to which the people or properties are exposed. It can be based on different conceptual assumptions, techniques and tools and it can be used at different scales of analysis in relation to the available data-set and to the purposes to be achieved.
The studies and research carried out in the present Thesis are focused on the use of the quantitative risk analysis (QRA) to life loss posed by flow-like phenomena in a complex geological context, in which the slopes are covered by pyroclastic soils. The main goal of this research is to apply, improve and optimise the use of the QRA as a formal and structured tool for scientists and engineers involved in the management of the risk in order to provide an helpful decisional support for the proper identification and design of the most appropriate structural mitigation measures.
Particularly, Chapter 2 provides an overview of the main features of flow-like phenomena, on the basis of the scientific classifications. Within the wider category of this phenomena, particular attention is given on two types: debris flows and hyperconcentrated flows.
The Chapter 3 focuses on the methodological approach, shared by the international scientific Community, of landslide risk management and summarises the current risk analysis state of practice.
Chapter 4 concerns with the different approaches, methods, levels, types and purposes of landslide risk zoning. In particular, it describes the current zoning in Italy, stressing on its potentialities and limits.
In the chapter 5 the main results of an historical analysis of past flow-like events occurring in the Campania Region, aimed at the quantification of societal landslide risk, are discussed. In particular, studies are mainly directed to the recognition of the frequency occurrence of different types of flow-like events, namely debris flows and hyperconcentrated flows, belonging to the wide category of flow-like phenomena. The achieved results lead to important implications in terms of classification of the areas at very high risk that urgently need the implementation of non-structural risk mitigation measures.
Chapter 6 focuses on the selected Monte Albino hillslope test site, located in the Municipality of Nocera Inferiore (Campania region) on which the Quantitative Risk Analysis (QRA) procedures will be tested. In particular, the performed investigation activities (historical analyses, field surveys and in-situ tests) and the main results achieved during this fundamental stage of the work are discussed.
Chapter 7 is aimed at understanding, at detailed scale, of the geomorphological factors and geomorphological processes contributing to the definition of the actual litho-structural and morphologic settings of the test site. The derived information are of relevant importance for the identification of the "hillslopes" proneness to slope instabilities, including the associated triggering mechanism.
Chapter 8 discusses the results of a thorough susceptibility and hazard analysis of the hyperconcentrated flow triggering with reference to Monte Albino hillslope, for which an accurate catalogue of historical data, as well as geological and geomorphological features, litho-stratigraphic information and geotechnical characteristics of the soils are available. These studies are based on the use of detailed numerical analysis, through physically based engineering models, for the simulation and modelling of the triggering and propagation stage of hyperconcentrated flows. The achieved results represent the cognitive basis to perform quantitative risk analyses at detailed scale.
hyperconcentrated flows. The estimated risk for life loss is calculated at both the individual level (risk to the average and most exposed person) and societal level. The obtained results are represented in risk maps and used to rank the portions of the urbanised territory at hyperconcentrated flow risk, in order to clearly identify the areas needing structural mitigation measures.
Finally, the chapter 10 presents the discussion of the achieved results of quantitative estimate of risk posed by hyperconcentrated flow both at regional and site-specific scale, highlighting the extraordinary perspective and repercussion in the technical and political fields.
Landslides are an extremely widespread natural event resulting in one of the main causes of risk for social and economic structure. On a World scale, among natural disasters that have caused human life losses, landslide phenomena are set in the seventh place after windstorms, floods, droughts, earthquakes, volcanoes and extreme temperature (EM-dat, 2007). Moreover, it is important to observe that landslides interact with many other natural phenomena (such as earthquakes, storms, floods) so that they are considered the second most significant natural hazard among those identified by the United Nation Development Programme (UNEP, 1997).
The spatial distribution of landslides and their consequences are different in each Country, as testified by the global statistics on major events that have occurred during the past century. According to OFDA/CRED database (Table 2.1) Asia was impacted by 286 landslides events - the most of any region of the World - but America has suffered the most deaths while Europe registered an average economic loss of about $ 67 million per landslide.
The increasing number of disasters (Figure 2.1), accentuated during the last two decades, and the consequent growth of damage can be mostly attributed to the new reality of more extreme weather conditions combined with overexploitation of natural resources and deforestation, increased urbanisation and uncontrolled use of land (Nadim et al., 2006). Among all the types of landslides, flow-type movements surely represent a global issue that in many cases affect large areas at the same time, with catastrophic consequences on the exposed elements. Significant examples, in this sense, are provided by the phenomena systematically occurring in Southern Italy (1954,1998), in many States of the western USA (1997), in Japan (1998), in Venezuela (1999), in China (1999), El Salvador (2001), and in New Zealand (2002, 2004).
In the following, an overview of the main features of flow-type phenomena is provided, with particular attention to two types of phenomena involving granular soil: debris flows and hyperconcentrated flows.
Table 2.1 Global landslides statistics between 1900-2011 (source EM-DAT www.emdat.be). Region of the World Event N° of
Events Killed Affected Total
Damage (000 US$)
Africa Landslide Average 31 1,197 58,124 0
per event 38.6 1,875 0
Americas Landslide Average 157 19,373 5,509,275 2,521,727
per event 123.4 35,091 16,062
Asia
Landslide 286 19,136 8,010,607 2,766,916
Average
per event 66.9 28,009 9,675
Europe Landslide Average 35 15,342 25379 2,334,000
per event 438.3 725 66,686
Oceania Landslide Average 18 546 20,315 2,466
per event 30.3 1,129 137
Figure 2.1 Number of natural disasters between 1900 - 2011 (source EM-DAT www.emdat.be).
2.1 C
LASSIFICATION AND GENERAL FEATURESFlow-like phenomena are characterised by very complex features and various attempts have been proposed in scientific literature to establish a unique and systematic classification (Hungr et al., 2001; Hutchinson 2003). Moreover, also the terminology commonly used is quite confusing and not exhaustive to describe the high variability of the physical and mechanical behaviour.
The flow type phenomena are composed of mixtures of air, steam, water and solid fractions of different nature: such as fracturated rocks, sands, silts including loess and volcanic ashes, sensitive and stiff fissured clays and organic soils (Hungr et al., 2001).
In order to frame the fundamental characteristics of flow-like movements, in the following the main scientific classifications are described.
The Varnes (1978) classification is certainly the widely used and it is also the starting point of the other classifications proposed in the scientific literature. The Author classifies landslides on the basis of two fundamental characteristics through which to assign the appropriate name of the recognised phenomenon: the typology of movement and the type of involved material before the initiation of the movement (Table 2.2). With reference to the type of involved material the Author distinguishes between: rock (a hard or firm mass that was intact and in its natural place before the initiation of movement) and soil (aggregate of solid particles that either was transported or was formed by the weathering of rock in situ). Soil is divided into earth and debris: earth describes material in which 80% or more of the particles are smaller than 2 mm; debris contains a significant proportion of coarse material that is from 20% to 80 % of the particles are larger than 2 mm and the remainder are less than 2 mm. Movements are divided into five types: falls, topples, slides, spread and flows. The Author defines the flow as a spatially continuous movement in which surfaces of shear are short-lived and usually not preserved. The instability does not occur as a movement on one or more sliding surfaces, but rather, the involved material, not being able to resist the tangential stress variation produced by distortional deformations, flows as a viscous fluid.
Table 2.2 Abbreviated classification of Slope Movements (Cruden, 1978). TYPE OF MOVEMENT TYPE OF MATERIAL BEDROCK ENGINEERING SOILS Predominantly
coarse Predominantly fine
FALLS Rock fall Debris fall Earth fall
TOPPLES Rock topple Debris topple Earth topple
SLIDES ROTATIONAL Rock slide Debris slide Earth slide
TRASLATIONAL
LATERAL SPREAD Rock spread Debris spread Earth spread
FLOWS Rock flow Debris flow Earth flow
(deep creep) (soil creep)
COMPLEX Combination of two or more principal types of mevement
This classification is then revised and completed by Cruden and Varnes (1996) through the addition of the third component: the velocity reached by the landslide body in the paroxysmal stage of the motion (Table 2.3).
A first classification of these phenomena based on the morphology, mechanism, material and rate of movement is performed by Hutchinson (1988). Within the framework of flow-like phenomena the Author distinguishes five types of movement (Figure 2.2), in which the shear failure and flow processes are contemporarily present although in different measure from each case:
• Mudslides (non-periglacial); • Periglacial mudslides; • Flow slides;
• Debris flows; • Sturzstroms.
In Mudslides phenomena the shear failure process prevails over flow process; in flow slides and debris flow phenomena the two processes coexist while in sturzstroms the flow processes exclusively occur.
It should be noted that the Author distinguishes, within the large spectrum of the flow-like phenomena, the mass transport phenomena and mass movement phenomena.
This distinction is based on water content value and unit weight of the mixture (Figure 2.3). In particular, debris flows are characterised by sediment concentration by weight of more than 80% and unit weight higher than 2 t/m3. Smaller values are characteristic of the mass
transport phenomena such as hyperconcentrated flows and streamflow.
Figure 2.3 Continuous spectrum of sediment concentration. (Hutchinson, 1988). The classification of flow-like phenomena from a rheologic, geomorphic and sedimentlogic point of view, must be attributed to Costa (1988). In
particular, the Author compares three different types of flows (Table
2.4):
• Water Flood
• Hyperconcentrated Flows • Debris Flows
Coussot and Meunier (1996) propose a revision of the flow-like phenomena classification on the basis of their physical characteristics and mechanical behaviour (Figure 2.4). Within debris flows the relative velocity of water and solid is small so it can be considered as a (one-phase) viscous fluid; in water flood or hyperconcentrated flows the mean velocity of the coarsest solid particles, which are on the bed (bed-load), significantly differ from that of the water-solid suspension which flows around it, so they are constituted by a two-phase flow.
Table 2.4 General Rheologic Classification of Water and Sediment Flows in Channels (Costa, 1988).
Flow concentration Sediment Density Bulk [g/cm3] Shear Strength [dyne/cm2] Fluid Type Water flood 0.4 –20 % by vol. 1– 40 % by wt. 1.01 –1.33 0 - 100 Newtonian
Hyperconcentrated flow
40 – 70 % by wt.
20 – 47 % by vol. 1.33 – 1.80 100 - 400 Newtonian Non-(?)
Debris flow 70 – 90 % by wt. 47 – 77 % by vol. 1.80 – 2.30 >400 Viscoplastic (?)
Figure 2.4 Classification of flow-like phenomena as a function of solid fraction and material type (Coussot and Meunier, 1996).
In order to simplify the characterisation and the definition of different flow-like phenomena additional classifications have been proposed In this regard, Hutchinson (2003), starting from its previous geomorphological classification, identifies four types of flow-type landslides grouped into two different categories depending on the involved material: flow-type landslides in granular materials (debris flows, flow slide and rock avalanche) and flow-type landslides in cohesive material (mudslides). Hungr et al. (2001 and 2012) propose a very detailed and comprehensive classification based on four basic elements: material, water content, special conditions and velocity (Table 2.5).
All the classifications provide a useful conceptual framework mainly with reference to propagation stages, taking into account morphology, type of movement, state of activity, velocity (Hungr et al., 2001). In the following, according to the analysed classifications (Varnes 1978; Hutchinson, 1988; Costa, 1988; Coussot & Meunier, 1996; Cruden & Varnes, 1996; Hungr et al., 2001; Hutchinson, 2003; Hungr et al., 2012), the main feature of flow-like phenomena will be illustrated.
Flow-type phenomena are caused by several factors such as: rainfall, earthquakes, weathering, human activities or a combination of them. Among these factors, rainfall is surely the most common.
In order to describe the main phenomenological features of flow-type slope movements, the characterisation of all the different zones and stages involved in the phenomena is needed. From the geomorphological point of view, Hungr et al. (2001) recognise three main zones: the source area (which refers to a triggering zone of the landslide), the transport zone (it may or not coincide with a pre-existing valley incision along which the material in place can be eroded, further increasing the volume of the flowing mass) and the depositional area. In such areas the triggering, the propagation and the deposition stages of the phenomenon are respectively associated.
Triggering is assumed to be the process leading a soil mass as a result of irreversible deformation. It depends on many factors – not always independent of each other – that are substantially attributable to two processes: i) erosion and undermining of debris-mass; ii) break slope with subsequent transformation of the unstable mass in flow.
Propagation stage refers to the rapid movement of unstable masses from the source area downslope to the depositional area wherein, due to slope angle decrease and pore-water pressure dissipation, the mass comes to rest (Major et al., 1997). During the propagation stage, additional soil masses lying along the path of the flowing mass may be entrained by erosive processes and incorporated in the original triggered mass (Iverson, 2005).
The phenomenological and kinematic characteristics are clearly related to the failure and post-failure mechanisms (Leroueil et al., 1996) affected by several factors such as morphology, boundary condition, characteristics of the involved material, initial state of stress, etc. After the triggering stage, the flow-type phenomena propagate with characteristics similar to those of a viscous fluid reaching, in the paroxysmal phase, very high values of velocity (up to tens m/sec); furthermore, the flowing mass is able to attain long travel distances (up to tens of kilometres) by adapting to the morphology of the area (following natural and/or human tracks or spreading laterally over flat slopes).
2.2 D
EBRIS FLOWSDebris flows are very rapid to extremely rapid surging flows of saturated non-plastic debris (plasticity index < 5% in sand and finer fractions) in a steep channel with a strong entrainment of material and water from the flow path. It is distinct from other types of landslides since it occurs periodically on established paths, usually gullies and first or second order drainage channels. (Hungr et al., 2012).
Debris flow events usually occur during a period of heavy rainfall or melting snow, with peak discharge up to 40 times greater than those of extreme floods (Hungr et al., 2001). The high discharge is responsible for greater flow depth, higher velocity, higher impact loads and the ability to move large boulders. The measured velocities range between 3 and 12 m/sec and, exceptionally, velocities of about 30 m/sec and even more
have been measured (Hutchinson, 1988) with travel distances up to several kilometres. The thickness of the material in motion ranges from few meters to a maximum of twenty meters.
The materials involved in debris flows can be defined as loose unsorted materials ranging from clay to boulders of several meters in diameter, produced by mass wasting processes (colluvium), weathering (residual soils), glacier transport, or unsorted anthropogenic waste (Hungr et al., 2001). They may also contain a significant portion of organic material such as trees and timber (Swanston, 1974).
The flow may be initiated by a slide, debris avalanche or rock fall from a steep bank, or by spontaneous instability of the steep stream bed, carrying heavy water flow. Once soil material begins to move in a steep channel, the flowing masses start to incorporate the material lying along the slope (Sassa, 1985), hence greatly increasing of the solid fraction concentration that approximately reaches 80% by volume. It is important to note that the bulk of the material involved in a debris flow event usually originates from entrainment along the path, while the triggering volume is insignificant.
During the propagation stage, solid particles and water move at the same velocity as a single visco-plastic body (one-phase flow) in a laminar flow, undergoing large homogeneous deformations without significant changes to its mechanical properties (Coussot and Meunier, 1996).
Among the many rheological models proposed in scientific literature, field observation (Johnson, 1970; Coussot, 1992; Whipple and Dunne, 1992) and rheometric studies (O’Brien and Julien,1988; Phillips and Davies,1991; Major and Pierson, 1992; Wang et al.,1994; Coussot and Piau, 1995; Martino, 2003; Martino and Papa, 2008), lead the conclusion that in debris flows the resistance to flow (or deformation) results from shear strength originating from cohesion, internal friction and viscosity (Costa, 1988). Therefore, the debris flows exhibit a behaviour well described by a visco-plastic rheological models such as the Bingham model (Bingham and Green, 1919) or the Herschel-Bulkley model (Herschel and Bulkley, 1926).
Since debris flow materials have a high density and they are very viscous, strongly sheared and mixed during the flow, the sedimentary structures – including stratification – in debris flows deposits are not existent; however, along the longitudinal profile they show an inverse sorting that
of the depositional fan, coarser debris are expelled to the sides forming ridges or levees while the front may be by-passed by the finer liquefied debris travelling behind it and coming to rest (Hungr et al., 2001; Takahashi, 1991).
2.3 H
YPERCONCENTRATED FLOWSHyperconcentrated flows are mass transport phenomena characterised by very rapid flow of water, heavily charged with debris, in a steep channel (Hung et al., 2012). Hyperconcentrated flows are also called non cohesive mudflows (Kurdin, 1973), turbulent mudflows (Gagoshidze, 1969), intermediate flows (Bull, 1964), type III and IV sediment flows (Lawson, 1982), mud floods (Committee on Methodologies for Predicting Mudflow Areas, 1982) and debris floods (Hungr et al., 2001). They occur as a result of erosion phenomenon performed by the volumes of water in motion or when debris flows lose coarse sediment through dilution and selective deposition.
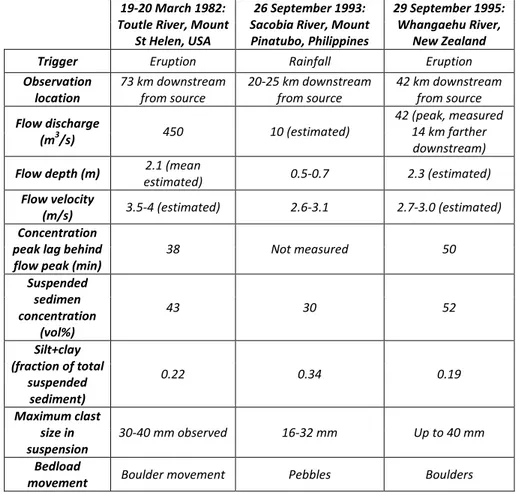
Documented triggering mechanisms include: hillslope and channel erosion during intense rainstorms (Beverage and Culbertson, 1964; Major et al., 1996; Pierson et al., 1996), lake-breakout floods (Rodolfo et al., 1991; O' Connor et al., 2002), glacier-outburst floods (Maizels, 1989), dilution and/or selective deposition at the heads and tail of debris flows (Pierson, 1986; Pierson and Scott, 1985; Cronin et al., 2000), and inputs of large sediment volumes to water floods by landslides (Kostaschuk et al., 2003). Therefore, they commonly occur in semiarid and arid regions, particularly where the basins are steep, hillslopes are eroded, channel banks are fragile, and channel beds are unreinforced and erodible (Gerson, 1977; Laronne et al., 1994). It is important to note that hyperconcentrated flows are common in pyroclastic soils recently impacted by explosive eruption. In this geological context, in fact, the well documented hyperconcentrated flow events (Table 2.6) have been observed (Pierson, 2005), consisting in a rapid releases of water able to erode and to incorporate exceptionally large volumes of cohesionless deposits on hillslope and in channels. The transported material can result from: i) erosion along the riverbed, ii) erosion along the lateral banks of
the riverbed , iii) instability phenomena along the river banks that are
According to Costa (1988), hyperconcentrated flows are characterised by a solid concentration by volume ranging from 20% to about 47%; the sediment may be transported in the form of massive surges, leaving sheets of poorly sorted debris ranging from sand to cobbles or small boulders.
Table 2.6 Observed or measured characteristics of hyperconcentrated flows to approximate times of peak sediment (Pierson, 2005)
19-20 March 1982: Toutle River, Mount
St Helen, USA
26 September 1993: Sacobia River, Mount Pinatubo, Philippines
29 September 1995: Whangaehu River,
New Zealand
Trigger Eruption Rainfall Eruption
Observation location
73 km downstream
from source 20-25 km downstream from source 42 km downstream from source
Flow discharge
(m3/s) 450 10 (estimated)
42 (peak, measured 14 km farther downstream)
Flow depth (m) estimated) 2.1 (mean 0.5-0.7 2.3 (estimated)
Flow velocity
(m/s) 3.5-4 (estimated) 2.6-3.1 2.7-3.0 (estimated)
Concentration peak lag behind
flow peak (min) 38 Not measured 50
Suspended sedimen concentration (vol%) 43 30 52 Silt+clay (fraction of total suspended sediment) 0.22 0.34 0.19 Maximum clast size in suspension 30-40 mm observed 16-32 mm Up to 40 mm Bedload
movement Boulder movement Pebbles Boulders
They are often generated by rainfall events of high intensity and short duration that determine the development of sudden river flooding, with peak discharge comparable to that of a water flood. In particular, the phenomenon is mostly concentrated in the autumn months, during which there are the highest soil suction values that lead to the occurrence
of erosion phenomena or localised small-size slope instabilities, typically turning into hyperconcentrated flows (Cascini et al., 2013 a).
The hyperconcentrated flows may be generalised as a turbulent, solid– liquid two-phase flow, gravity-driven flows of water and sediment in which the mean velocity of the coarsest solid particles, which are pushed and rolled on the bed (bed-load), significantly differ from that of the water-solid suspension which flows around it (Coussot and Meunier, 1996).
Rheological and fluid characteristics are greatly controlled by the amount of fine-grained material (silt and clay) in the transported mass: flows with low concentration of sediment, high percentages of fine material and low strain rates follow a Newtonian behaviour (Costa, 1988); with the increasing of the sediment concentrations the flow mechanism begins to change: viscosity, shear strength and particle collisions increase so flows exhibit a behaviour well described by a viscous-plastic rheological models such as the Bingham model (Bingham and Green, 1919), the Herschel-Bulkley model (Herschel and Bulkley, 1926) or collisional-viscous-plastic rheological model like the quadratic shear stress model (O' Brien and Julien, 1985).
Hyperconcentrated flow deposits are massive to crudely stratified; the sorting is intermediate between that of debris flow and most water flood deposits. In particular, they have a coarse, sandy texture with distinctly less fines than debris flow deposits and are more poorly sorted than water flood deposits of similar medium size (Costa, 1988).
It is important to note that, unlike a debris flows, hyperconcentrated flows usually do not develop high impact forces and, consequently, they are responsible for economic damage to structures and properties (resulting from flooding and burying of the objects impacted by the flow) but the risk for life loss is limited. However, this depends on the size of the drainage where they are originated. While debris flows are limited to steep drainages of less a few square kilometres, hyperconcentrated flows can occur in much larger river catchments, with greater hydrologic flood discharges which are magnified by heavy sediment loads. An important example is given by the catastrophic flood and landslide disaster of the Serrana Region of Brazil, in January 2010 (Hungr et al., 2012).
potential damage (Svendsen et al., 2003). It might happen, in fact, that the flow of water and sediment possess a high energy able to incorporate, within the moving mass, high solid fractions and very large boulders, in this case the event turns into a debris flow (this is the case of the event that affected the city of Salerno, Italy in October 1954). On the other hand, a debris flow surge can dilutes itself to a hyperconcentrated flow by entraining water from the channel and discarding the coarsest sediments to the side of the channel (Pierson, 2005).
Figure 2.5 Processes causing dilution of mass and hyperconcentrated flows (Svendsen et al., 2003).
The increasing trend in spatial and temporal occurrence of landslides and the awareness of the caused catastrophic consequences, in terms of victims and social-economic impacts, have greatly contributed to the development of issues related to the landslide risk and, in particular, those pertaining to the risk analysis and zoning as well as its mitigation. Several Authors have proposed definitions, not always fully shared, of the terms that concur to the generation of risk (Varnes, 1984; Einstein, 1988; Fell, 1994; Leroi, 1997; Fell e Hartford, 1997; Ho et al., 2000; Cascini, 2005 b; Fell et al., 2005; Fell et al., 2008). In this Thesis the definitions provided by The International Society of Soil Machanics and Geotechnical Engineering (ISSMGE) Technical Commitee on Risk Assessment and Management (TC32, 2004) are considered (http://www.engmath.dal.ca/tc32/publications.html), namely:
• Risk (R): A measure of the probability and severity of an adverse effect to health, property or the environment. Risk is often estimated by the product of probability of a phenomenon of a given magnitude times the consequences.
• Hazard (H): A condition with the potential for causing an undesirable consequence. The description of landslide hazard should include the location, volume (or area), classification and velocity of the potential landslides and any resultant detached material, and the probability of their occurrence within a given period of time.
• Vulnerability (V): The degree of loss to a given element or set of elements within the area affected by the landslide. It is expressed on a scale of 0 (no loss) to 1 (total loss). For property, the loss will be the value of the damage relative to the value of the property; for persons, it will be the probability that a particular life (the element at risk) will be lost, given the person(s) is (are) affected by the landslide.
• Element at Risk (E): Population, buildings and engineering works, infrastructure, environmental features and economic activities in the area affected by a hazard.
The prediction of the currently or potentially level of risk, in a specific area affected by a given landslide phenomenon, requires the combination of information derived from the knowledge of the landslide hazard and from the analysis of the expected consequences posed by its occurrence. In the most general form, the risk estimation can be expressed through the widely accepted formula of Varnes (1984):
𝑹 = 𝑯 ∙ 𝑬 ∙ 𝑽 (3.1) Hazard analysis involves the characterisation of the landslide process and the corresponding frequency (i.e. annual probability) of occurrence. Consequence analysis, generally represented as the product of E times V, is the outcome of hazard and it includes the identification and the quantification of the elements at risk (property, persons) as well as the evaluation of their temporal and spatial probability and vulnerability. Risk analysis represent the first step of the whole risk management process as it allows the estimation of landslide risk on the basis of the risk theory concepts applied to natural systems and it plays a leading role in the general landslide risk management by supporting decisions of owners, regulators and governments about protection options to be set. In the following, after a description of the theoretical background of landslide risk management, the different stage characterising the risk analysis phase are analysed. Special attention is given to the description of different methods for the hazard and consequence analyses, highlighting their potentialities and limits.
3.1 G
ENERAL FRAMEWORK OF THE RISK MANAGEMENT PROCESSUnderstanding, forecasting and controlling the risks posed by landslide phenomena are recognised to be a priority in achieving an acceptable quality of life. Due to the importance of the topic, there has been a growing interest in the technical and scientific Community towards the adoption of a rigorous approach aimed at prevention, mitigation and control of landslide risk (Fell et al., 2005) in effectively and efficiently way. To this aim, Fell et al. (2005) suggested a logical framework for landslide risk management, received within the guide line of JTC-1 (Joint Technical Committee on Landslides and Engineered Slopes) (Fell et al., 2008), that includes three phases (Figure 3.1):
• Risk Analysis • Risk Assessment • Risk Management
In this framework, the risk analysis represents the basic level of risk management process. Risk analysis is essentially aimed at the estimation Risk assessment takes the output from risk analysis and it assess the estimated risk against reference values – established on the basis of political judgements or acceptance criteria – in order to decide if the level of risk is low enough to be accepted or tolerated from the community. Finally, risk management takes the output from risk assessment and considers the use, where the risk level cannot be tolerated, of appropriate mitigation options. Mitigation options are the treatments and priorities that are set in order to reduce risk within the context of social and economic needs and realities. Such measures can be essentially grouped in two categories: active and passive. The active measures are generally devoted to the implementation of engineering works designed to directly control the phenomena, while the passive measures refer to strategies such as avoidance, tolerance and warning/monitoring of landslide hazards.
Obviously, as can be understood, the whole process of the risk management involves a large number of stakeholders including owners, inhabitants, appointed authorities of the territory government, geotechnical engineers, geologists as well as risk analysts.
Figure 3.1 Framework for landslide risk management (Fell et. al, 2008).
As reported in Landslide risk management concepts and guidelines of Australian Geomechanics Society (AGS) (2000), this process can be achieved by providing the proper answers to the following main questions:
• What might happen? • How likely is it?
• What damage or injury may result? • How important is it?
Risk analysis, certainly, plays a leading role in the general risk management framework by providing support to the planning of active mitigation measures, to the effective design of passive strategies and, above all, to the development of land utilisation regulations aimed at minimise the loss of life and to reduce the damage costs.
3.2 R
ISK ANALYSISLandslide risk analysis is based on the general concepts of the risk theory that has been extensively used for practical problems associated with industrial, human, environmental and natural systems. According to this theory, the risk is defined by the intersection of two main components: hazard and consequence (Varnes, 1984). The risk analysis can be carried out at different scales (from small to detailed scale) depending on the scope of the work, the extension of the study area, the amount and quality of available information as well as the financial and/or time constraints (Bell and Glade, 2004; Fell et al., 2008).
This section introduces a brief overview of each step of the risk analysis process consisting in: scope definition, hazard analysis and consequence analysis.
3.2.1 Scope definition
The importance of defining a scope of the risk analysis ensures that the relevant issues are being addressed, the needs of professionals implicated in the complex process of risk management are being satisfied, and it avoids misunderstandings between parties (Fell et al. 2005). Scope definition allows to define the geographical limits of the study area and level of detail, elements at risk of concern, the methodology best suited for the risk analysis, the required resources, the units in which to measure the outcome of analysis, and what will the analysis (and in turn, the assessment) be used for (Fell et al., 2005; Crozier and Glade, 2005). It should be also defined the nature of the end product of the risk analysis - report, maps, and how these will be communicated to the interested parties.
Obviously, all these factors that characterise the purpose of the risk analysis and assessment are dictated by technical, social, economic and political interests.
3.2.2 Hazard analysis
Hazard is the most complex factor to be determined for the estimation of the landslide risk. In particular, hazard analysis contemplates the identification and the characterisation of the potential landslides together with evaluation of their corresponding frequency of occurrence (Fell et al., 2005).
The identification phase involves the definition of landslide processes that may occur in the study area. This phase can be supported by the landslide susceptibility analysis that takes into account geomorphologic, geological, hydro-geological features of the study area as well as the analysis and the identification of past landslide phenomena (through the interpretation of aerial photographs and evaluation of historical information). In particular, according to JTC-1 (Fell et al., 2008) the landslide susceptibility analysis by using the landslide inventory map, which includes the description of past landslides, allows the classification and the identification of spatial distribution of existing and potential landslides in the study area, their state of activity, their triggering mechanism and their travel distance.
In order to define the hazard scenario, once the landslide phenomenon is identified, it is necessary to characterise its corresponding frequency of occurrence. Hazard analysis, unlike susceptibility analysis, requires the estimation of the spatial-temporal and magnitude probabilities of potential landslides (Guzzetti et al., 1999; Glade and Crozier, 2005; Fell et al., 2008; Van Asch et al., 2007; Corominas and Moya, 2008; van Westen et al., 2008).
In scientific literature there are several applications of assessment of the future occurrence of landsliding (Mostyn and Fell, 1997; Baynes and Lee, 1998; Aleotti and Chowdhury, 1999; Picarelli et al., 2005; van Westen et al., 2006; Corominas and Moya, 2008), which can be synthetically grouped into heuristic, statistical and deterministic methods.
The choice of the most suitable approach, obviously, depends on: the scale of work, the availability of the data and the aim of the landslide risk analysis (see Section 4.1).