Research Article
Generation and Characterization of a Transgenic Mouse
Carrying a Functional Human
𝛽-Globin Gene with the IVSI-6
Thalassemia Mutation
Giulia Breveglieri,
1,2Irene Mancini,
1Nicoletta Bianchi,
1Ilaria Lampronti,
1Francesca Salvatori,
1,2Enrica Fabbri,
1Cristina Zuccato,
1Lucia C. Cosenza,
1,2Giulia Montagner,
1Monica Borgatti,
1Fiorella Altruda,
3Sharmila Fagoonee,
3Gianni Carandina,
4Michele Rubini,
5Vincenzo Aiello,
5Laura Breda,
6Stefano Rivella,
6Roberto Gambari,
1,2and Alessia Finotti
1,21Department of Life Sciences and Biotechnology, Biochemistry and Molecular Biology Section, Ferrara University, 44121 Ferrara, Italy 2Laboratory for the Development of Pharmacological and Pharmacogenomic Therapy of Thalassemia, Biotechnology Center,
Ferrara University, 44121 Ferrara, Italy
3Department of Molecular Biotechnology and Health Sciences, Molecular Biotechnology Center, Turin University, 10126 Turin, Italy 4Laboratory for Chemical and Clinical Analysis and Microbiology, University Hospital, Cona, 44124 Ferrara, Italy
5Department of Biomedical and Specialty Surgical Sciences, Medical Genetic Unit, Ferrara University, 44121 Ferrara, Italy 6Division of Hematology-Oncology, Department of Pediatrics, Weill Cornell Medical College, New York, NY 10065, USA
Correspondence should be addressed to Roberto Gambari; [email protected] and Alessia Finotti; [email protected] Received 8 September 2014; Revised 3 December 2014; Accepted 3 December 2014
Academic Editor: Oreste Gualillo
Copyright © 2015 Giulia Breveglieri et al. This is an open access article distributed under the Creative Commons Attribution License, which permits unrestricted use, distribution, and reproduction in any medium, provided the original work is properly cited.
Mouse models that carry mutations causing thalassemia represent a suitable tool to test in vivo new mutation-specific therapeutic approaches. Transgenic mice carrying the𝛽-globin IVSI-6 mutation (the most frequent in Middle-Eastern regions and recurrent in Italy and Greece) are, at present, not available. We report the production and characterization of a transgenic mouse line (TG-𝛽-IVSI-6) carrying the IVSI-6 thalassemia point mutation within the human 𝛽-globin gene. In the TG-𝛽-IVSI-6 mouse (a) the transgenic integration region is located in mouse chromosome 7; (b) the expression of the transgene is tissue specific; (c) as expected, normally spliced human𝛽-globin mRNA is produced, giving rise to 𝛽-globin production and formation of a human-mouse tetrameric chimeric hemoglobinmu𝛼-globin
2/hu𝛽-globin2and, more importantly, (d) the aberrant𝛽-globin-IVSI-6 RNAs
are present in blood cells. The TG-𝛽-IVSI-6 mouse reproduces the molecular features of IVSI-6 𝛽-thalassemia and might be used as an in vivo model to characterize the effects of antisense oligodeoxynucleotides targeting the cryptic sites responsible for the generation of aberrantly spliced𝛽-globin RNA sequences, caused by the IVSI-6 mutation. These experiments are expected to be crucial for the development of a personalized therapy for𝛽-thalassemia.
This article is dedicated to the memory of Renzo Galanello and Antonio Cao.
1. Introduction
In𝛽-thalassemias, mutations of the 𝛽-globin gene or its
reg-ulatory regions cause absence (𝛽0) or reduced synthesis (𝛽+)
of 𝛽-globin chains [1–4], associated with a corresponding
excess of the complementary𝛼-globins. The outcome of this
unbalanced globin production is the destruction of erythroid precursors in bone marrow and at extramedullary sites (ineffective erythropoiesis) by apoptosis and short survival
of red blood cells (RBCs) in the peripheral blood [5–9].
Volume 2015, Article ID 687635, 20 pages http://dx.doi.org/10.1155/2015/687635
The disease is associated with morbidity and mortality due to severe chronic anemia or treatment-related complications.
More than 200 point mutations cause 𝛽-thalassemia
[10] and can affect transcription, splicing of the primary
transcript, translation, and stability of the𝛽-globin mRNA.
For instance, 𝛽039-thalassemia is caused by a stop codon
mutation that leads to premature termination of 𝛽-globin
chain synthesis [11,12]; the𝛽0IVSI-1 mutation suppresses the
correct maturation of the𝛽-globin RNA precursor [13], while
the𝛽+IVSI-110 allele coexpresses an abnormally spliced
𝛽-globin mRNA and a normal one [14].
Recently, the effort of several research groups has focused on the development of possible therapeutic interventions
designed for patients carrying specific𝛽-thalassemia
muta-tions (personalized therapy). For instance, Salvatori et al. reported the proof-of-principle that aminoglycosides are able to restore to some extent HbA production in erythroid cells
from homozygous 𝛽039-thalassemia patients [15]. Lonkar
et al. described a PNA-based approach method for targeted
correction of a thalassemia-associated 𝛽-globin mutation
[16]. In addition, other groups approached a therapy based
on the correction of aberrant pre-mRNA splicing [17,18].
Mouse models for the different mutations causing tha-lassemia are, therefore, very important to test in vivo the activity of new potential approaches that target specific
muta-tions [19]. The mouse𝛽-globin locus contains four functional
𝛽-globin genes: 𝛽h1 and 𝜀y
(transcribed only during the embryonic phase of development and silenced in
14-15-day-old embryos) and the b1 (𝛽major) and b2 (𝛽minor) genes that
are transcriptionally activated in utero around 11 days after
conception [20]. Unlike in humans,𝛾-like globin genes are
not present in mouse, and the embryonic to adult hemoglobin (Hb) switch occurs before birth (while in humans this switch occurs during the first 6 months after birth). Accordingly, mice homozygous for mutations that prevent expression
of the 𝛽-globin genes die perinatally, due to the lack of
expression of any Hb [19], although recently models
mimick-ing𝛽0-thalassemia have been generated. These animals are
viable at birth due to the prolonged expression of human fetal hemoglobin and then require chronic transfusions for
survival [20, 21]. However, the most utilized adult murine
models carry the complete deletion of one or both the mouse 𝛽-globin genes, showing phenotypic features similar to those
observed in𝛽-thalassemia intermedia patients [22,23]. These
animals do not carry any of the most common mutations
observed in𝛽-thalassemia in humans.
Therefore, murine models of𝛽-thalassemia, which carry
a mutated human 𝛽-globin gene in combination with the
presence of deletions of the mouse𝛽-like globin genes can
be an invaluable tool to test new therapeutic strategies. For instance, Vadolas et al. generated a humanized mouse model
carrying the common𝛽+IVSI-110 splicing mutation on a
bac-terial artificial chromosome including the human𝛽-globin
locus [24]. They examined heterozygous murine 𝛽-globin
knock-out mice carrying either the IVSI-110 or the normal
human𝛽-globin locus. A 90% decrease in human 𝛽-globin
chain synthesis in the IVSI-110 mouse model compared with
the mouse model carrying the normal human𝛽-globin locus
was observed. This notable difference is attributed to aberrant splicing. The humanized IVSI-110 mouse model accurately
mimics the splicing defect found in𝛽-thalassemia patients
with this mutation. This mouse model therefore offers a plat-form to test strategies for the restoration of normal splicing. Other examples of “humanized” transgenic mice proposed as
model systems for𝛽-thalassemia have been reported [25–27].
The generation of new transgenic mice carrying other
specific𝛽-thalassemia mutations might help the
characteriza-tion and development of drugs that selectively target specific mutations. The IVSI-6 mutation is the most frequent in the Middle-Eastern region and is also recurrent in Italy and
Greece [28–30]. This mutation leads to the activation of
three cryptic splicing sites, which generate three aberrantly spliced mRNAs. The production of a mouse that expresses such mutation could supply a model to test new compounds and therapies for this population of patients. Therefore, we developed a novel and the first transgenic line carrying the
human IVSI-6𝛽-globin gene.
2. Materials and Methods
2.1. Vector Design and Construction. For the production of
transgenic mice, we designed a lentiviral vector containing
the human 𝛽-globin gene under the control of its
physio-logical promoter and a portion of the human locus con-trol region (LCR), named pCCL.𝛽-globin.PGK.GFP.WPRE
(T9W) [31]. The vector T9W-IVSI-6 was generated by in
vitro mutagenesis, introducing the IVSI-6 𝛽-thalassemic
point mutation inside the human 𝛽-globin gene.
Mutage-nesis has been performed by using the QuickChange II Site-Directed Mutagenesis Kit (Stratagene, La Jolla, CA,
USA) [32]. A double stranded mutant oligonucleotide
(5-CCTGGGCAGGTTGGCATCAAGGTTACAAG-3) was
used in order to introduce the IVSI-6 mutation into the
𝛽-globin gene. The mutagenesis reaction has been performed in
a final volume of 25𝜇L, containing 25 ng of plasmid template,
1x Reaction Buffer (20 mM Tris-HCl pH 8.8, 2 mM MgSO4,
10 mM KCl, 10 mM (NH4)2SO4, 0.1 mg/mL BSA, 0.1% Triton
X-100), 0.5𝜇L of dNTP Mix, 62.5 ng of mutagenesis primers,
by using 1.25 U of PfuUltra HF DNA polymerase. The thermal reaction has been performed by using the GeneAmp PCR System 9600 (Perkin Elmer, Waltham, MA, USA): after a first
denaturation at 94∘C for 3 minutes, 22 cycles were performed,
consisting of denaturation at 95∘C for 30 seconds, annealing
at 55∘C for 1 minute and elongation at 68∘C for 8 minutes.
At the end of the mutagenesis reaction, the amplification product was digested with 5 U of the restriction endonuclease
DpnI, at 37∘C for 1 hour, so as to remove the parental not
mutated DNA. 5𝜇L of the digestion reaction was then used
to transform 120𝜇L of ultracompetent E. coli JM109 bacteria:
DNA and bacteria were incubated on ice for 4 hours and,
then, after a thermic shock at 42∘C for 45 seconds and
imme-diately on ice for 2 minutes, 1 mL of Luria Bertani Medium (LB Medium: 10 g/L bacto-tryptone, 5 g/L yeast extract, 10 g/L
NaCl) was added and an incubation at 37∘C for 1 hour under
slow agitation was performed; finally bacteria have been plated on Petri plates containing semisolid medium (LB
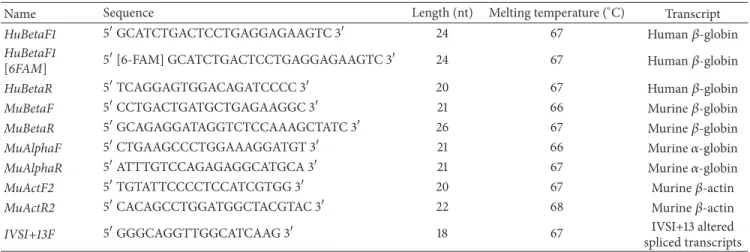
Table 1: PCR primers employed for identification and characterization of transgenic mice.
Name Sequence Length (nt) Melting temperature (∘C) Gene
MuActF 5TGACGGGGTCAACCACACTGTGCCCATCTA 3 30 81 Murine𝛽-actin
MuActR 5CTAGAAGCATTTGCGGTGGACGATGGAGGG 3 30 80 Murine𝛽-actin
TransF 5TGCATTCATTTGTTGTTGTTTTTCT 3 25 65 Transgene (LCR)
TransF [6FAM] 5[6-FAM] TGCATTCATTTGTTGTTGTTTTTCT 3 25 65 Transgene (LCR)
TransR 5TGACTAAAACTCCACCTCAAACGG 3 24 67 Transgene (LCR)
HuBetaF 5AGACCTCACCCTGTGGAGCC 3 20 68 Human𝛽-globin
HuBetaR 5TCAGGAGTGGACAGATCCCC 3 20 67 Human𝛽-globin
MuActF1 [6FAM] 5[6-FAM] TACTTTGGGAGTGGCAAGCC 3 20 66 Murine𝛽-actin
MuActR1 5TCTCCATGTCGTCCCAGTTG 3 20 66 Murine𝛽-actin
Table 2: Primers employed for RT-PCR analyses.
Name Sequence Length (nt) Melting temperature (∘C) Transcript
HuBetaF1 5GCATCTGACTCCTGAGGAGAAGTC 3 24 67 Human𝛽-globin
HuBetaF1
[6FAM] 5
[6-FAM] GCATCTGACTCCTGAGGAGAAGTC 3 24 67 Human𝛽-globin
HuBetaR 5TCAGGAGTGGACAGATCCCC 3 20 67 Human𝛽-globin
MuBetaF 5CCTGACTGATGCTGAGAAGGC 3 21 66 Murine𝛽-globin
MuBetaR 5GCAGAGGATAGGTCTCCAAAGCTATC 3 26 67 Murine𝛽-globin
MuAlphaF 5CTGAAGCCCTGGAAAGGATGT 3 21 66 Murine𝛼-globin
MuAlphaR 5ATTTGTCCAGAGAGGCATGCA 3 21 67 Murine𝛼-globin
MuActF2 5TGTATTCCCCTCCATCGTGG 3 20 67 Murine𝛽-actin
MuActR2 5CACAGCCTGGATGGCTACGTAC 3 22 68 Murine𝛽-actin
IVSI+13F 5GGGCAGGTTGGCATCAAG 3 18 67 IVSI+13 altered
spliced transcripts
Medium with 15 g/L bacto-agar) in the presence of 100𝜇g/mL
ampicillin and incubated at 37∘C for one night. The bacterial
clones obtained were screened for the incorporation of the recombinant plasmid construct, whose nucleotide sequence was finally confirmed by DNA sequencing.
2.2. Production of Transgenic Mice by Microinjection. The
6.1 Kb XcmI-ClaI fragment corresponding to the𝛽+IVSI-6
insert was purified with the QIAquick Gel Extraction Kit (QIAGEN, Hilden, Germany) according to manufacturer’s
instructions and sterile filtered with a 0.22𝜇m Costar
Spin-X column (Corning Incorporated, Corning, NY, USA). Five hundred DNA molecules/picoliter were microinjected in the pronucleus of fertilized eggs of 8-week-old FVB mice. The injected embryos were implanted into CBA/J X C57BL/6J pseudopregnant females and the offspring genotype was tested for the integration of the transgene as described below.
2.3. Transgenic Mice. Mouse strains were supplied by
Molec-ular Biotechnology Center of Turin University. Maintaining and experimental procedures were done at Ferrara University with the approval of Ethics Committee.
2.4. Purification of Murine Genomic DNA. Murine genomic
DNA was purified from mouse tails. Briefly, 1x DreamTaq
Buffer (containing KCl, (NH4)2SO4, 20 mM MgCl2)
(Fer-mentas, Burlington, ON, Canada) and 0.2 mg/mL proteinase
K were added to a 0.2–0.5 cm tail snip in a final volume of
50𝜇L, before incubating at 57∘C in a water bath for 16–20
hours. The samples were briefly vortexed and incubated at
95∘C for 10 minutes to inactivate proteinase K and, finally,
after centrifuging at maximum speed for 5 minutes, the supernatant containing genomic DNA was collected. Purified genomic DNA was checked by 0.8% agarose gel electrophore-sis and quantified by spectrophotometry.
2.5. Synthetic Oligonucleotides. The nucleotide sequences
of PCR primers were designed using the Primer Express Oligonucleotide Selection Software, version 1.0 (Applied Biosystems, Life Technologies, Carlsbad, CA, USA) and are
reported in Tables1and2. HPLC-grade oligonucleotides were
purchased from Sigma Genosys (Cambridge, UK).
2.6. Polymerase Chain Reaction (PCR). In each PCR reaction,
1𝜇L of murine genomic DNA was amplified by DreamTaq
DNA polymerase (Fermentas): PCR was performed in a final
volume of 100𝜇L, containing 1x DreamTaq Buffer (containing
KCl, (NH4)2SO4, 20 mM MgCl2), 33𝜇M dNTPs, 150 ng of
PCR primers, and 1.25 U of DreamTaq DNA polymerase.
PCR primer pairs used (Table 1) were as follows: MuActF
(forward) and MuActR (reverse), designed to amplify a 871 bp
sequence located on the murine𝛽-actin gene; TransF
(for-ward) and TransR (reverse), which amplify a 154 bp sequence on the transgene; HuBetaF (forward) and HuBetaR (reverse),
designed to amplify a 449 bp sequence on the human 𝛽-globin gene. The amplification cycles used were as follows:
denaturation, 30 sec, 95∘C; annealing, 20 sec, temperature
1-2∘C lower than primer melting temperatures; elongation,
72∘C for a length of time depending on the PCR product size.
2.7. Sequencing of PCR Products. HuBetaF-HuBetaR PCR
products, containing part of the human𝛽-globin gene, were
purified with MicroCLEAN (Microzone Limited, Haywards Heath, West Sussex, UK) and sequenced by using the ABI PRISM BigDye Terminator Cycle Sequencing Ready Reac-tion Kit, v1.0 (Applied Biosystems). Sequence reacReac-tions were
performed in a final volume of 20𝜇L, containing 40 ng of
PCR template, 3.2 pmoles of primer HuBetaR, 1x Sequencing
Buffer, and 8𝜇L of Terminator Ready Reaction Mix. 45
amplification cycles were performed, as follows:
denatura-tion, 96∘C, 10 seconds; annealing, 65∘C, 5 seconds;
elongati-on, 65∘C, 3 minutes. A denaturing 4% polyacrylamide gel
electrophoresis was then carried out in an automated ABI PRISM 377 DNA Sequencer (Applied Biosystems), and final sequence data were analyzed by Sequencing Analysis 3.3
(Applied Biosystems) and Chromas Lite 2.01 (Copyright©
2003–2008 Technelysium Pty Ltd.) softwares.
2.8. Quantification of Human𝛽-Globin Genes in Transgenic Mice by Real-Time PCR. Calibration curves were obtained
using 50, 100, and 150 ng of genomic DNA from a hemizygous
mouse and the 𝛽-actin gene as endogenous control. The
relative 𝛽-globin/actin gene ratio in investigated mice was
compared to the same ratio in the hemizygous control mouse. Quantitative real-time PCR assay was carried out using gene-specific double fluorescently labeled probes. The primers and
probes used for real-time PCR analysis of human𝛽-globin
gene (Assay ID Hs00758889 s1) and of mouse cytoplasmic 𝛽-actin (Assay ID Mm00607939 s1) were purchased from Applied Biosystems. The hemizygous or homozygous status of transgenic mice was determined by relative real-time PCR, taking a hemizygous DNA as a reference, by using the
comparative cycle threshold method [15,33,34].
2.9. Quantitative Multiplex PCR of Short Fluorescent Frag-ments (QMPSF). To determine transgene dosage comparing
and discriminating homozygous from hemizygous samples, dosage quotients (DQ) were obtained by QMPSF assays as
reported by Yau et al. [35] and Feriotto et al. [36]. A
2-fragment multiplex PCR assay was performed to amplify a 154 bp transgene sequence, using primers TransF[6FAM]
and TransR (Table 1) and a 201 bp fragment belonging to the
murine 𝛽-actin gene, used as a normalization control, by
using primers MuActF1[6FAM] and MuActR1 (Table 1). All
forward primers in the assay were 5-labeled with the
fluo-rescent phosphoramidite 6-FAM (Sigma Genosys).
Amplifications were performed in 25𝜇L volumes,
con-taining 125 ng genomic DNA, 0.01–0.02𝜇M forward primers
(unlabeled reverse primers were used as 1.4-fold excess respect to the corresponding forward primers; relative
ratios between transgene primers and𝛽-actin primers were
0.3 : 0.6), 66𝜇M dNTPs, and 0.7 U of DreamTaq DNA
poly-merase (Fermentas). After 6-minute initial denaturation at
96∘C, a “hot start” amplification was initiated by adding
DreamTaq DNA polymerase, followed by 19 cycles consisting
of a 15 seconds denaturation step at 95∘C, a 30 seconds
anneal-ing step at 64∘C, and a 15 seconds extension step at 72∘C, with
a final extension for 45 minutes at 72∘C. The PCR products
were analyzed by electrophoresis and the fluorescent signals were identified by using the ABI GeneScan Analysis Software, version 3.1 (Applied Biosystems) to produce electrophero-grams in which areas under the peaks represent the amount of PCR products. The molecular weight marker used was
the GeneScan 400HD [Rox] Dye Size Standard (Applied
Biosystems), designed for sizing DNA fragments in the 50– 400 nucleotides range. In order to determine transgene dosage and to compare and discriminate homozygous and hemizygous samples, dosage quotients (DQ) were obtained
as elsewhere described [35,36].
2.10. Hematological Analysis. Blood was collected from
16-week-old transgenic mice by retroorbital bleeding into tubes containing EDTA and analyzed by an automated Sysmex XE 2100 hematological analyzer (TOA Sysmex, Japan) at the Laboratory for Chemical and Clinical Analysis and Microbiology, University Hospital, Ferrara, Italy.
2.11. Fluorescence In Situ Hybridization (FISH) Analysis.
Fibroblast cell cultures were established in DMEM medium (Gibco, Life Technologies, Carlsbad, CA, USA) with non-essential aminoacids (Sigma-Aldrich, St. Louis, MO, USA), penicillin/streptomycin and 10% fetal calf serum, from tail samples from transgenic mice. The cells were grown for 10–14 days and then harvested following colcemid inhibition of cell division for 3–6 h. Chromosome preparations were obtained by using standard techniques. A probe was prepared from the intact T9W-IVSI-6 vector, directly labeled by nick translation with the DIG-Nick Translation Mix (Roche Applied Sci-ence, Penzberg, Upper Bavaria, Germany) according to the manufacturer’s protocol. The probe was hybridized and then detected with anti-digoxigenin-fluorescein Fab fragments (Roche Applied Science). The slides were mounted in Vec-tashield (Vector Laboratories, Burlingame, CA) containing
4,6-diamidino-2-phenylindole (DAPI) counterstain. FISH
signals were examined with Olympus Provis epifluorescence microscope and images were captured using Leica Microsys-tems CytoVision imaging equipment and software (Applied Imaging, Leica-Microsystems, Wetzlar, Germany). The chro-mosomal site of transgene integration was determined by karyotypic analysis of banded chromosomes obtained using the DAPI image.
2.12. RT-PCR. Total RNA was obtained from 250𝜇L of
wild-type, hemizygous, and homozygous mouse whole blood using the Mouse RiboPure Blood RNA Isolation Kit (Amb-ion/Applied Biosystems, Austin, TX, USA). cDNA was syn-thesized from 250 ng of total RNA using Superscript VILO cDNA Synthesis kit (Invitrogen, Carlsbad, CA, USA). PCR was performed using a GeneAmp PCR 9700 System (Perkin
Elmer, Waltham, MA, USA), 1/20 of reverse transcription reaction mixture (cDNA), 125 ng of human genomic DNA or
20 ng of pCCL.𝛽-globin.PGK.GFP.WPRE (T9W) [31] vector
DNA, 2 U of DyNAzyme DNA polymerase (Finnzymes, Oy,
Espoo, FI), and 33𝜇M deoxynucleoside triphosphates. The
HuBetaF1 forward and the HuBetaR reverse primers (Table 2)
were designed to amplify a 153 bp fragment of the human
𝛽-globin transcript or a 283 bp product of the corresponding human genomic DNA. The MuBetaF forward and MuBetaR
reverse primers (Table 2) were used to amplify a 147 bp
prod-uct of the mouse𝛽-globin transcript. The PCR conditions
were as follows: 35 cycles of amplification, which included a
20-second denaturation step at 95∘C, a 30-second annealing
step at 66∘C, and a 25-second elongation step at 72∘C.
2.13. Real-Time RT-PCR. For RNA extraction, transgenic
mouse tissues were homogenized using IKA T10 Basic Ultra-turrax (IKA Werke GmbH & Co. KG, Staufen, DE) directly
in TRIzol Reagent (Invitrogen) and 1𝜇g of the obtained total
RNA was treated with RQ1 DNAse (Promega, Madison, WI, USA) to remove genomic DNA contaminations. cDNAs were synthesized from 250 ng of total RNA using Superscript VILO cDNA Synthesis kit (Invitrogen). For quantitative real-time
PCR reaction, 0.8/20𝜇L of cDNA, 150 ng of each primer
(Table 2), and 1x iQ SYBR Green Supermix (Bio-Rad,
Her-cules, CA, USA) were used for each reaction. HuBetaF1 and
HuBetaR primers were designed to amplify a 153 bp sequence
present in transgenic human𝛽-globin transcripts,
MuBetaF-MuBetaR primers and MuAlphaF-MuAlphaR primers were
designed to amplify a 147 bp sequence present in mouse
𝛽-globin transcript and a 306 bp sequence present in mouse
𝛼-globin transcript, respectively, while MuActF2 and MuActR2 primers were designed to amplify a 331 bp sequence of
mouse𝛽-actin transcript (Table 2). Primer pairs and
ampli-fication conditions were validated by melting curve and electrophoretic analysis. Real-time PCR reactions were
per-formed for a total of 40 cycles (95∘C for 10 s, 66∘C for 30 s,
and 72∘C for 25 s) using an iCycler IQ5 (Bio-Rad). The relative
proportions of each template amplified were determined
by using the IQ5 software (Bio-Rad), employing the ΔΔCt
method [15,33,34] to compare gene expression data.
2.14. Cell Lines and Culture Conditions. Murine
erythroleu-kemia (MEL) cells [37] were grown in modified Dulbecco’s
minimal essential medium (D-MEM, Lonza Group, Basel, CH) supplemented with 10% fetal bovine serum (BioWest, Nuaill´e, France), penicillin (550 units/mL), and streptomycin
(75 units/mL) (Lonza Group) at 37∘C in 5% CO2humidified
atmosphere. Cell growth was monitored daily using a Burker chamber. Cell viability was measured by trypan blue staining
(Burr, BDH Chemicals, Poole, England) [38].
2.15. In Vitro Culture of Erythroid Progenitors from IVSI-6
𝛽-Thalassemia Patients. Blood samples from healthy donors and homozygous IVSI-6 patients were collected after receiv-ing informed consent. The two-phase liquid culture
proce-dure was employed as previously described [39,40].
Mono-nuclear cells were isolated from peripheral blood samples
of normal donors by Ficoll-Hypaque density gradient
cen-trifugation and seeded in𝛼-minimal essential medium
(𝛼-MEM, Sigma Genosys) supplemented with 10% FBS
(Cel-bio, Milano, Italy), 1𝜇g/mL cyclosporine A (Sandoz, Basel,
Switzerland), and 10% conditioned medium from the 5637 bladder carcinoma cell line. The cultures were incubated
at 37∘C, under an atmosphere of 5% CO2. After 7 days in
this phase I culture, the nonadherent cells were harvested, washed, and then cultured in phase II medium, composed
of𝛼-MEM (Sigma Genosys), 30% FBS (Celbio), 1%
deion-ized bovine serum albumin (BSA, Sigma Genosys), 10−5M
𝛽-mercaptoethanol (Sigma Genosys), 2 mM L-glutamine
(Sigma Genosys), 10−6M dexamethasone (Sigma Genosys),
and 1 U/mL human recombinant erythropoietin (EPO) (Tebu-bio, Magenta, Milano, Italy), and stem cell factor (SCF, BioSource International, Camarillo, CA, USA) at the final concentration of 10 ng/mL. Erythroid differentiation was assessed by benzidine staining, in a solution containing 0.2% benzidine HCl (Sigma Genosys) in 0.5 M glacial acetic acid,
preactivated with 10% (v/v) of a solution 30% H2O2[36].
2.16. Induction of Erythroid Differentiation and Transduction of MEL Cells. MEL cells were stimulated to differentiation
by dimethyl sulfoxide (DMSO) [37] (Sigma Genosys) and
transduced with the lentiviral vectors T9W [31] or
T9W-IVSI-6. The infection was performed by plating 2× 10⁶MEL cells in
3 mL of medium in a 6-well plate; then fresh 2% v/v DMSO
was added and cells were incubated 18–20 hours at 37∘C in
a humidified incubator in an atmosphere of 5% CO2. Then,
MEL cells were infected with T9W, a lentiviral vector carrying
the human 𝛽-globin gene and large elements from the
human locus control region (LCR), at an MOI (multiplicity
of infection) of 0.5. We used polybrene at 8𝜇g/mL final
concentration to facilitate viral entry and then incubated the
cells for 16 hours at 37∘C in a humidified incubator in an
atmosphere of 5% CO2. The infected cells were collected by
centrifuging at 300 g for 5 minutes at room temperature, to remove the medium containing not integrated viral particles. The cells were then resuspended in 3 mL of fresh medium and replated in a 6-well plate. After 10 hours, MEL cells were collected and spun at 300 g for 5 minutes at room temperature. The treatment of MEL cells with T9W-IVSI-6
vector was performed as just described, after plating 5× 10⁵
MEL cells in 1 mL of medium in a 24-well plate. Cells were counted in a Burker chamber and the benzidine positive ones
were determined as percentage as elsewhere reported [36].
2.17. Western Blotting. 10𝜇L of 1 : 200 diluted mouse whole
blood was analyzed and 4𝜇g of human adult hemoglobin A0
(H-0267, Sigma Genosys) was used as migration reference;
proteins were denatured for 5 minutes at 98∘C in SDS gel
loading buffer 1x (50 mM Tris-HCl pH 6.8, 2% SDS, 100 mM Dithiothreitol (DTT), 0.1% bromophenol blue, 10% glycerol)
and separated by SDS-PAGE, by using a 10 cm× 8 cm gel and
Tris-glycine Buffer (25 mM Tris, 192 mM glycine, 0.1% SDS). The electrotransfer to 20 microns nitrocellulose membrane
was performed for 3 hours at 400 mA and 4∘C, in
The membrane was prestained in Ponceau S Solution (Sigma Genosys) to verify the transfer, washed with 25 mL Tris-buffered saline (TBS) (10 mM Tris-HCl pH 7.4, 150 mM NaCl) for 10 minutes at room temperature and incubated in 20 mL of blocking buffer (TBS, 0.1% Tween-20, 5% w/v nonfat dry milk) for 1 hour at room temperature. The membrane was then incubated with primary mouse monoclonal antibody (1 : 200) (sc-21757, Santa Cruz Biotechnology, Santa Cruz, CA,
USA) targeting the human 𝛽-globin, in 10 mL of blocking
buffer with gentle agitation overnight at 4∘C. The day after, the
membrane was washed three times for 5 minutes each with 20 mL of TBS/T (TBS, 0.1% Tween-20) and incubated with 25 ng/mL anti-mouse HRP-conjugated secondary antibody (1 : 2000) (Pierce Thermo Scientific, Rockford, IL, USA) in 10 mL TBS/T with gentle agitation for 1 hour at room temperature. After three washes, each with 15 mL of TBS/T for 5 minutes, finally the membrane was incubated with 5 mL of Western Lightning Chemiluminescence Reagent Plus (PerkinElmer Sciences, Waltham, MA, USA) with gentle agitation for 1 minute at room temperature and exposed to X-ray film (Amersham Hyperfilm ECL, GE Healthcare, Buck-inghamshire, UK). For western blotting in nondenaturing
conditions, 10𝜇L of 1 : 200 diluted mouse whole blood, 30 𝜇g
of MEL cells extracts, and 500 ng of human adult hemoglobin
A0 (H-0267, Sigma Genosys) were diluted in 1x native gel
loading buffer (50 mM Tris-HCl pH 8.8, 0.1% bromophenol blue, 10% glycerol) and separated by a NATIVE-PAGE, by
using a 10 cm× 8 cm gel and Tris-glycine buffer without SDS.
The following steps and conditions were the same described above for denaturing western blotting.
2.18. Capillary Electrophoresis (CE). High voltage CE was
performed by using the Minicap Flex Piercing capillary system (Sebia, Lisses, France). Manufacturer’s guidelines were followed in performing the analysis. Sample processing
required a 1 : 6 dilution of 50𝜇L whole blood with hemolysing
solution and vortexing for 5 seconds. After loading the primary sample tubes into the carousel, the instrument per-formed automated bar code reading, mixing of the samples by inversion, cap piercing, sampling, and dilution. Elec-trophoresis was performed at alkaline pH (9.4), high voltage (9500 V), and controlled temperature. The hemoglobin bands were detected by absorption photometry, and optical density measurements were converted to a migration image, dis-played as a graph called “electropherogram.” The migration position is measured in arbitrary units between 0 and 300 and can be quantified as a percentage. Results were acquired and examined by using the Sebia Phoresis REL 8.6.2 Software.
2.19. RT-PCR for Alternatively Spliced Transcripts. After RQ1
DNAse (Promega) treatment, 250–500 ng of total RNA were used to synthesize cDNAs, using Superscript VILO cDNA Synthesis kit (Invitrogen), according to the manufacturer’s
instructions. PCR was performed using 2 out of 20𝜇L of
reverse transcription reaction mixture, 2 U of DyNAzyme
DNA polymerase (Finnzymes) and 33𝜇M deoxynucleoside
triphosphates. Fluorescent PCR products were obtained using the HuBetaF1[6-FAM] forward and HuBetaR reverse
1 1383 2765 4147 5529 6911 8293 9675 11057 12439 T9W-IVSI-6 Amp f1 ori 5LTR 3LTR LCR PGK GFP WPRE RRE ClaI4582 XcmI10652 Ψ 13824 bp
Mutated𝛽-globin gene
· · GTTGGTGGTGAGGCCCTGGGCAGGTTGGTTATCAAGG TTACAAGACAGGTTTAAGGAGACCAATAGAAACTGGGC ATGTGGAGACAGAGAAGACTCTTGGGTTTCTGATAGGC ACTGACTCTCTCTGCCTATTGGTCTATTTTCCCACCCTT AGGCTGCTGGTGGTCTACCCTTGGACCCAGAGGTTCT · · Exon 1 Exon 2 𝛽+IVSI-6 T→C -globin promoter 𝛽
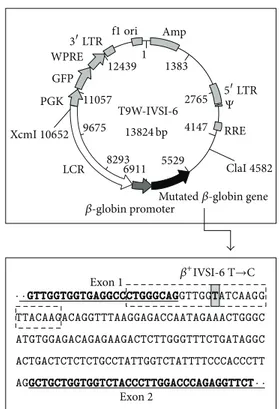
Figure 1: Map of the T9W-IVSI-6 vector showing the XcmI and ClaI restriction sites, used to cut the vector for microinjection. The human 𝛽-globin genomic region containing the 𝛽+IVSI-6 thalassemic point mutation (grey box) is also reported. The final portion of the𝛽-globin exon 1 and the first portion of the 𝛽-globin exon 2 are underlined and marked in bold characters. The position of mutagenesis primers is boxed with a dashed line.
primers (Table 2) and detected after electrophoresis in a
denaturant polyacrylamide gel using the ABI GeneScan Analysis Software, version 3.1 (Applied Biosystems). For the specific amplification of the aberrant transcript caused by the activation of the cryptic splicing site at position IVSI+13,
IVSI+13F forward and HuBetaR reverse primers (Table 2), designed to amplify, after retrotranscription, 84 bp of human 𝛽-globin alternatively spliced transcript or 202 bp of human
pre-mRNA (containing all the first human𝛽-globin intron),
were employed. The PCR conditions were as follows: 40–50 cycles of amplification, with 10 seconds of denaturation at
95∘C, 30 seconds of annealing at 66∘C, and 15 seconds of
elon-gation at 72∘C. Negative controls (no template cDNA) were
also run to assess specificity and to rule out contamination.
3. Results
3.1. Vector Design and Construction. For the generation of
transgenic mice, we designed and produced a construct mod-ifying the pCCL.𝛽-globin.PGK.GFP.WPRE (T9W) cassette
previously described [31]. This cassette contains the human
𝛽-globin gene under the control of its physiological promoter and a portion of the human locus control region (LCR)
(Figure 1). The construct, named T9W-IVSI-6, was generated
M NF NF NF Founder mouse TG1 1118 bp 881 bp 692 bp 501 bp 404 bp 331 bp 242 bp 190 bp 147 bp 110 bp (—) 871bp M NF NF NF Founder mouse TG1 1118 bp 881 bp 692 bp 501 bp 404 bp 331 bp 242 bp 190 bp 147 bp 110 bp 449 bp (—) A G G T TG G C AT C A A G G 𝛽+IVSI-6 (a) M NF NF Founder mouse TG1 (—) 154 bp 1118 bp 881 bp 692 bp 501 bp 404 bp 331 bp 242 bp 190 bp 147 bp 110 bp (b) (c) (d)
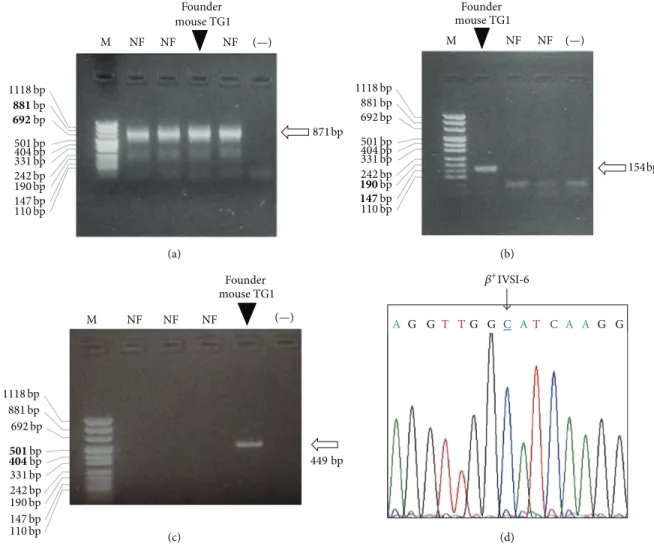
Figure 2: Identification of the founder mouse of the transgenic𝛽+IVSI-6 line. (a–c) Electrophoretic analyses of PCR products obtained by the amplification of murine genomic DNAs with primers MuActF-MuActR (a), TransF-TransR (b), and HuBetaF-HuBetaR (c), recognizing the murine𝛽-actin gene, the transgene sequence, and the human 𝛽-globin gene, respectively. NF, negative founders; (−), negative control (water added to the amplification mixture); M, molecular weight ladder, pUC Mix Marker 8 (Fermentas). Arrows indicate the expected position of the specific amplification products; the lanes carrying the specific PCR products, relative to the founder mouse TG1, are also indicated. (d) Portion of electropherogram obtained by sequencing the HuBetaF-HuBetaR PCR product, obtained by the founder mouse TG1. The arrow indicates the peak corresponding to the𝛽+IVSI-6 thalassemic point mutation (underlined nucleotide).
mutation, one of the most common molecular defects present
in the𝛽-thalassemia populations of Italy and Greece, in the
human𝛽-globin gene.
3.2. Production of the Transgenic Founder Mouse Carrying the Human𝛽-Globin Gene with the 𝛽+IVSI-6 Mutation
(TG-𝛽-IVSI-6). Potential TG-𝛽-IVSI-6 founder mice were pro-duced by microinjection of the purified 6.1 Kb XcmI-ClaI
fra-gment, corresponding to the𝛽+IVSI-6 insert, from the
con-struct T9W-IVSI-6 (Figure 1).
For the screening and identification of the transgenic founders, murine genomic DNA was purified from the tails and analyzed by polymerase chain reaction (PCR).
Figure 2(b) shows that only the genomic DNA of the
TG-𝛽-IVSI-6 founder mouse (founder mouse TG1) was amplified
by using TransF and TransR primers (Table 1), which anneal
to the transgene sequence, while all the analyzed samples
were amplified by using PCR primers specific for the murine
𝛽-actin gene (Figure 2(a)). Accordingly, Figure 2(c) shows
the electrophoretic analysis of PCR products obtained by the amplification of four samples of murine genomic DNA
with primers HuBetaF and HuBetaR (Table 1), specific for
the human𝛽-globin gene: again, the expected 449 bp band
was generated only by the amplification of genomic DNA belonging to the founder mouse TG1. The 449 bp PCR
product shown inFigure 2(c) was sequenced to confirm that
the𝛽+IVSI-6 thalassemic point mutation was present in the
DNA of the TG-𝛽-IVSI-6 founder mouse (Figure 2(d)).
3.3. Characterization of the TG-𝛽-IVSI-6 Homozygous Mice.
As a first step to produce homozygous𝛽+IVSI-6 transgenic
lines, the founder mouse was back-crossed with wild-type
mice.Figure 3(a)shows the electrophoretic migration of PCR
M 1118 bp 881 bp 692 bp 501 bp 404 bp 331 bp 147 bp 110 bp 242 bp 190 bp ♀ ♀ ♀ ♂ ♂ ♀ ♂ 154 bp (a) 0.0 0.1 0.2 0.3 0.4 0.5 0.6 TG24 TG27 TG21 TG1 T ra n sg enic mice
Human𝛽-globin allele fold (Hb𝛽/Act𝛽)
(b)
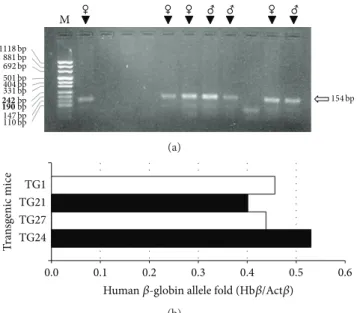
Figure 3: Identification of hemizygous mice among animals belong-ing to the F1 generation. (a) Agarose gel electrophoretic analysis of PCR products obtained by the amplification of genomic DNA puri-fied from eleven mice with primers TransF and TransR, recognizing the transgene sequence. The arrow indicates the position of the expected 154 bp product; the sex of mice having generated a specific amplification band is also shown. M, molecular weight ladder, pUC Mix Marker 8 (Fermentas). (b) Human𝛽-globin allele quantification by real-time PCR using primers and probes specific for human 𝛽-globin (Hb𝛽) gene and mouse cytoplasmic 𝛽-actin (Act𝛽) gene. Results of analysis of transgenic hemizygous mice TG21, TG24, and TG27, together with the founder mouse TG1, are reported as fold of human𝛽-globin allele amount quantified with respect to the murine 𝛽-actin gene.
purified from eleven mice belonging to the F1 generation, with primers recognizing the transgene sequence. The arrow indicates the position of the 154 bp expected PCR product
of the human 𝛽-globin transgene: we obtained three male
and four female hemizygous mice. Homozygous animals were finally produced by crossing hemizygous F1 mice. In order to get preliminary information on the number of inte-gration events occurring, quantitative real-time PCR assays were carried out by using gene-specific double fluorescently labeled probes. The analyses of three hemizygous mice (TG21,
TG27 and TG24) are shown in Figure 3(b)and show a
𝛽-globin/𝛽-actin ratio of about 0.5, compatible with a single copy integration of the transgene.
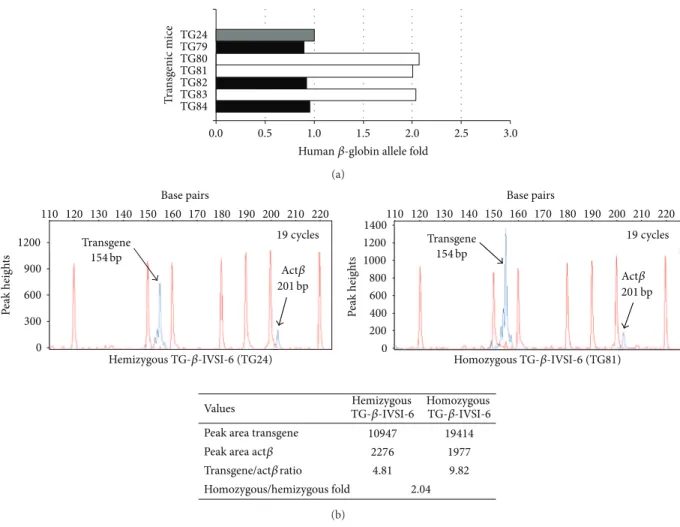
As a second step, in order to discriminate hemizygous and homozygous mice, real-time PCR analyses were performed.
Figure 4(a) shows the real-time PCR analysis of six F2
transgenic mice, three of which are hemizygous (TG79, TG82, and TG84) and three homozygous (TG80, TG81, and TG83),
according to the 𝛽-globin gene amplification compared to
the F1 hemizygous TG24 mouse. These data were confirmed by quantitative multiplex PCR of short fluorescent fragments (QMPSF), as indicated by the representative example shown
inFigure 4(b), performed on TG24 and TG81 mice. In the
lower panel ofFigure 4(b), the absolute value of human
𝛽-globin (transgene) and mouse𝛽-actin (Act𝛽) peak areas are
indicated, together with their relative ratio in hemizygous and homozygous mice. These data indicate the establishment of the homozygous line.
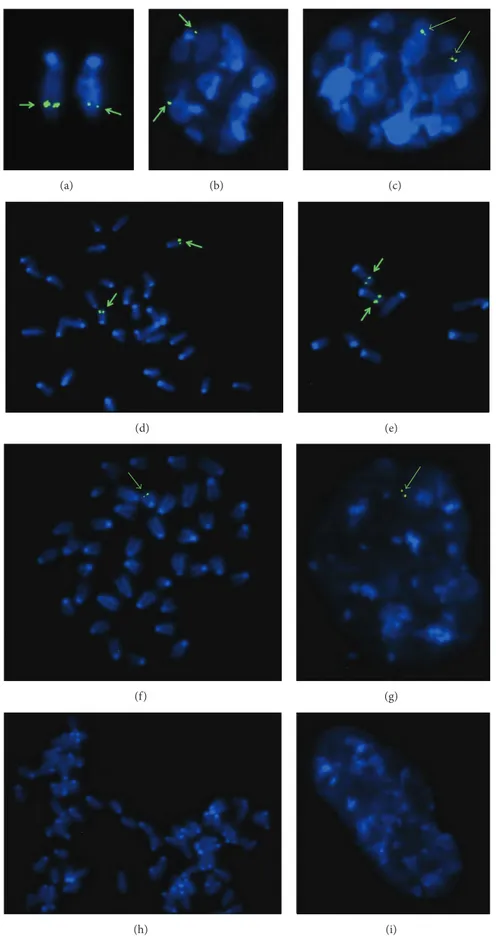
3.4. Chromosomal Localization of the Human𝛽-IVSI-6
Trans-gene. Figure 5 shows representative FISH analyses
per-formed on wild-type, hemizygous, and homozygous𝛽+
IVSI-6 transgenic mice, demonstrating that integration occurred at band F2 of the mouse chromosome 7. As clearly shown, no FISH signals were found in wild-type samples (Figures
5(h)and 5(i)). Only one chromosome 7 gave FISH signals
in hemizygous samples (Figures 5(f) and 5(g)), while in
homozygous samples both chromosomes gave FISH signals
(Figures5(a)–5(e)). These data support the concept that only
one integration unit of the human 𝛽+IVSI-6 transgene is
present in the produced homozygous 𝛽+IVSI-6 transgenic
mice. These data have been reproduced several times obtain-ing identical results.
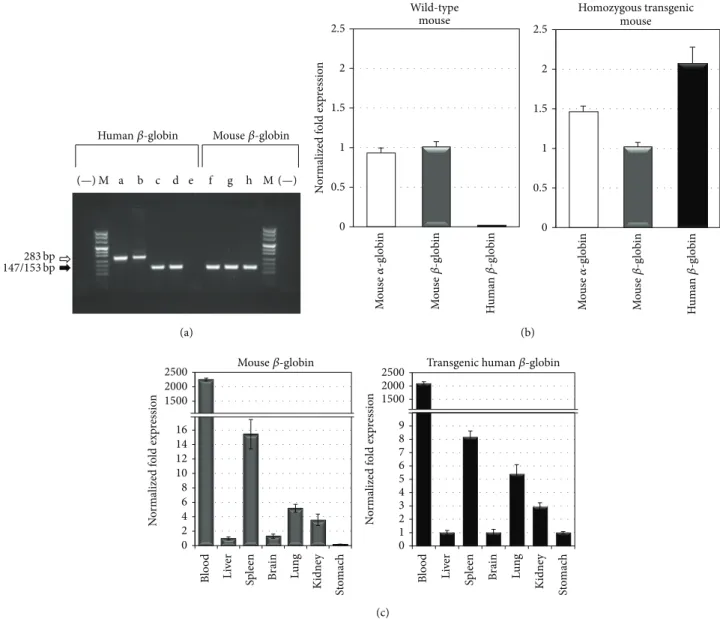
3.5. Tissue Specific Expression of the Human𝛽-IVSI-6
Trans-gene. Figure 6(a) shows the RT-PCR analysis performed with total RNA isolated from wild-type (lanes e and h), transgenic hemizygous (lanes c and f) and transgenic homozygous (lanes d and g) TG-𝛽-IVSI-6 mice using HuBetaF1 and HuBetaR
primers (lanes c, d, e), which selectively amplify human
𝛽-globin transcript, and primers MuBetaF and MuBetaR (lanes
f, g, h) specific for mouse𝛽-globin transcript. All the samples,
amplified using the murine specific primers, generated the
expected 147 bp product, whereas the human𝛽-globin PCR
product (153 bp) was obtained only from transgenic animals, but not from wild-type mice. Genomic DNA and T9W vector DNA were also amplified with HuBetaF1 and HuBetaR primer pair (lanes a and b), showing a 283 bp product containing the intronic sequence as well.
The analysis confirms the human 𝛽-IVSI-6 transgene
expression and the quantitative RT-PCR analyses shown in
Figure 6(b) support this evidence: amplification employing
the HuBetaF1 and HuBetaR primers (black bar) was indeed observed only in the blood of transgenic mice. No significant
differences were found in the endogenous 𝛼 and 𝛽-globin
expression between wild-type and transgenic mouse blood
samples. The right panel of Figure 6(c) shows that high
transgene expression is mainly observed in blood and to a much lower extent in the spleen. The transgene tissue specific expression was confirmed by comparing the amount of the
human IVSI-6𝛽-globin transgenic RNA to the endogenous
murine 𝛽-globin mRNAs isolated from different tissues,
including spleen, brain, liver, lung, stomach, and kidney (left
panel of Figure 6(c)). The expression of human 𝛽-globin
transcripts in transgenic mouse tissues (right panel, black
bars) is comparable to the endogenous mouse𝛽-globin
tran-scripts (left panel, grey bars), and the highest transcription of both human and murine globin mRNAs was restricted to the splenic compartment, as expected; in addition, the
results shown inFigure 6(c) demonstrate that the pattern of
IVSI-6𝛽-globin RNA expression is very similar to that of
murine 𝛽-globin RNA, strongly suggesting that the tissue
0.0 0.5 1.0 1.5 2.0 2.5 3.0 T ra n sg enic mice
Human𝛽-globin allele fold TG84 TG83 TG82 TG81 TG80 TG79 TG24 (a)
Values HomozygousTG-𝛽-IVSI-6
Peak area transgene 19414
Peak area act 1977
Transgene/act𝛽ratio Hemizygous TG-𝛽-IVSI-6 10947 2276 4.81 9.82 Homozygous/hemizygous fold 2.04 𝛽 P eak heig h ts 19 cycles Transgene 154 bp 0 200 400 600 800 1000 1200 1400 Act𝛽 201 bp Base pairs 110 120 130 140 150 160 170 180 190 200 210 220 Homozygous TG-𝛽-IVSI-6 (TG81) P eak heig h ts 19 cycles Transgene 154 bp Act𝛽 201 bp 0 300 600 900 1200 Base pairs Hemizygous TG-𝛽-IVSI-6 (TG24) 110 120 130 140 150 160 170 180 190 200 210 220 (b)
Figure 4: Discrimination between hemizygous and homozygous genotypes of transgenic mice by quantitative real-time PCR (a) or quantitative multiplex PCR of short fluorescent fragments (QMPSF) (b). (a) The amount of human𝛽-globin allele was calculated using the comparative cycle threshold method [15,33,34] employing transgenic mouse TG24 as one copy control (hemizygous reference, grey). The black and white histograms represent hemizygous or homozygous transgenic (TG) mice, respectively. (b) Electropherograms obtained after denaturing polyacrylamide gel electrophoresis of amplification products of multiplex PCRs: primers employed (Table 1) were
TransF[6FAM]-TransR and MuActF1[6FAM]-MuActR1, recognizing the transgene and the murine𝛽-actin gene (Act𝛽), respectively; templates were genomic
DNAs purified from a hemizygous (upper left panel) or a homozygous (upper right panel) mouse. Peaks generated by the molecular weight ladder (120, 150, 160, 180, 190, 200, 220 bp fragments) and by the amplification products (transgene and Act𝛽, indicated by the arrows) are reported in red and blue, respectively. Values obtained, as peak areas, transgene/Act𝛽 ratio and fold of ratios calculated from homozygous and hemizygous animals are shown in the lower part of panel (b).
analyzed. Moreover, the endogenous expression of murine
𝛽-like globin genes is not perturbed by the integration of the 𝛽-IVSI-6 transgene.
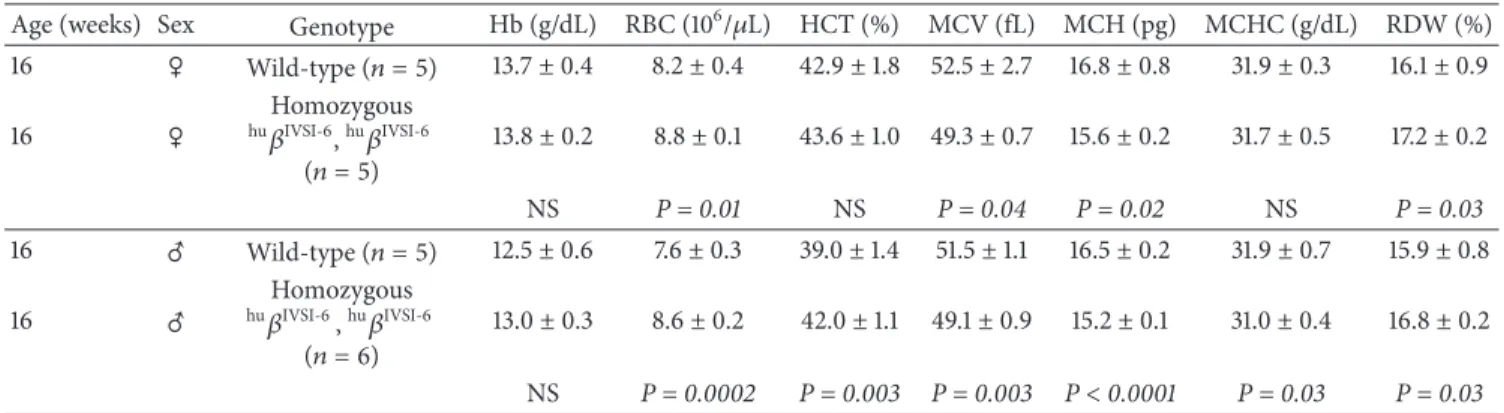
3.6. Hematological Parameters of TG-𝛽-IVSI-6 Mice. The
hematological parameters of wild-type and transgenic
TG-𝛽-IVSI-6 mice are reported inTable 3. In total, we analyzed
10 wild-type and 11 TG-𝛽-IVSI-6 mice, 16-week-old. No significant differences were observed in total hemoglobin content between males and females. Concerning the other parameters examined, no major differences were found, despite the fact that some hematological data support the possibility that TG-𝛽-IVSI-6 mice produce higher levels of RBC (red blood cells). In addition, it should be noted that RDW (red cell distribution width) is higher and that MCV
(mean corpuscular volume) and MCH (mean corpuscular hemoglobin) are lower in transgenic TG-𝛽-IVSI-6 mice in respect to wild-type mice.
3.7. TG-𝛽-IVSI-6 Mice Produce Human 𝛽-Globin and Syn-thesize Mouse/Human𝑚𝑢𝛼-Globin2/ℎ𝑢𝛽-Globin2 Hybrid He-moglobin. We performed a western blotting experiment to
determine whether the accumulated human𝛽-globin mRNA
is translated into human 𝛽-globin protein (Figure 7(a)). A
human specific primary antibody was used to label the
human𝛽-globin. No cross-reaction with any of the
endoge-nous murine globins was observed. A𝛽-globin specific band
is detectable in samples from both hemizygous and homozy-gous TG-IVSI-6 mice, demonstrating that the human 𝛽-globin mRNA produced by the transgene is translated into
(a) (b) (c)
(d) (e)
(f) (g)
(h) (i)
Figure 5: Fluorescence in situ hybridization results on metaphase (a, d, e, f, h) or G1 (b) and G2 (c, g, i) interphase nuclei of homozygous (a–e), hemizygous (f-g), and wild-type mice (h-i). The arrows indicate the integration site of the transgene, located in mouse chromosome 7.
a b c d e f g h
M M
Human𝛽-globin Mouse𝛽-globin
(—) (—) 283 bp (a) N o rm alized f o ld exp ressio n Wild-type mouse 0 0.5 1 1.5 2 2.5 Mo u se 𝛼 -g lob in Mo u se 𝛽 -g lob in Hu m an 𝛽 -g lob in Homozygous transgenic mouse 0 0.5 1 1.5 2 2.5 Mo u se 𝛼 -g lob in Mo u se 𝛽 -g lob in Hu m an 𝛽 -g lob in (b) B lood Live r Sp leen Brai n Lu n g Ki d n ey St o m ac h
Transgenic human 𝛽-globin 2500 2000 1500 9 8 7 6 5 4 3 2 1 0 N o rm alized f o ld exp ressio n 2500 2000 1500 16 14 12 10 8 6 4 2 0 B lood Live r Sp leen Brai n Lu n g Ki d n ey St o m ac h Mouse𝛽-globin N o rm alized f o ld exp ressio n (c) 147/153 bp
Figure 6: Expression of human𝛽-globin transcripts in the transgenic TG-𝛽-IVSI-6 mouse model. (a) RT-PCR was performed with total RNA isolated from wild-type (lanes e and h), transgenic hemizygous (lanes c and f), and transgenic homozygous (lanes d and g) mice with primers HuBetaF1 and HuBetaR (Table 2) designed to specifically amplify a 153 bp fragment of human𝛽-globin transcripts (lanes a–e) and primers MuBetaF and MuBetaR (lanes f–h) designed to specifically amplify a 147 bp fragment of mouse𝛽-globin transcripts (black arrow). Genomic DNA and pCCL.𝛽-globin.PGK.GFP.WPRE vector DNA were also used as control templates (lanes a and b, 283 bp, white arrow). M, molecular weight ladder, pUC Mix Marker 8 (Fermentas), (−), negative control for each primer pair. (b) SYBR Green real-time PCR was used to determine the relative expression of mouse𝛼-globin, mouse 𝛽-globin, and human 𝛽-globin transcripts in wild-type mouse blood (left side of the panel) and in homozygous transgenic mouse blood (right side of the panel). (c) Relative expression levels of mouse𝛽-globin (grey bars) and human𝛽-globin (black bars) transcripts in transgenic mouse tissues using real-time RT-PCR. Mean ± SD values were determined for each fold difference; the relative proportions of𝛽-globin/𝛽-actin in each template were determined by using IQ5 software (Bio-Rad), employing theΔΔCt method [15,33,34].
a normal 𝛽-globin. As expected, the amount of 𝛽-globin
produced by homozygous mice is higher than that produced by hemizygous animals.
The native electrophoresis and western blotting analysis
reported in Figure 7(b) suggest that a hybridmu𝛼-globin2/
hu𝛽-globin
2hemoglobin is present in both homozygous and
hemizygous TG-𝛽-IVSI-6 mice. Control experiments were performed by using T9W-transduced MEL cells (see also Supplementary Figure S1 in the Supplementary Material
available online athttp://dx.doi.org/10.1155/2015/687635 for
the analysis of the results obtained following transduction),
confirming that a hybrid mu𝛼-globin2/hu𝛽-globin2
hemo-globin can be produced when the human 𝛽-globin gene is
expressed under a murine cellular context (Figure 7(b), right
side of the panel). The qualitative western blotting shown in
Figure 7(b) does not provide conclusive information about
the proportion ofmu𝛼-globin2/hu𝛽-globin2hemoglobin
(A) (B) wt hemi homo Mouse blood A0 (a) T9W MEL wt hemi homo Mouse blood (—) A0 (A) (B) (b) Wild-type mouse 80 100 120 140 160 180 200 220 1 0.5 0.25 Migration (a.u.) muhemoglobins A b so rba n ce (r ela ti ve uni ts) (c) 1 0.5 0.25 A b so rba n ce (r ela ti ve uni ts) muhemoglobins 80 100 120 140 160 180 200 220 Migration (a.u.) TG-𝛽-IVSI-6 mouse mu𝛼-globin 2/hu𝛽-globin2 hemoglobin (d)
Figure 7: Analysis of transgenic protein synthesis in the TG-𝛽-IVSI-6 mouse model. (a) Western blotting was employed to determine the presence of human𝛽-globin in the blood of wild-type (wt), hemizygous (hemi), and homozygous (homo) mice by using a human 𝛽-globin specific primary antibody (A). Human adult A0hemoglobin was used as migration reference. (b) Native western blotting was performed by using a human𝛽-globin specific primary antibody (A) and by employing, as a template, wild-type (wt), hemizygous (hemi), or homozygous (homo) mouse blood, and cell extracts obtained from MEL cells either infected with T9W lentiviral vector and treated with DMSO (T9W) or treated with DMSO only (−). Red Ponceau staining was used to verify that an equal amount of sample was loaded in each well and to verify the transfer to the membrane ((B) in panels (a) and (b)). (c, d) Capillary electrophoresis of whole blood from wild-type (c) and homozygous TG-𝛽-IVSI-6 (d) mice. Peaks generated by murine hemoglobins and hybridmu𝛼-globin
2/hu𝛽-globin2hemoglobin are indicated; a.u., arbitrary
units.
estimate the percentage of hybridmu𝛼-globin2/hu𝛽-globin2
hemoglobin with respect to the total murine hemoglobin pro-duction, high voltage capillary electrophoresis (CE)
experi-ments were performed (Figures7(c) and7(d)). This system,
unlike HPLC [41], allows a clear separation between the
murine Hbmajor/Hbminor and the murine/human hybrid
mu𝛼-globin
2/hu𝛽-globin2 hemoglobin. The results obtained
indicate that the mu𝛼-globin2/hu𝛽-globin2 hemoglobin is
clearly detectable in transgenic animals (see the
representa-tive CE analysis shown inFigure 7(d)), representing3.9±0.4%
of the total hemoglobin produced in 6 TG-𝛽-IVSI-6 mice analyzed.
3.8. Presence of Aberrantly Spliced Molecules in TG-𝛽-IVSI-6 Mice. In Figure 8(a) a scheme of the mutation effects on
human 𝛽-globin gene and mRNA is shown. The sequence
containing the first and second 𝛽-globin gene exons is
reported, and the site of the IVSI-6 mutation and the three cryptic splicing sites that may arise in IVSI-6 pre-mRNA are
emphasized by coloured boxes (Figure 8(b)). A schematic
representation and expected size of the normal and
alterna-tively spliced𝛽-globin transcripts in IVSI-6 thalassemic cells
are shown inFigure 9(a). As expected, the electropherogram
of the 𝛽-globin RNA, amplified from erythroid progenitor
Table 3: Hematological data of transgenic mice carrying the humanhu𝛽IVSI-6globin locus.
Age (weeks) Sex Genotype Hb (g/dL) RBC (106/𝜇L) HCT (%) MCV (fL) MCH (pg) MCHC (g/dL) RDW (%)
16 C Wild-type (𝑛 = 5) 13.7± 0.4 8.2± 0.4 42.9± 1.8 52.5 ± 2.7 16.8± 0.8 31.9± 0.3 16.1± 0.9 16 C Homozygous hu𝛽IVSI-6,hu𝛽IVSI-6 (𝑛 = 5) 13.8± 0.2 8.8± 0.1 43.6± 1.0 49.3 ± 0.7 15.6± 0.2 31.7± 0.5 17.2± 0.2 NS P = 0.01 NS P = 0.04 P = 0.02 NS P = 0.03 16 D Wild-type (𝑛 = 5) 12.5± 0.6 7.6± 0.3 39.0± 1.4 51.5± 1.1 16.5± 0.2 31.9± 0.7 15.9± 0.8 16 D Homozygous hu𝛽IVSI-6,hu𝛽IVSI-6 (𝑛 = 6) 13.0± 0.3 8.6± 0.2 42.0± 1.1 49.1 ± 0.9 15.2± 0.1 31.0± 0.4 16.8± 0.2 NS P = 0.0002 P = 0.003 P = 0.003 P< 0.0001 P = 0.03 P = 0.03
Hematological values are expressed as means± SD. Hemoglobin concentration (Hb), red blood cell count (RBC), hematocrit (HCT), mean corpuscular volume
(MCV), mean corpuscular hemoglobin (MCH), mean corpuscular Hb concentration (MCHC), red cell distribution width (RDW) are shown.𝑛 indicates
the number of analyzed mice. The𝑃 values of Student’s 𝑡-test, comparing each group of transgenic mice with wild-type mice controls, are also shown. NS
corresponds to not statistically significant𝑃 > 0.05.
IVSI IVSII
5 3
Exon1 Exon2 Exon3
GTGT GT TGATGA 5 3 UGAUGA 𝛽-globin gene 𝛽-globin mRNA (a)
+13 cryptic splicing site
−16 cryptic splicing site and relative PTC −38 cryptic splicing site and relative PTC −6 +45 +95 +145 +195 +245 +295 +345 +395 +445 +495 ttgcttacat gacaccatgg gtggggcaag tggcatcaag tgtggagaca gcctattggt acccagaggt tatgggcaac ttagtgatgg ctgagtgagc ggtgagtcta ttgcttctga tgcacctgac gtgaacgtgg gttacaagac gagaagactc ctattttccc tctttgagtc cctaaggtga cctggctcac tgcactgtga tgggaccctt cacaactgtg tcctgaggag atgaagttgg aggtttaagg ttgggtttct acccttaggc ctttggggat aggctcatgg ctggacaacc caagctgcac gatgttttct ttcactagca aagtctgccg tggtgaggcc agaccaatag gataggcact tgctggtggt ctgtccactc caagaaagtg tcaagggcac gtggatcctg ttccccttct acctcaaaca ttactgccct ctgggcaggt aaactgggca gactctctct ctacccttgg ctgatgctgt ctcggtgcct ctttgccaca agaacttcag tttctat... (b)
Figure 8: (a) Schematic representation of the human𝛽-globin gene and mRNA. The three cryptic GT splicing sites activated by the IVSI-6 mutation and the two consequent stop codons are indicated with different colours. The IVSI-6 mutation (T→C) is identified by a red star. (b) Genomic region containing the first and second exons of the human𝛽-globin gene, in bold characters. The IVSI-6 mutation occurring at the sixth nucleotide of the first intron is shown in red. The coloured boxes indicate the three cryptic splicing sites activated by the mutation and the two consequent stop codons. The transcription and translation starting sites are also indicated.
Exon1 Exon2 (B) 115 bp (A) 153 bp (C) 137 bp (D) Exon 1 Exon 2 165 bp GU −38 cryptic GU −16 cryptic GU cryptic +13
Exon 1 Exon 2 Exon 1 Exon 2
Exon 1 Exon 2 Normal splicing Altered splicing Altered splicing Altered splicing (a) 153 bp 80 100 120 140 160 180 200 7000 6000 5000 4000 3000 2000 1000 0 Healthy donor D ye signal (a.u .) Amplicon size (bp) 115 bp 137 bp 165 bp 153 bp 80 100 120 140 160 180 200 7000 6000 5000 4000 3000 2000 1000 0
IVSI-6 homozygous patient
D ye signal (a.u .) Amplicon size (bp) (b) 153 bp 165 bp 115 bp 137 bp 80 100 120 140 160 180 200 7000 6000 5000 4000 3000 2000 1000 0 TG-𝛽-IVSI-6 homozygous mouse (B) D ye signal (a.u .) Amplicon size (bp) 153 bp 115 bp 137 bp 165 bp 80 100 120 140 160 180 200 7000 6000 5000 4000 3000 2000 1000 0 TG-𝛽-IVSI-6 homozygous mouse (A)
D ye signal (a.u .) Amplicon size (bp) 80 100 120 140 160 180 200 7000 6000 5000 4000 3000 2000 1000 0 wt mouse D ye signal (a.u .) Amplicon size (bp) (c)
Figure 9: Normal and aberrant splicing in IVSI-6𝛽-globin gene. (a) Schematic representation of the normal (A) and altered splicing (B, C, D) in IVSI-6 thalassemia. Grey arrows indicate the primers used to demonstrate the presence of the altered splicing. The positions of the cryptic splicing sites generated by the mutation and the respective lengths (in bp) of products obtained after PCR amplification of altered transcripts are indicated with different colours. A red star locates the IVSI-6 mutation. (b, c) Identification of aberrantly spliced transcripts in IVSI-6 patients and in the TG-𝛽-IVSI-6 mouse model. (b) Electropherograms generated by denaturing polyacrylamide gel electrophoresis of fluorescent RT-PCR products obtained from healthy donor blood (left panel) and IVSI-6 homozygous patient blood (right panel). (c) Electropherograms obtained from a wild-type and two TG-𝛽-IVSI-6 mice (A, B). Primers employed were
Table 4: Relative contents of𝛽-globin transcripts.
Sample Experiment Peaks (%)
115 bp 137 bp 153 bp 165 bp
Splicing site generating the transcript −38 (cryptic) −16 (cryptic) +1 (normal) +13 (cryptic) ErPCs from normal donors
1 0 0 100 0
2 0 0 100 0
3 0 0 100 0
ErPCs from homozygous 𝛽-IVSI-6/𝛽-IVSI-6 patients 1 19.9 13.6 65.8 0.7 2 16.1 13.7 69.2 1.0 3 14.4 18.7 66.2 0.7 TG-𝛽-IVSI-6 homozygous mouse #1 1 4.3 0.3 93.8 1.6 2 7.6 0.1 88.6 3.7 TG-𝛽-IVSI-6 homozygous mouse #2 1 6.5 0.4 91.1 2.0 2 5.6 0.2 92.0 2.2 K562(𝛽-IVSI-6) #1 1 21.6 2.2 74.6 1.6 2 21.3 2.6 74.3 1.8 K562(𝛽-IVSI-6) #2 1 22.3 3.0 73.6 1.1
MEL(hu𝛽-globin gene) 1 0 0 100 0
MEL(hu𝛽-globin gene),
DMSO treated 1 0 0 100 0
MEL(hu𝛽-IVSI-6 globin
gene) 1 33.1 6.8 58.7 1.4
MEL(hu𝛽-IVSI-6 globin
gene), DMSO treated 1 38.5 5.8 54.5 1.2
(Figure 9(b), left panel); conversely, the electropherogram
of ErPCs from a homozygous IVSI-6 patient presents three
additional peaks of 115, 137, and 165 bp (Figure 9(b), right
panel), which represent the accumulation of the three
abnormal transcripts generated by the −38, −16, and +13
cryptic GU donor splicing sites produced by the IVSI-6 point mutation, respectively. Notably, the 165 bp peak is present in lower amount, as was consistently observed in additional
experiments using ErPCs from different patients (Table 4).
As expected, no peak is generated by using RNA from
wild-type mice (Figure 9(c), left panel), while when RNA from two
TG-𝛽-IVSI-6 mice is employed, both normal and abnormal
transcripts are observed (Figure 9(c), middle and right
pan-els). It should be emphasized, however, that the 137 bp peak is not present in this representative experiment, or it is present in very low amounts, as seen in additional experiments
(shown inTable 4). In order to understand this issue, we used
K562 cell clones stably containing the T9W-IVSI-6 vector, named K562(𝛽-IVSI-6), and murine MEL cells transduced with the T9W or the T9W-IVSI-6 lentiviruses, named MEL
(hu 𝛽-globin gene) and MEL (hu 𝛽-IVSI-6 globin gene),
respectively. All the results obtained are shown inTable 4,
demonstrating that, as expected, only the 153 bp peak is present in T9W-transduced MEL cells. Among the peaks generated by the activation of cryptic sites, the 115 bp peak is the most represented in the K562(IVSI-6) clones, as well as in MEL cells transfected with the T9W-IVSI-6 vector, while the 137 bp and 165 bp peaks are present in lower amounts. In any case the proportion of the 137 bp peak is higher than that
found in TG-𝛽-IVSI-6 homozygous mice. Similar patterns were observed in transduced DMSO-treated MEL cells. The
different levels of transcripts (seeTable 4) should be discussed
by taking in consideration the hierarchy of splicing events associated with the differential extent of complementarity with U1 and U6 small nuclear RNAs (snRNAs), as suggested
by Roca et al. (see alsoFigure 9andTable 5) [42]. The low
levels of the transcript corresponding to the 165 bp amplicon
(Table 4) might be explained by the very low strength of
its donor +13 cryptic splicing site, which do not generate
PTCs (see Table 5). On the contrary, both the transcripts
corresponding to the 115 bp and 137 bp amplicons generate PTCs, but the second one is highly unstable because of being
more sensitive to nonsense mediated decay (NMD) [43,44].
This might explain the low levels of this transcript found in TG-𝛽-IVSI-6 samples, as well as in MEL cells transduced
with a human𝛽-IVSI-6 globin gene vector (Table 4). In any
case, we like to underline that aberrant transcripts were found to be present in all the IVSI-6 experimental systems analyzed. The production of aberrant transcripts was also detected
by a simple RT-PCR procedure as described in Figure 10.
In this experiment, an RT-PCR reaction was performed by using RNA extracted from the ErPCs of either a healthy subject or an IVSI-6 homozygous patient and from trans-genic mouse blood. For the PCR reaction the IVSI+13F forward primer and the HuBetaR reverse primer, designed
to amplify a 84 bp fragment of the human𝛽-globin
alterna-tively spliced transcript or a 202 bp fragment of the human
Table 5: Strengths of the normal and cryptic splicing sites generated by the𝛽+IVSI-6 thalassemic mutation.
Splicing site Sequence Base
pairs Strength Amplicon size Comments/Hypotheses (a) (b) (c) +1 (normal) 3-G U C C A Ψ Ψ C A-5 5-C A G G U U G G U-3 3-A G A C A-5 U1 U6 7+ 3+ 86.64 8.08 0.64 153 bp +1 (mutated IVSI-6) 3-G U C C A Ψ Ψ C A-5 5-C A G G U U G G C-3 3-A G A C A-5 U1 U6 6+ 2+ 84.46 5.52 0.14 153 bp −38 (cryptic) 3-G U C C A Ψ Ψ C A-5 5-A A G G U G A A C-3 3-A G A C A-5 U1 U6 5+ 1 83.50 5.54 0.21 115 bp PTC. Unstable transcript, low sensitivity to NMD (in comparison with the −16 cryptic splicing site)
−16 (cryptic) 3-G U C C A Ψ Ψ C A-5 5-G U G G U G A G G-3 3-A G A C A-5 U1 U6 5+ 2 90.40 6.13 0.54 137 bp PTC. Unstable transcript, sensitive to NMD +13 (cryptic) 3-G U C C A Ψ Ψ C A-5 5-A A G G U U A C A-3 3-A G A C A-5 U1 U6 5+ 1+ 79.67 −0.83 0.46 165 bp No PTC. GT located 7 nucleotides downstream the IVSI-6 mutation
Sequences of the normal and cryptic splicing sites generated by the𝛽+IVSI-6 thalassemic mutation. The cryptic donor GU (boxed) sites are numbered with
respect to the +1 position of the normal one. Potential Watson-Crick base pairs to U1 (upper) and U6 (lower) are quantified: (+) indicates a G/U wobble base pair.
Strengths of donor splicing sites are expressed as scores calculated with Human Splicing Finder Matrices fromhttp://www.umd.be/HSF/(a) or MaxEntScan
fromhttp://www.umd.be/HSF/(b) or fromhttp://www.fruitfly.org/seq tools/splice.html(c).
were employed. A scheme of the expected PCR products is
reported inFigure 10(a). The results obtained demonstrated
that 𝛽-globin RNA precursor sequences are present in all
the samples, and aberrantly spliced𝛽-globin RNA sequences
are present only in samples from the IVSI-6 homozygous
patient and TG-𝛽-IVSI-6 mouse (Figure 10(b)). Interestingly,
the level of this aberrantly spliced transcript appears to be very high in the TG-𝛽-IVSI-6 sample, facilitating the possible
in vivo validation of corrections of this genetic defect.
4. Discussion
In this study we have reported the production and charac-terization of a transgenic mouse line carrying the human
IVSI-6 𝛽-globin gene. The IVSI-6 mutation leads to
ane-mia associated with a𝛽-thalassemia intermedia phenotype.
However, the association with a𝛽0-like mutation (such as
deletions,𝛽039, and𝛽0IVSI-1 mutations) and even𝛽+
muta-tions renders the phenotype of the heterozygous compound
more severe. Noticeably,𝛽+IVSI-6 thalassemia is the most
common in the Middle-Eastern regions, including Egypt, Israel, Lebanon. For this reason, an in vivo system suitable to study possible therapeutic strategies that target the aberrantly spliced RNAs generated by this mutation is highly needed.
We generated a transgenic TG-𝛽-IVSI-6 mouse, which (a) displays a tissue specific expression of the transgene, fully
overlapping with that of the endogenous murine 𝛽-globin
gene; (b) as expected it produces normally spliced human 𝛽-globin mRNA, giving rise to 𝛽-globin production and for-mation of a human-mouse tetrameric chimeric hemoglobin
mu𝛼
2 hu𝛽2and, more importantly, (c) exhibits in blood cells
aberrant IVSI-6𝛽-globin RNAs. We conclude that, despite
the fact that the human𝛽-IVSI-6 transgene is located in the
Exon 1 Exon 2 (A) (B) No PCR product GU PCR product 84 bp PCR product 202 bp (C) Normal splicing Altered splicing Exon 1 Exon 2 Exon 1 Exon 2 (a) (—) M M 84 bp 40 50 Healthy donor IVSI-6 50 40 Homozygous patient 50 40 Transgenic mouse 202 bp (b)
Figure 10: Identification of the aberrant transcripts generated by the activation of the cryptic splicing site at position IVSI+13, in the presence of IVSI-6 mutation. (a) Schematic representation of the human𝛽-globin pre-mRNA spanning from the first to the second exon (C); the creation of a new aberrant donor splicing site (GU) in the first intron, the IVSI-6 mutation site (star), the location of primers used for PCR (arrows), and the PCR product lengths are indicated. Normal splicing (A) and predicted aberrant splicing (B) are also represented. (b) RT-PCR reaction was performed by using RNA from healthy subject blood, from IVSI-6 homozygous patient blood and from transgenic mouse blood. The IVSI+13F forward primer and the HuBetaR reverse primer (Table 2), designed to amplify a fragment of 84 bp from human 𝛽-globin altered spliced transcripts or a fragment of 202 bp from human pre-mRNA (containing all the first human𝛽-globin intron), were used. The products obtained from each sample, at 40 and 50 cycles of PCR reaction, were loaded on a 3% agarose gel. M, molecular weight ladder, pUC Mix Marker 8 (Fermentas), (−), negative control.
cluster (mouse chromosome 7), both the𝛽-IVSI-6 transgene
and the 𝛽-like globin cluster are expressed as expected. It
should be underlined that the hematological parameters of the homozygous TG-𝛽-IVSI-6 mice are very similar to those of the wild-type mice. The only significant difference we found in TG-𝛽-IVSI-6 mice is the low/absent production
of one aberrantly spliced transcript (the 137 bp amplicon, as
shown inFigure 9). This might be explained by the fact that
this particular spliced form is much more sensitive to NMD
and so highly unstable (Table 5) [43, 44]. The issue of the
different ratios of the transcripts corresponding to the 115, 137, 153, and 165 bp amplicons in the cellular systems considered
(seeTable 4) should be discussed by taking in consideration
the hierarchy of splicing events associated with the differen-tial extent of complementarity with U1 and U6 small nuclear
RNAs (snRNAs), as suggested by Roca et al. (seeTable 5) [42].
Despite the low stability of transcripts generated by the −16 cryptic splicing site, the presence of the other two aberrantly spliced forms (corresponding to the 115 bp and
165 bp peaks shown inFigure 9(c)) allows us to propose that
the TG-𝛽-IVSI-6 mouse might be used as an in vivo model to characterize the effects of antisense oligodeoxynucleotides
(ODNs) and ODN-mimics targeting the −38 and the +13
cryptic GU donor splicing sites responsible for the generation
of aberrantly spliced human 𝛽-globin transcripts in
IVSI-6 𝛽-thalassemia. The validation of the effects of molecules
correcting the aberrant splicing caused by the IVSI-6 muta-tion can be performed in vitro using erythroid precursor cells isolated from these transgenic mice, as well as in vivo following administration of splicing correctors, as performed with different in vitro and in vivo experimental systems by
several research groups [45–50].
In this respect, ex vivo experiments based on the
cor-rection of splicing defects causing𝛽-thalassemia have been
reported by several research groups using antisense
phos-phorothioate 2-O-methyl-oligonucleotides [45, 46],
mor-pholino-oligonucleotides [18, 47], 2-O-(2-methoxy)
ethyl-oligonucleotides [47], and peptide nucleic acids [48]. These
antisense molecules have been used either free [45, 46]
or delivered with peptides and lipid-based strategies [49].
For instance, El-Beshlawy et al. [18] reported the ex vivo
correction of the aberrant splicing of IVSI-110𝛽-globin
pre-mRNA by antisense oligonucleotides (ASONs) against the 3
aberrant splicing site. In their study, ErPCs with the IVSI-110
mutation were treated with 20𝜇mol/mL morpholino ASONs
targeting the 3aberrant splicing site. The results of this work
suggested that ASONs can restore correct splicing of𝛽-globin
pre-mRNA, leading to correct gene product.
As far as in vivo experiments, few reports are available
[17,50] and none of them, to the best of our knowledge, are
focused on the repair of the aberrant splicing caused by the
𝛽-IVSI-6 mutation. For instance, Svasti et al. [17] reported the
repair of defective𝛽-globin pre-mRNA in a mouse model of
IVSII-654 thalassemia, by delivering a morpholino oligomer conjugated to an arginine-rich peptide as splice-switching oligonucleotide (SSO). Interestingly, the SSO blocked the aberrant splicing site in the targeted pre-mRNA and forced the splicing machinery to reselect existing correct splicing sites. These results suggest the applicability of ASONs for the treatment of thalassemia.
In this respect, it is worth noting that in most of third world countries, blood transfusion is of difficult application, due to the fact that availability of blood is low and blood is often contaminated. Therefore, novel pharmacological