Structure and atomic correlations in molecular systems probed
by XAS reverse Monte Carlo refinement
Andrea Di Cicco,1,a)Fabio Iesari,1Angela Trapananti,1Paola D’Angelo,2 and Adriano Filipponi3
1Physics Division, School of Science and Technology, Universit`a degli Studi di Camerino,
Via Madonna delle Carceri, I-62032 Camerino, MC, Italy
2Dipartimento di Chimica, Universit`a degli Studi di Roma “La Sapienza,” P.le Aldo Moro 5,
I-00185 Roma, Italy
3Dipartimento di Scienze Fisiche e Chimiche, Universit`a degli Studi dell’Aquila, Via Vetoio,
I-67100 L’Aquila, Italy
(Received 14 November 2017; accepted 16 February 2018; published online 6 March 2018) The Reverse Monte Carlo (RMC) algorithm for structure refinement has been applied to x-ray absorp-tion spectroscopy (XAS) multiple-edge data sets for six gas phase molecular systems (SnI2, CdI2, BBr3, GaI3, GeBr4, GeI4). Sets of thousands of molecular replicas were involved in the refinement process, driven by the XAS data and constrained by available electron diffraction results. The equi-librated configurations were analysed to determine the average tridimensional structure and obtain reliable bond and bond-angle distributions. Detectable deviations from Gaussian models were found in some cases. This work shows that a RMC refinement of XAS data is able to provide geometrical models for molecular structures compatible with present experimental evidence. The validation of this approach on simple molecular systems is particularly important in view of its possible simple extension to more complex and extended systems including metal-organic complexes, biomolecules, or nanocrystalline systems. Published by AIP Publishing.https://doi.org/10.1063/1.5013660
I. INTRODUCTION
X-ray absorption spectroscopy (XAS) is now a mature technique allowing accurate refinement of the structure of molecular and condensed systems. In gas-phase molecules, high signal to noise (S/N) ratio Extended X-ray Absorption Fine Structure (EXAFS) signals can be measured in a wide energy range,1often extended up to k = 20 �1wave-vector values, and the technique represents a structure investiga-tion tool complementary to standard electron diffracinvestiga-tion (ED) methods.2In fact, the availability of brilliant synchrotron radi-ation sources and improvements of data collection techniques facilitate the performance of accurate EXAFS experiments for different sample environments including gas-phase molecules in a wide temperature range.
Current strategies for the reconstruction of distance dis-tributions by EXAFS3,4 are usually based on a peak-fitting analysis5,6in which information is limited to average quantities like bond lengths and vibrational amplitudes, often assum-ing a Gaussian distribution of distances. These structural parameters are usually measured with high statistical accu-racy and can be directly compared with the corresponding results obtained by ED experiments. In particular, modern EXAFS data-analysis methods like GNXAS5–7 are based on multiple-scattering calculations of the structural x-ray absorp-tion signal associated with a given photoabsorbing atom and a distribution of distances determined by a limited set of
a)[email protected]. URL:http://gnxas.unicam.it/∼dicicco.
parameters. For Gaussian distributions and for a given atomic a-b pair, these are the number of neighbors Nab, the
aver-age bond distance Rab, and the variance σ2ab. This approach
is certainly justified for molecules and for ordered condensed matter. However, even in these cases, the problem of defining suitable model functions may be particularly severe. Gaussian shapes represent appropriate models in the harmonic approx-imation for the vibrational degrees of freedom, but deviations have been observed and studied even at moderate tempera-tures. Non-Gaussian model functions have been successfully applied to a variety of cases, but their extensive application to pair and higher-order distribution functions is particularly difficult.
The intrinsic limitations of the peak-fitting technique may be overcome by using model-independent methods in which the shapes of the distribution functions are not defined “a priori.” Strategies for reconstructing reliable pair distri-bution functions using EXAFS data have been devised in the past. A regularization scheme was proposed in the eight-ies8 to cope with the ill-posed inversion problem. A gen-eral approach to generate three-dimensional structural mod-els compatible with a given set of experimental data is the Reverse Monte Carlo (RMC).9,10 Application of the RMC method for XAS data-analysis was already suggested by Gur-man and McGreevy11 and several other studies have been published so far (see, for example, Refs. 12–20). In par-ticular, the RMC-GNXAS method is designed to apply the RMC algorithm simultaneously to diffraction and XAS data, allowing for the construction of a tridimensional model of the atomic system compatible with the observables under
consideration. The method can be applied to molecular and finite-size systems15 and was recently extended to multi-elemental cases.21
In this work, we have applied the Reverse Monte Carlo (RMC) structure refinement algorithm22to a set of gas phase spectra of simple poly-atomic molecules with up to five atoms (SnI2CdI2, GaI3, BBr3, GeI4, and GeBr4) using multiple-edge EXAFS data sets whenever possible. This approach has several advantages including
(1) direct reconstruction of the pair distribution possibly deviating from a simple Gaussian shape and access to bond-angle distributions and correlations;
(2) simultaneous structural refinements of multiple-edge EXAFS data possibly constrained by previous exper-imental information from ED experiments.
RMC refinements have been carried out using large ensembles of molecular replicas with the aim to reproduce EXAFS data under the available information of available ED structural data.
The paper is organized as follows: in Sec.II, we briefly describe the XAS experiments on gas-phase molecules under consideration, in Sec.III, we give details of the implementation of the molecular-replica RMC method, and in Sec. IV, the results obtained on different molecular symmetry families are reported. The conclusions are drawn in Sec.V.
II. XAS EXPERIMENTS ON GAS-PHASE MOLECULES
Samples suitable to collect gas phase x-ray absorption spectra of SnI2, CdI2, GaI3, BBr3, GeI4, and GeBr4molecules in transmission geometry were prepared starting from high purity 99.9% (or better) commercial products loaded in cylin-drical glass cells through a side capillary. All samples were handled in a glove bag under Ar atmosphere. For SnI2 and CdI2, 30 cm long quartz cells with sealed 1.5 mm thick flat end windows were used; BBr3 and GeBr4 were loaded in 25 cm long Pyrex cells with blown thinner windows with a suitable transmission at the Ge and/or Br K-edges. GaI3 and GeI4were loaded in 30 cm long Pyrex cells with flat 3 mm thick windows suitable for the I K-edge measurements. BBr3 and GeBr4(liquid at ambient temperature) were transferred from the vials to Pyrex bottles with Teflon taps and the residual inert atmosphere successively evacuated. The BBr3cell loading was performed by expanding the vapor pressure from the bottle into the previously evacuated Pyrex cell.1In the GeBr
4case, a drop of liquid was poured into the evacuated cell. All other samples were loaded in the glove bag as solid crystalline powders from the side capillary under Ar atmosphere and flame sealed after evacuation.
X-ray absorption spectroscopy measurements were per-formed at the BM29 spectrometer of the European Syn-chrotron Radiation Facility (ESRF) (now transferred to BM23) under typical conditions described in previous pub-lications.1,23The experimental setup was complemented by a tubular oven specifically designed for gas phase experiments [instrument designed and built by BCD Sistemi, Roma, Italy]. The system is a 80 cm long 4.5 cm inner diameter ceramic tubular oven with three independent heaters. It can operate up to about 1200 K and it guarantees a uniform temperature
±2 K in the 40 cm long inner region. The temperature con-troller is designed to eliminate any unwanted gradient in the furnace and to keep the temperature of three thermocouples stable within ±2 K from the set-point. The controller can be piloted through a serial interface from the beamline acquisition computer; therefore, the system is suitable for automatic tem-perature operation. The sample is loaded by sliding the cell in the center of the tubular cavity. The oven is mounted on a stage with 4 stepping motors for vertical and horizontal translations and tilt adjustments. Each cell is suitable for experiments in a relatively wide temperature range, limited to about 880 K for Pyrex cells, due to the glass softening.
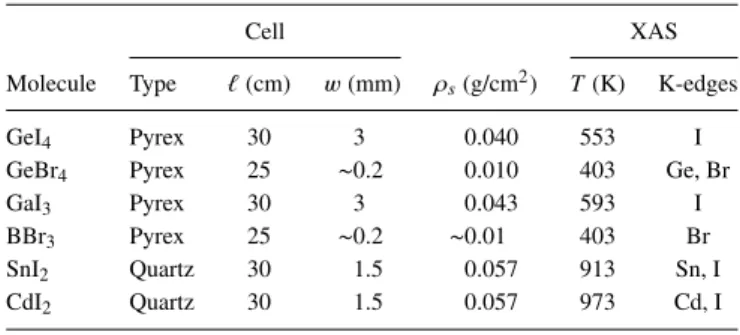
X-ray absorption spectra were collected in transmission mode using ion-chamber detectors filled with Ar (Ge, Br K-edge spectra) or Kr (Cd, Sn, I K-K-edge) gas, depending on the photon energy. The lowest possible measurement tem-perature is determined by the requirement of the complete vaporization of the specimen. In order to assess these tem-peratures, fast x-ray absorption scans at the corresponding K-edge have been performed while the sample was gradually heated above room temperature. Above the sample melting point, the K-edge absorption jump is observed to increase with the sample vapor pressure. In this liquid-vapor coex-istence range, measurements can in principle be taken but would require a temperature stability to better than 0.01 K due to the strong temperature dependence of the vapor pressure. Upon achievement of the complete specimen vaporization, the observed K-edge absorption jump stabilizes to a con-stant value even in the presence of temperature fluctuations and this condition establishes the lowest possible measure-ment temperature. The maximum measuremeasure-ment temperature is often limited by molecular dissociation. Details on samples and measurements considered in the present work are listed in TableI.
Multiple scans were performed for each edge and each sample to ensure reproducibility and the analysis was per-formed on the averaged data. The spectra were collected on an optimized energy mesh with a typical number of points of the order of 103(5 eV spacing in the pre-edge region, 0.3 eV spacing near the edge, and equally spaced Δk � 0.02 Å�1 sam-pling in k-space in the EXAFS region) and a typical acquisition time of 2 s/point. All of the spectra resulted to be of extremely high quality (S/N ratio ≥ 104) confirming the suitability of the EXAFS technique for structural investigation of gas-phase systems.
TABLE I. List of molecular species, cell materials, length � and window thickness w, sample surface density ρs, and measurements temperature T and edges, considered in the present work.
Cell XAS
Molecule Type �(cm) w(mm) ρs(g/cm2) T(K) K-edges
GeI4 Pyrex 30 3 0.040 553 I
GeBr4 Pyrex 25 ∼0.2 0.010 403 Ge, Br
GaI3 Pyrex 30 3 0.043 593 I
BBr3 Pyrex 25 ∼0.2 ∼0.01 403 Br
SnI2 Quartz 30 1.5 0.057 913 Sn, I
III. IMPLEMENTATION OF THE MOLECULAR REPLICA METHOD
Reverse Monte Carlo is a data analysis approach based on molecular modeling9,10 for producing three-dimensional structural models constrained to have the best agreement with the available experimental data. The method implements a driven random walk in the configuration space based on the agreement of a simulated structure with a set of experimen-tal data within their uncertainties, according to the Metropolis Monte Carlo (MMC) algorithm.
Very few assumptions on the initial structure are required and interatomic potentials are not used for RMC model-ing. One of the main advantages of the RMC approach is that experimental data from techniques having complemen-tary sensitivity to different elements and lengthscales can be simultaneously included to constrain the refined structure. The outcome is a set of three-dimensional structural models for the investigated system on which a full statistical analysis can be performed to derive the pair distribution functions, the distri-bution of bond angles, and to identify specific local atomic arrangements.
Although initially introduced to obtain structural models compatible with the structure factor from x-ray and neutron scattering experiments, the method is very general and finds application with any experimental technique for which the measured signal can be calculated from the atomic coordi-nates. The application of RMC for XAS data-analysis was already described by Gurman and McGreevy11and it has now been extended to several investigations of liquids, glasses, and crystalline systems.
We recently upgraded the rmc-gnxas15program, which is now able to refine multiple component systems using partial pair distribution functions and multiple edges EXAFS signals simultaneously.21 For the calculation of the EXAFS signals, the phase shifts are calculated ab initio for a system having structure and chemical composition similar to the system mod-eled by RMC. Two body γab(k) signals for given atomic a–b
pairs are then calculated for a grid of bond distances and given as an input to the RMC program. The signals are then interpo-lated for all the actual distances present in the model structure with a damping factor due to experimental resolution and many body effects.
The EXAFS wavevector scale is defined as k = �2me(E − EE)/�2, where me is the electron mass and EE
is the edge inflection point of the experimental spectrum. This “empirical” scale is used for the representation of the EXAFS data in the following figures. The theoretical model spectrum has an energy scale referred to a zero potential energy refer-ence at infinite distance and its position in the photon energy scale is a fitting parameter, referred to as E0, correlated with the distance parameter. The energy differences E0� EE
result-ing from the pre-analysis of the EXAFS signals will be quoted for completeness in the specific subsequent analyses.
In the case of finite-size systems like molecules, the start-ing configuration is composed of a given set of replicas of the same molecule, with atoms randomly displaced from the equilibrium position. During the refinement process each atom of each molecule is moved separately. The quantities to be
compared with their experimental counterparts are calculated for each molecule and averaged over all the replicas. For systems containing a finite number of atoms, the atomic num-ber density functions n(r) (for which the integral is directly the coordination number) are the appropriate quantities to represent radial atomic distributions [the radial distribution function g(r) is not a useful concept]. In Fig. 1, we report the flow diagram of the rmc-gnxas software when dealing with finite-size systems. Conceptually, the molecular replica method can be applied to any collection of finite-size sys-tems whenever the long-range order is absent or not relevant for the prediction of the experimental signal and therefore there is no need to match a given total atomic density. The rmc-gnxas code calculates both the average EXAFS γab(k)
signals and the partial nab(r) and total n(r) density functions
of the molecular system. These quantities are used to calculate a matching function on the corresponding available experi-mental signals. In the presence of different atomic species, EXAFS signals from different atomic edges (for example, Ge K-edge and Br K-edge) can be simultaneously considered. While the EXAFS signal is highly sensitive to the details of
FIG. 1. Flow diagram of the rmc-gnxas code for the application to finite size systems (molecules). A set of N molecular replicas, composed by a lim-ited number of atoms, is introduced in the typical RMC loop. Constraints on the shortest and longest allowed distances can be introduced. The program cal-culates the EXAFS signal for each atomic edge under consideration as well as the partial nab(r) and total n(r) number density distributions to be compared with experimental ones measured for example by Electron Diffraction.
the first-neighbor distribution and short-range distances, it is not sufficient to avoid, in some cases, molecular dissociation or unphysical interatomic distances. It should be mentioned that hybrid RMC approaches, integrating empirical potentials into the RMC structural modeling, have been devised to pre-serve realistic molecular coordination and geometries. Those methods (see Ref.24and references therein) are particularly useful for complex molecules and molecular liquids. In the present case, we included cutoff ranges for the interatomic distances, but the most important element was a soft con-straint including previous information on the number density functions obtained from electron diffraction experiments. In alternative n(r) constraints from realistic molecular dynam-ics (MD) or Monte Carlo (MC) computer simulations can be used.
When both EXAFS and number density distribution data are available, the χ2function at each RMC step is given by
χ2= NE � n=1 N�XAS i=1 � χEn(ki) − χCn(ki)�2 σ2n,i +� a,b Nn � j=1 � nE ab(rj) − nCab(rj) �2 σ2ab,j , (1)
where in the first term on the r.h.s., for each edge n under con-sideration, χC(k) is calculated by the program using the γ(2)(k) signals produced by GNXAS corresponding to the RMC model atomic coordinates, χE is the experimental EXAFS
signal determined by a preliminary data-analysis, and σ2 i is
the noise function obtained from the experiment. In the sec-ond term, nC(r) is the number density distribution associated
with the atomic coordinates of the RMC box, whereas nE(r) is
a number density distribution obtained, for example, by elec-tron diffraction or by computer simulations, and σ2
j is the noise
associated with the number density distributions. In the present application, the second term in Eq.(1)has the role of a soft constraint to preserve molecular integrity and avoid unphysi-cal distances and the σ2
j represents the inverse weight of the
term in the χ2. There is a wide range of σ2
j values useful for
this purpose and we adopted a constant value in such a way that the weights of the XAFS signals and of the n(r) were approximately equivalent. The sums in Eq.(1)are extended to the number of XAS edges (NE) and partial (or only total)
number distribution functions nab(r) available and to the
num-ber of EXAFS experimental NXASand number distribution Nn
points.
As a final remark, the molecular replica method results to be very efficient from a computational point of view allowing the performance of RMC refinements of small-sized molecules with typical timing that are one order of magnitude smaller than those of condensed systems using a box of thousands of atoms with periodic boundary conditions.
IV. RESULTS
A. Triatomic molecules: SnI2and CdI2
Two prototype triatomic molecular systems, namely, SnI2 (C2v) and CdI2 (D∞h), have been considered for a first
application of the EXAFS RMC refinement procedure described in Sec. III. For these molecules, previous struc-tural data are available by electron diffraction experiments as described in Refs.25and26for SnI2(T = 600 K cell jet temper-ature) and CdI2(T = 678 K nozzle temperature), respectively. X-ray absorption experiments, described in Sec.II, have been pre-analyzed using the GNXAS suite of programs5–7in order to extract the EXAFS structural signals at the Sn and I K-edges and at the Cd and I K-K-edges for the two SnI2and CdI2, respectively. The multiple scattering contributions associated with the collinear I–Cd–I configurations were calculated and they were found to have a negligible amplitude also due to the large thermal disorder associated with the high tempera-ture of the measurements (973 K). As an example, we show in Fig.2the experimental EXAFS signals k2χ(k) of SnI
2 at T = 913 K as a function of the photoelectron wave-vector k. Background functions including contributions from multi-electron excitations, normalization, and other non-structural parameters resulting from the pre-analysis were kept fixed in the subsequent rmc-gnxas refinements. For CdI2, the dif-ference E0� EEresulted to be 7.1 eV (Cd K-edge) and 4.9 eV
(I K-edge). For SnI2, E0� EEwere 9.4 eV and 5.6 eV for the
Sn and I K-edge, respectively.
RMC refinements were carried out by using a set of 3000 molecular replicas (total of 9000 atoms) for the two molecules under considerations. Both EXAFS experimental signals and number density distributions n(r) obtained by ED were taken into account in the RMC refinement. The model number density distributions for the two molecules are shown in Fig.3 (dotted lines). They have been obtained using the average bondlengths and vibrational amplitudes (for Sn–I, Cd–I, and I–I) measured by ED experiments25,26 and reported as mean interatomic distances R and variances σ2 in Table II. In the RMC refinement process, EXAFS data provide a strong constraint to the nearest-neighbor dis-tribution, while ED further constraints the second-neighbor distances.
FIG. 2. Double-edge RMC refinement of the Sn (left) and I (right) K-edge EXAFS spectra of the SnI2gas-phase system (temperature T = 913 K). The calculated two-atom EXAFS signals resulting from a set of molecular config-uration (green lines) are compared with the corresponding experimental data (blue lines). The residual curves are shown in red (bottom).
FIG. 3. Number density distribution functions n(r) resulting from the RMC refinement of the XAS signals of the gas-phase molecules under considera-tion, compared with the corresponding functions reconstructed from electron diffraction (ED) structural parameters (dotted lines; see TableII). In some cases, the agreement is remarkably good (BBr3, GaI3, and GeBr4), while for SnI2, CdI2, and GeI4several differences in the width and shape of the first-neighbor and second-neighbor peaks are found.
The strategy for RMC refinements was the following: (1) only the n(r) functions were used to obtain a structural model (ensemble of 3000 molecules) in agreement with ED results. Equilibration was obtained after about 100 RMC moves (about 300 000 atom moves). (2) An equilibrated atomic configura-tion resulting from step 1 was used as a starting model for a combined RMC refinement procedure using both multiple-edge EXAFS data and the n(r) functions. The total number of points were 1489 (CdI2), 1153 (SnI2), and 300 for the EXAFS and number density distribution, respectively. (3) RMC refine-ments of combined multiple-edge EXAFS data and ED n(r)s were carried out and found to converge after about 300 RMC moves. A set of 50 equilibrated configurations were considered for the average structure.
The above-mentioned strategy is similar to what has been done previously for condensed matter, for example, liquid Cu, Sn, and Ni apart for the usage of n(r) in place of g(r).
The results are shown in Figs.2–4. In Fig.2, we show as an example the double-edge RMC refinement of the Sn (left) and I (right) K-edge EXAFS spectra of the SnI2
gas-phase system. The quality of the refinement is quite impressive, and clearly the EXAFS signals are dominated by the nearest-neighbor contributions Sn–I, I–Sn. The I–I signal cannot be detected with sufficient accuracy and this justifies a posteriori the use of the ED number density distribution model as a further constraint. The same situation holds for the CdI2gas-phase system.
The RMC simulation provides an ensemble of molecu-lar structures, compatible with experimental data, which is available for further statistical analysis. In Fig.3, we compare the number density distributions corresponding to the equili-brated configurations in SnI2 and CdI2 with the model func-tions obtained by ED experiments. The substantial agreement between the two curves confirms the compatibility between the available experimental data. The information contained in the present EXAFS data provides more reliable peak shapes. The difference in the width of the Sn–I, Cd–I, and I–I peaks reflects the temperature difference (around 300 K) of the mea-surements (see TableII) that were carried out under differ-ent experimdiffer-ental conditions and spectroscopic methods. The shape of the number density distributions slightly departs from a simple Gaussian function and this can be appreciated for both Sn–I, Cd–I peaks (measured with high accuracy) and for the I–I one (measured with lower accuracy).
We have calculated and reported in TableIIthe structural parameters (average distance R, variance σ2, dimensionless skewness β, and excess kurtosis τ� 3) of each number den-sity distribution peak, in order to compare directly present data with previous ED results. All of the configurations from the simulation including up to three times the peak width were considered to evaluate the above parameters thus accounting for the true distributions of the simulations. It can be noted that while the first-neighbor distribution can be considered practically Gaussian (negligible skewness and kurtosis), the I–I second-neighbor distribution is found to be asymmetric (negative skewness) as can also be seen in Fig.3considering the shape of the I–I peaks (around 4.25 Å and 5.1 Å for SnI2 and CdI2). The angle distributions (see Fig.4) are relatively broad with a typical angle standard deviation around 10◦. It should be remarked that CdI2 represents an extremal case of a quasi-linear molecule where the probability of an exactly linear configuration vanishes for solid angle element effects. Thermal vibrations favor bent configurations for which the I–I bondlength is always smaller than the one for the linear equilibrium configuration. This is known as “foreshortening” effect in the analysis of ED data. The angle distribution can be mistaken by (or interpreted as) the one corresponding to an average bent angle with fluctuations. The parameters reported in Table IIactually refer to such an analysis. A model dis-tribution which generalizes the Gaussian model and accounts for the solid angle element effects, used in the peak fitting EXAFS analysis, was discussed in Ref.6. The structure of the SnI2 molecule was previously determined by gas-phase ED,25 and while the bond distances are quite reliable from experiments, the bond angles are more reliable from com-putations.31 The coordination chemistry of d10s2 metal ions is strongly affected by filled or partially filled metal(ns)-ligand(np) antibonding orbitals that may form large voids in the coordination sphere with donor ligands such as iodine.
TABLE II. Average interatomic distances (Rab, Rbb, a = Sn, Cd, B, Ga, Ge, b = Br, I) and corresponding variances (σab2, σbb2) for the set of molecular systems (abn) under consideration measured by EXAFS at given temperatures (SnI2, CdI2, BBr3, GaI3, GeBr4, and GeI4, from top to bottom), as obtained by the equilibrium configurations of the RMC refinement procedure. The dimensionless skewness (βab, βbb) and excess kurtosis (τab� 3, τbb� 3) parameters of each distance distribution are also reported. Structural parameters are compared with corresponding values obtained by electron diffraction (ED) as reported in previous publications (average bondlengths and vibrational amplitudes). Results of a previous GNXAS analysis of EXAFS data are also reported. Temperatures of each measurement are reported in Kelvin. Parameters of the bond-angle distributions (angle �bab) for each RMC refinement of the molecules are also reported, including mean angle (θ) and its standard deviation (σθ) as well as bond-bond and bond-angle dimensionless correlations (ρRR, ρR θ). Estimated statistical error bars on the last significant digits are indicated in brackets for each parameter.
SnI2 RSnI(Å) σSnI2 (10−3Å2) βSnI τSnI� 3 RII(Å) σII2(10−3Å
2
) βII τII� 3
This work (913 K) 2.699(1) 9.9(1) �0.03(2) 0.0(1) 4.249(2) 73(3) �0.37(2) �0.3(2)
ED25(600 K) 2.706(4) 5.2(2) . . . . . . 4.26(2) 40 (6) . . . . . .
Angle distr. θ(deg) σθ(deg) ρRR ρR θ
This work (913 K) 104.3(2) 9.5(2) �0.05(3) �0.11(1)
CdI2 RCdI(Å) σCdI2 (10−3Å2) βCdI τCdI� 3 RII(Å) σII2(10−3Å2) βII τII� 3
This work (973 K) 2.574(1) 8.5(1) 0.05(1) 0.1(1) 5.099(1) 19.4(4) �0.17(4) 0.5(2)
ED26(678 K) 2.582(5) 5.6(3) . . . . . . 5.108(11) 14(1) . . . . . .
Angle distr. θ(deg) σθ(deg) ρRR ρR θ
This work (973 K) 164.2(2) 8.2(1) �0.23(1) �0.06(1)
BBr3 RBBr(Å) σBBr2 (10−3Å2) βBBr τBBr� 3 RBrBr(Å) σBrBr2 (10−3Å2) βBrBr τBrBr� 3
This work (403 K) 1.894(1) 2.1(1) �0.17(2) �0.2(1) 3.279(1) 5.1(1) �0.17(2) 0.0(1)
GNXAS1(403 K) 1.895(1) 2.4(2) . . . . . . 3.284(2) 5.4(3) . . . . . .
ED27(294 K) 1.900(4) 2.2(5) . . . . . . 3.285(6) 5.6(2) . . . . . .
Angle distr. θ(deg) σθ(deg) ρRR ρR θ
This work (403 K) 119.7(1) 4.7(1) �0.15(2) �0.18(1)
GaI3 RGaI(Å) σGaI2 (10−3Å
2 ) βGaI τGaI� 3 RII(Å) σII2(10−3Å 2 ) βII τII� 3 This work (593 K) 2.457(1) 5.0(1) 0.01(3) 0.3(1) 4.233(2) 33.8(4) �0.35(3) 0.1(1) ED28(528 K) 2.458(5) 4.5(5) . . . . . . 4.256(18) 26.6(2.0) . . . . . .
Angle distr. θ(deg) σθ(deg) ρRR ρR θ
This work (593 K) 119.4(2) 7.6(3) �0.07(2) �0.12(2)
GeBr4 RGeBr(Å) σGeBr2 (10−3Å
2 ) βGeBr τGeBr� 3 RBrBr(Å) σBrBr2 (10−3Å 2 ) βBrBr τBrBr� 3 This work (403 K) 2.274(1) 2.8(1) �0.01(3) 0.0(1) 3.704(1) 20.7(2) �0.50(2) 0.3(1) ED29(393 K) 2.272(1) 2.8(1) . . . . . . 3.705(2) 17.2(8) . . . . . .
Angle distr. θ(deg) σθ(deg) ρRR ρR θ
This work (403 K) 109.1(1) 7.1(1) �0.09(2) �0.17(1)
GeI4 RGeI(Å) σGeI2 (10−3Å
2) βGeI τGeI� 3 RII(Å) σII2(10−3Å 2) βII τII� 3 This work (553 K) 2.506(1) 5.1(1) 0.09(2) 0.1(1) 4.085(1) 34.0(4) �0.19(3) 0.7(1) ED30(350 K) 2.515(1) 3.2(2) . . . . . . 4.093(9) 22.2(1.2) . . . . . .
Angle distr. θ(deg) σθ(deg) ρRR ρR θ
This work (553 K) 109.3(1) 8.6(1) �0.08(2) �0.15(1)
This effect gives rise to a I–Sn–I bond angle of about 104◦and this peculiar structure has been correctly determined by our analysis.
B. Four-atom molecules: GaI3and BBr3
We have analyzed the two four-atom molecules (D3h sym-metry) under consideration using the same strategy described in Sec.IV A. Structural data have been previously obtained by electron diffraction experiments for GaI328 (T = 528 K
nozzle temperature) and for BBr327 (T = 294 K nozzle temperature). X-ray absorption experiments, described in Sec.II, have been pre-analyzed in order to extract the EXAFS structural signals at the I and Br K-edge for GaI3 and BBr3. In Fig.5, the experimental I K-edge EXAFS signal k χ(k) of GaI3at T = 593 K is reported (Expt) as a function of the photo-electron wave-vector k. Again, background functions includ-ing contributions from multi-electron excitations, normaliza-tion, and other non-structural parameters resulting from the pre-analysis were kept fixed in the subsequent rmc-gnxas
FIG. 4. Bond-angle distribution functions resulting from the RMC refinement of the XAS signals of the gas-phase molecules under consideration.
refinements. In particular, for GaI2 the E0 � EE energy
dif-ference resulted to be 3.4 eV (I K-edge) while for BBr3 we obtained 4.4 eV (Br K-edge).
RMC refinements were carried out by using a set of 2000 molecular replica (total of 8000 atoms) for the two molecules. Both EXAFS experimental signals and number density distributions n(r) (shown in Fig. 3as dotted lines) obtained by ED were taken into account in the RMC approach, in successive refinements as discussed above.
Total number of points for RMC were NXAS= 704 (GaI3),
NXAS = 640 (BBr3), Nn= 300 and equilibration was reached
after only 50 moves, starting from structural models compati-ble with ED data. Sets of 50 equilibrated configurations were considered for the average structure.
Results are shown in Figs.3–5. In Fig. 5, we show the XAS RMC refinement of the I K-edge EXAFS spectrum of the GaI3gas-phase system. The refinement is practically perfect and the residual is totally flat. As expected, the EXAFS signal is dominated by the nearest-neighbor contributions I–Ga but a weak I–I signal can be appreciated and gives a detectable contribution to the calculated spectrum in the 3–8 Å�1 wave-vector range. The refinement of the Br K-edge spectrum of gaseous BBr3is also of very high quality, similar to what shown in Ref.1using GNXAS.
FIG. 5. RMC refinement of the I K-edge EXAFS spectrum of the GaI3 gas-phase system (temperature T = 593 K). The calculated two-atom I–Ga and I–I EXAFS signals, resulting from a set of molecular configurations (green lines), are compared with the experimental data (blue line). The three-body (γ3) I–Ga–I triplet contribution is also shown (dotted). The residual curve is shown in red (bottom).
In Fig. 3, we compare the number density distributions corresponding to the equilibrated configurations in GaI3 and BBr3 with the model functions obtained by ED experiments (average bondlengths and vibrational amplitudes reported in Refs. 27 and28; see Table II). In this case, the agreement between those two curves is really good both for what concerns the positions and widths of the Br–B and Br–Br distributions. In fact, the temperatures of the XAS and ED measurements were in the same range (see TableII), so a close agreement among the n(r) curves is expected. The peaks of the num-ber density distributions show some side extra-contributions slightly departing from a simple Gaussian shape.
The structural parameters reported in Table II show a close agreement with previous determinations obtained by ED experiments and GNXAS analysis, which coincide with the present results within the estimated statistical errors. The slight deviations from the Gaussian shape are highlighted by the small skewness and kurtosis values. Skewness is confirmed to be slightly negative for the second-neighbor distribution. The angle distributions (see Fig.4) are quite symmetric and cen-tered around a mean value of about 120◦with a typical angle standard deviation of about 4.7◦ and 7.6◦for BBr3 and GaI3 (see TableII), respectively, in line with the different thermal vibrational contribution.
C. 5-atom molecules: GeBr4and GeI4
The RMC-XAS refinement has been finally applied to a couple of (Td symmetry) five-atom molecules such as GeBr4 and GeI4, using the same methods reported in Sec.IV A. Struc-tural ED data on GeBr429(T = 393 K) and GeI430(T = 350 K) are available. X-ray absorption experiments, described in Sec.II, have been pre-analyzed in order to extract the EXAFS structural signals at the Ge, Br, and I K-edge of GeBr4 and
FIG. 6. Double-edge RMC refinement of the Ge (left) and Br (right) K-edge EXAFS spectra of the GeBr4gas-phase system (temperature T = 403 K). The calculated two-atom EXAFS signals resulting from a set of molecular config-urations (green lines) are compared with the corresponding experimental data (blue lines). The weak three-body (γ3) signals associated with the Br–Ge–Br triplet configurations are also shown. The residual curves are shown in red (bottom).
GeI4. In Fig.6, the experimental Ge and Br K-edge EXAFS signals k χ(k) of GeBr4at T = 403 K are reported (Expt). Also in the present case background functions including contribu-tions from multi-electron excitacontribu-tions, normalization, and other non-structural parameters resulting from the pre-analysis were kept fixed in the subsequent rmc-gnxas refinements. In par-ticular, for GeBr4 and GeI4, the E0 � EE energy difference
resulted to be 6.6 eV, 8.5, and 5.8 eV for Ge, Br, and I K-edges, respectively.
The RMC refinements were carried out by using a set of 2000 molecular replica (total of 10 000 atoms) for the two molecules. Also for those molecules, both EXAFS exper-imental signals and ED-based number density distributions n(r), shown as dotted lines in Fig.3, were taken into account. The ED-based n(r) functions were obtained using the average bondlengths and vibrational amplitudes reported in Refs.29
and30; see TableII.
Total number of points for RMC were NXAS= 743 (GeI4),
NXAS= 1689 (GeBr4), Nn= 300 and equilibration was reached
after about 50 moves, starting from structural models compat-ible with ED data. Sets of 50 equilibrated configurations were considered for the average structure.
The results are shown in Figs.3,4, and6. In Fig.6, we show the XAS RMC refinement of the Ge and Br K-edge EXAFS spectra related to the GeBr4 gas-phase system. The refinement is excellent at both edges and the residual is almost flat. The EXAFS signal is dominated by the Ge–Br nearest-neighbor contributions but a detectable Br–Br signal is found to give a visible contribution to the calculated spectrum up to about 11 Å�1 wave-vector k values. The same holds for the I K-edge spectrum of gaseous GeI4 (not shown), for which a detectable I–I contribution is also important for the RMC refinement process.
In Fig. 3, we compare the number density distributions corresponding to the equilibrated configurations in GeI4 and GeBr4with the model functions obtained by ED experiments.
The agreement is generally good for what concerns the posi-tions of the Ge–I (Ge–Br) and Br–Br (I–I) distribution peaks. The larger width of the peaks for GeI4clearly reflects the higher temperature (see Table II) of the XAS measurements. The Br–Br (∼3.7 Å) and I–I (∼4.1 Å) peaks of the number den-sity distributions show visible extra-contributions at shorter distances indicating slight departures from a simple tetrahedral structure.
The structural parameters reported in Table II show a close agreement with previous ED determinations. The first-neighbor distribution is found to be essentially Gaussian, while the negative skewness of the second-neighbor (Br–Br, I–I) dis-tributions reflects the side lobes of the n(r)s shown in Fig.3
for GeI4 and GeBr4. The angle distributions (see Fig.4) are obviously centered around the mean tetrahedral value of about 109◦with angle standard deviations of about 7.1◦and 8.6◦for GeBr4and GeI4(see TableII), respectively. Slightly negative bond angles ρRθand bond-bond ρRRcorrelations are obtained
like in the BBr3case. The angle distributions shown in Fig.4 are not symmetric and show a visible contribution at smaller bond-angle values (toward 90◦) that is related to the occur-rence of shorter Br–Br and I–I distances found in the number density distribution.
V. CONCLUSIONS
The RMC refinement process allowed us to analyze the tridimensional structure of simple poly-atomic molecules by using sets of thousands of molecular replicas, for which the calculated EXAFS signals are found compatible with mea-sured experimental spectra, and electron diffraction data were used as a further structural constraint. We show that reliable bond and bond-angle distribution functions can be obtained and that detectable deviations from Gaussian distributions are found. This work shows that XAS, combined with RMC refine-ment, is able to provide geometrical models for the molecular structure compatible with present experimental evidence. The validation of this approach on simple molecular systems is especially important in view of its possible simple extension to more complex and extended systems including biomolecules and nanocrystallites.
1A. Filipponi and P. D’Angelo,J. Chem. Phys.109, 5356 (1998). 2Stereochemical Applications of Gas-Phase Electron Diffraction, edited by
L. Hargittai and M. Hargittai (Wiley, 1988).
3Contributors, in X-Ray Absorption: Principles, Applications, Techniques of
EXAFS, SEXAFS, and XANES, Chemical Analysis: A Series of Monographs on Analytical Chemistry and Its Applications, edited by D. C. Koningsberger and R. Prins (Wiley and Sons, New York, 1988), Vol. 92.
4J. J. Rehr and R. C. Albers,Rev. Mod. Phys.72, 621 (2000).
5A. Filipponi, A. Di Cicco, and C. R. Natoli,Phys. Rev. B 52, 15122 (1995).
6A. Filipponi and A. Di Cicco,Phys. Rev. B52, 15135 (1995).
7GNXAS Extended Suite of Programs for Advanced X-Ray Absorption
Data-Analysis: Methodology and Practice, edited by A. Di Cicco (TASK Publishing, Gdansk, Poland, 2009).
8Y. A. Babanov, V. V. Vasin, A. L. Ageev, and N. V. Ershov,Phys. Status Solidi105, 747 (1981).
9R. L. McGreevy and L. Pusztai,Mol. Simul.1, 359 (1988). 10R. L. McGreevy,J. Phys.: Condens. Matter13, R877 (2001).
11S. J. Gurman and R. L. McGreevy,J. Phys.: Condens. Matter2, 9463 (1990).
12Y. Wang, K. Lu, and C. Li,Phys. Rev. Lett.79, 3664 (1997). 13M. Winterer,J. Appl. Phys.88, 5635 (2000).
14A. Di Cicco, A. Trapananti, S. Faggioni, and A. Filipponi,Phys. Rev. Lett. 91, 135505 (2003).
15A. Di Cicco and A. Trapananti,J. Phys.: Condens. Matter17, S135 (2005). 16A. Di Cicco, A. Trapananti, E. Principi, S. De Panfilis, and A. Filipponi,
Appl. Phys. Lett.89, 221912 (2006).
17W. Luo and E. Ma,J. Non-Cryst. Solids354, 945 (2008).
18J. Timoshenko, A. Kuzmin, and J. Purans,Comput. Phys. Commun.183, 1237 (2012).
19K. Fujikawa, H. Ariga, S. Takakusagi, H. Uehara, T. Ohba, and K. Asakura, e-J. Surf. Sci. Nanotechnol.12, 322 (2014).
20A. Di Cicco, F. Iesari, S. De Panfilis, M. Celino, S. Giusepponi, and A. Filipponi,Phys. Rev. B89, 060102 (2014).
21F. Iesari, K. Hatada, A. Trapananti, M. Minicucci, and A. Di Cicco, in
Multi-ple Scattering Theory for Spectroscopies, Springer Proceedings in Physics, edited by D. S´ebilleau, K. Hatada, and H. Ebert (Springer International Publishing, 2018), Vol. 204, pp. 233–269.
22R. McGreevy, M. A. Howe, D. Keen, and K. N. Clausen, Neutron Scattering
Data Analysis, Inst. Phys. Conf. Series Vol. 107, edited by M. W. Johnson (Bristol: Institute of Physics, 1990), pp. 165–184.
23A. Filipponi, M. Borowski, D. T. Bowron, S. Ansell, A. Di Cicco, S. De Panfilis, and J.-P. Iti´e, Rev. Sci. Instrum. 71, 2422 (2000).
24O. Gereben and L. Pusztai,J. Comput. Chem.33, 2285 (2012).
25A. V. Demidov, A. G. Gershikov, E. Z. Zasorin, V. P. Spiridonov, and A. A. Ivanov,J. Struct. Chem.24, 7–11 (1983) [Zh. Strukt. Khim. 24, 9 (1983) (in Russian)].
26N. Vogt, M. Hargittai, M. Kolonits, and I. Hargittai,Chem. Phys. Lett.199, 441 (1992).
27K.-G. Martinsen, N. Vogt, H. V. Volden, V. S. Lyutsarev, and J. Vogt,J. Mol. Struct.385, 159 (1996).
28Y. Morino, T. Ukaji, and T. Ito, Bull. Chem. Soc. Jpn. 39, 71 (1966).
29G. Souza and J. Wieser,J. Mol. Struct.25, 442 (1975).
30N. Giricheva, G. Girichev, S. Shlykov, V. Titov, and T. Chusova, J. Struct. Chem.29, 207–210 (1986) [Zh. Strukt. Khim. 29, 50 (1986) (in Russian)].
31Z. Neizer, Z. Varga, G. Jancs´o, and M. Hargittai,Struct. Chem.18, 641 (2007).