Preprint: Please note that this article has not completed peer review.
Angiotensin AT1 and AT2 receptors heteromer
expression in microglia correlates with Parkinson’s
disease progression in the hemilesioned rat model of
the disease
CURRENT STATUS:
UNDER REVIEW Rafael Rivas-Santisteban Universitat de Barcelona [email protected] Author ORCiD: https://orcid.org/0000-0002-2078-6819 Ana I. Rodriguez-Perez Universidade de Santiago de Compostela Ana Muñoz Universidade de Santiago de Compostela Irene Reyes-Resina Universitat de Barcelona José Luis Labandeira-García Universidade de Santiago de Compostela Gemma Navarro Universitat de Barcelona Rafael Franco Universitat de BarcelonaDOI:
10.21203/rs.3.rs-18527/v1SUBJECT AREAS
Neurobiology of DiseaseKEYWORDS
Neuroinflammation, heteromer, G-protein-coupled receptor (GPCR), dyskinesia,
levodopa
Abstract
Background/Aims : The renin-angiotensin system (RAS) is altered in Parkinson’s disease (PD), a disease due to substantia nigra neurodegeneration and whose dopamine-replacement therapy, using the precursor levodopa, leads to dyskinesias as the main side effect. Angiotensin AT 1 and AT 2 receptors, mainly known for their role in regulating water homeostasis and blood pressure and able to form heterodimers (AT 1/2 Hets), are present in the central nervous system. We assessed the functionality and expression of AT 1/2 Hets in Parkinson Disease (PD). Methods: Immunocytochemistry was used to analyze the colocalization between angiotensin receptors, bioluminescence resonance energy transfer was used to detect AT 1/2 Hets. Calcium and cAMP determination, MAPK activation and label-free assays were performed to characterize signaling. Proximity ligation assays was used to quantify receptor expression in microglial cells and brain striatal slices. Results: We confirmed that AT 1 and AT 2 receptors form AT 1/2 Hets that are expressed in cells of the central nervous system. AT 1/2 Hets are novel functional units with particular signaling properties. Importantly, the coactivation of the two receptors in the heteromer reduces the signaling output of angiotensin. Remarkably, AT 1/2 Hets that are expressed in both striatal neurons and microglia show a cross-potentiation, i.e. candesartan, the antagonist of AT 1 increases the effect of AT 2 receptor agonists. In addition, the level of expression in the unilateral 6-OH-dopamine lesion rat PD model increases upon disease progression and is maximal in dyskinetic animals. Conclusion: The results indicate that boosting the action of neuroprotective AT 2 receptors using an AT 1 receptor antagonist constitutes a promising therapeutic strategy in PD.Introduction
The renin/angiotensin system (RAS) is composed of enzymes that produce angiotensin (Ang) peptides and of cell surface receptors that convey cytocrin signals to achieve specific cell responses. There aretwo angiotensin receptors (AT1R and AT2R) that belong to the superfamily of G-protein-coupled
arterial blood pressure. However, different laboratories have provided solid evidence on the relevant role of RAS in the central nervous system (CNS). Ang is an important regulator of motor control, and AT1R and AT2R have been suggested as targets to combat Parkinson’s disease (PD) and related conditions such as levodopa (L-DOPA)-induced dyskinesias [1, 2]. Age is a main risk factor for sporadic PD, which is characterized by dysregulation of the dopaminergic function due to the death of dopaminergic neurons of the substantia nigra (SN). A local RAS has been reported in the SN [3, 4], in which overactivity of AT1R correlates with aging-related alterations, neuronal death [5, 6] and neuroinflammation [7, 8]. Microglial cells are the main mediators of neuroinflammation and despite once activated they are considered as detrimental, it is now known that they may undertake the pro-inflammatory (M1) or the neuroprotective (M2) phenotype. The search for pharmacological tools targeting GPCR to convert M1 into M2 phenotype is an active field of research [9]. The role of AT2R and the interplay between the two receptors in the above-mentioned changes due to Ang action in the aged or in the pathological brain is still unclear.
The cognate proteins for coupling to AT1R and AT2R are, respectively, Gq (also Gi) and Gi.
Accordingly, agonists of AT1R may mobilize calcium ion from intracellular stores, whereas agonists of AT2R decrease the activity of adenylyl cyclase thus depressing the cAMP/PKA signaling (https://www.guidetopharmacology.org). Interestingly, the two receptors may interact, leading to the formation of receptor heteromers with particular properties: pharmacological, functional or both [9, 10]. On the one hand, heteromerization modifies receptor trafficking and ß-arrestin recruitment [10]. On the other hand, Ang II induces the formation of heteromers of the two receptors (AT1/2Hets) in luminal membranes of kidney tubular epithelial LLC-PK1 cells. In these cells, the peptide activates a calcium channel, sarco/endoplasmic reticulum Ca2+-ATPase (SERCA), that in kidney cells participates in the control of blood pressure [11]. The main target for pharmacological anti-parkinsonian interventions is the striatum that receives the SN dopaminergic input needed for motor control. What it is important is to know is whether AT1 and
AT2 interact in the CNS, which is their physiological function and how their expression is alter in the
course of a neurodegenerative disease. Accordingly, the aims of this paper were to i) get further
insight into the properties of AT1/2Hets in a heterologous expression system, ii) investigate the
expression and function of AT1R, AT2R and AT1/2Hets in striatal neurons and iii) investigate the
expression and function of AT1R, AT2R and AT1/2Hets in striatal microglia in resting and activated
states. The results show that AT2R are expressed in neurons and in activated microglia where they
interact with AT1R to form AT1/2Hets. Accordingly, a final aim was to discover differential expression
of AT1/2Hets in microglia striatal samples from parkinsonian and dyskinetic animals.
Materials And Methods
Reagents Lipopolysaccharide (LPS), interferon-γ (IFN-γ) and forskolin were purchased from Sigma-Aldrich (St Louis, MO), and Angiotensin II (Ang II), CGP-42112A, Candesartan and PD123319 from Tocris Bioscience (Bristol, UK). HEK-293T cells and primary cultures Human embryonic kidney (HEK-293T) cells were grown in Dulbecco’s modified Eagle’s medium (DMEM) (Gibco) supplemented with 2 mM L-glutamine, 100 µg/ml sodium pyruvate, 100 U/ml penicillin/streptomycin, MEM Non-Essential Amino Acids Solution (1/100) and 5% (v/v) heat inactivated Fetal Bovine Serum (FBS) (all supplements were from Invitrogen, Paisley, Scotland, UK). To prepare mice striatal primary microglial cultures, brain was removed from C57BL/6 mice of 2–4 days of age. Microglial cells were isolated following protocols described elsewhere [12–14] and grown in DMEM medium supplemented with 2 mM L-glutamine, 100 U/ml penicillin/streptomycin, MEM Non-Essential amino acids preparation (1/100) and 5% (v/v) heat inactivated Fetal Bovine Serum (FBS) (Invitrogen, Paisley, Scotland, UK). Briefly, striatum tissue was dissected, carefully stripped of its meninges and digested with 0.25% trypsin for 20 min at 37 ºC. Trypsinization was stopped by washing the tissue. Cells were brought to a cell suspension by repeated pipetting followed by passage through a 100 µm pore mesh. Glial cells were resuspended in medium and seeded at a density of 1 ×10⁶ cells/ml in 6-well plates for cyclic adenylic acid (cAMP) assays, in 12-well plates with coverslips for in situ proximity ligation assays (PLA) and in 96-well plates for mitogen-activated protein kinase (MAPK) experiments. Cultures were maintained at 37ºC in humidified 5% CO2 atmosphere and, unless otherwise stated, medium was replaced once a week. Parkinson’s disease (PD) model generation, levodopa treatment and dyskinesia assessment All experiments were carried out in accordance with EU directives (2010/63/EU and 86/609/CEE) and were approved by the Ethical committee of the University of Santiago de Compostela. Animals, male Wistar rats, were divided into three groups as follows: non-lesioned rats, 6-hydroxydopamine (6-hydroxy-DA)-lesioned animals receiving vehicle, and 6-hydroxy-DA-lesioned animals receiving a chronic treatment with levodopa. A total of 15 animals were used. Details of model generation, protocol of drug administration and behavioral analysis, performed by a blinded investigator, are given elsewhere [1, 15]. In brief, surgery was performed on rats anesthetized with ketamine/xylazine (1% ketamine − 75 mg/kg-, and 2% xylazine − 10- mg/kg). Lesions were produced in the right medial forebrain bundle to achieve complete lesion of the nigrostriatal pathway. The rats were injected with 12 µg of 6-hydroxy-DA (to provide 8 µg of 6-hydroxy-DA free base; SigmaAldrich) in 4 µl of sterile saline containing 0.2% ascorbic acid. Some animals were treated with levodopa by receiving a daily subcutaneous injection with levodopa methyl ester (6 mg/kg) plus benserazide (10 mg/kg) for 3 weeks (such treatment reliably induces dyskinetic movements). In order to discriminate dyskinetic from non-dyskinetic animals, the manifestation of levodopa-induced AIMS (abnormal involuntary movements) was evaluated according to the rat dyskinesia scale described in detail previously [15–17]. The severity of each AIM subtype (limb, orolingual, and axial) was assessed using scores from 0 to 4 (1, occasional, i.e., present < 50% of the time; 2, frequent, i.e., present > 50% of the time; 3, continuous, but interrupted by strong sensory stimuli; 4, continuous, not interrupted by strong sensory stimuli). Rats were classified as “dyskinetic” if they displayed a ≥ 2 score per monitoring period on at least two abnormal involuntary movement (AIM) subtypes. Animals classified as “non-dyskinetic” exhibited either no AIMs or very
mild/occasional ones. Animals with low scores, i.e., either non-dyskinetic or dyskinetic, were
discarded.
Fusion proteins
Human cDNAs for AT1, AT2 and σ1 receptors cloned into pcDNA3.1 were amplified without their stop
codons using sense and antisense primers harboring either BamHI and HindIII restriction sites to
amplify AT1R and AT2R or BamHI and EcoRI restriction sites to amplify σ1 receptor. Amplified
fragments were then subcloned to be in frame with an enhanced yellow fluorescent protein (pEYFP-
N1; Clontech, Heidelberg, Germany) or a Rluc (pRluc-N1; PerkinElmer, Wellesley, MA) on the C-terminal end of the receptor to produce AT1R-YFP, AT2R-RLuc, AT2R-YFP and σ1R-RLuc fusion proteins.
Cell transfection HEK-293T cells were transiently transfected with the corresponding cDNA by the PEI (PolyEthylenImine, Sigma-Aldrich, St. Louis, MO) method [18, 19]. Briefly, the corresponding cDNA diluted in 150 mM NaCl was mixed with PEI (5.5 mM in nitrogen residues) also prepared in 150 mM NaCl for 10 min. The cDNA-PEI complexes were transferred to HEK-293T cells and were incubated for 4 hours in a serum-starved medium. Then, the medium was replaced by fresh supplemented culture medium and cells were maintained at 37 ºC in a humid atmosphere of 5% CO2. 48 hours after transfection, cells were washed, detached, and resuspended in the assay buffer. Immunocytochemistry HEK-293T cells were seeded on glass coverslips in 12-well plates. On DIV 2, cells were transfected
with AT1R-YFP cDNA (1 µg), AT2R-Rluc cDNA (1 µg) or both. On DIV 4, cells were fixed in 4%
paraformaldehyde for 15 min and washed twice with PBS containing 20 mM glycine before permeabilization with PBS-glycine containing 0.2% Triton X-100 (5 min incubation). Cells were blocked during 1 hour with PBS containing 1% bovine serum albumin. HEK-293T cells were labeled with a mouse anti-Rluc antibody (1/100; Millipore, Darmstadt, Germany) and subsequently treated with Cy3 conjugated anti-mouse (1/200; Jackson ImmunoResearch (red)) IgG (1 hour each). The AT1R-YFP expression was detected by YFP´s own fluorescence. Nuclei were stained with Hoechst (1/100 from
stock 1 mg/mL; SigmaAldrich). Samples were washed several times and mounted with 30% Mowiol
(Calbiochem). Images were obtained in a Leica SP2 confocal microscope (Leica Microsystems) with
the 63X oil objective.
Bioluminescence resonance energy transfer (BRET) assays
For BRET assays, HEK-293T cells were transiently cotransfected with a constant amount of cDNA
encoding for AT2R-RLuc (0.9 µg) and with increasing amounts of cDNA corresponding to AT1R-YFP (0.5
to 4 µg). For negative control, HEK-293T cells were transiently cotransfected with a constant amount of cDNA encoding for σ1-RLuc (0.75 µg) and with increasing amounts of cDNA corresponding to AT2 R-YFP (0.1 to 4 µg). To control the cell number, sample protein concentration was determined using a Bradford assay kit (Bio-Rad, Munich, Germany) using bovine serum albumin (BSA) dilutions to prepare the standard absorbance versus concentration relationship. To quantify fluorescent proteins, cells (20 µg protein) were distributed in 96-well microplates (black plates with a transparent bottom) and fluorescence was read in a Fluostar Optima Fluorimeter (BMG Labtech, Offenburg, Germany) equipped with a high-energy xenon flash lamp, using a 10 nm bandwidth excitation filter at 485 nm. For BRET measurements, the equivalent of 20 µg of cell suspension was distributed in 96-well white microplates with white bottom (Corning 3600, Corning, NY) and 5 µM coelenterazine H (Molecular Probes, Eugene, OR) was added. One minute after adding coelenterazine H, BRET was determined using a Mithras LB 940 reader (Berthold Technologies, DLReady, Germany), which allows the integration of the signals detected in the short-wavelength filter at 485 nm and the long-wavelength filter at 530 nm. To quantify AT2R-RLuc expression, luminescence readings were performed 10 minutes after the addition of 5 µM coelenterazine H. MilliBRET units (mBU) are defined as: where Cf corresponds to [(long-wavelength emission)/(short-wavelength emission)] for the RLuc construct expressed alone in the same experiment.
Detection of cytoplasmic calcium ion
HEK-293T cells were cotransfected with the cDNA for the Ang receptors AT1 (1 µg) and/or AT2 (1 µg)
and the GCaMP6 calcium sensor (1 µg) [20] by the use of PEI method (Section “Cell Transfection”). 48
hours after transfection, HEK-293T cells plated in 6-well black, clear bottom plates, were incubated
with Mg2+-free Locke’s buffer (154 mM NaCl, 5.6 mM KCl, 3.6 mM NaHCO3, 2.3 mM CaCl2, 5.6 mM
glucose, 5 mM HEPES, pH 7.4) supplemented with 10 µM glycine. Receptor antagonists were added 10 min before readings and receptor agonists just a few seconds before readings. Fluorescence emission intensity of GCaMP6 was recorded at 515 nm upon excitation at 488 nm on the EnSpire® Multimode Plate Reader for 150 s every 5 s at 100 flashes per well. cAMP level determination The analysis of cAMP levels was performed in HEK-293T cells transfected with cDNA for AT1 (1 µg) and/or AT2 (1 µg) receptors in primary cultures of striatal neurons or glia using the Lance Ultra cAMP kit (PerkinElmer). The optimal cell density to obtain an appropriate fluorescent signal was first established by measuring the TR-FRET signal as a function of forskolin concentration using different cell densities. Forskolin dose-response curves were related to the cAMP standard curve in order to establish which cell density provides a response that covers most of the dynamic range of cAMP standard curve. 2 hours before the experiment the medium was substituted by serum-starved DMEM medium. Cells (2,000 HEK-293T cells, 4,000 striatal neurons or glial cells by well in 384-well microplates) growing in medium containing 50 µM zardaverine were pre-treated with the AT1R or AT2R antagonists (Candesartan and PD123319 respectively) or the corresponding vehicle at 24 °C for
15 min, and stimulated with the AT1R and/or AT2R agonists (Ang II and CGP-42112A respectively) for
15 min before adding 0.5 µM forskolin or vehicle, and incubating for an additional 15 min period. After
1 hour, fluorescence at 665 nm was analyzed on a PHERAstar Flagship microplate reader equipped
with an HTRF optical module (BMG Labtech). A standard curve for cAMP was obtained in each
experiment.
To determine ERK1/2 phosphorylation, 40,000 HEK-293T cells transfected with cDNA for AT1R (1 µg) and/or AT2R (1 µg) or 50,000 striatal neurons or glial cells primary cultures were plated in each well of transparent Deltalab 96-well microplates. Two hours before the experiment, the medium was substituted by serum-starved DMEM medium. Then, cells were treated or not for 10 min with the selective antagonists Candesartan or PD123319 in serum starved DMEM medium followed by 7 min treatment with the selective agonists Ang II and/or CGP-42112A. Cells were then washed twice with cold PBS before the addition of lysis buffer (15 min treatment). 10 µL of each supernatant were placed in white ProxiPlate 384-well microplates and ERK1/2 phosphorylation was determined using AlphaScreen®SureFire® kit (Perkin Elmer) following the instructions of the supplier and using an EnSpire® Multimode Plate Reader (PerkinElmer, Waltham, MA, USA). Dynamic Mass-Redistribution (DMR) label free assays Cell signaling was explored using an EnSpire® Multimode Plate Reader (PerkinElmer, Waltham, MA, USA) by a label-free technology. Cellular cytoskeleton redistribution movement induced upon receptor activation were detected by illuminating the underside of the plate with polychromatic light and measured as changes in wavelength of the reflected monochromatic light that is a sensitive function of the index of refraction. The magnitude of this wavelength shift (in picometers) is directly proportional to the amount of DMR. To determine the label free-DMR signal, 10,000 HEK-293T cells
transfected with cDNA for AT1R (1 µg) and/or AT2R (1 µg) receptors or 10,000 striatal neurons or glial
cells primary cultures were plated on each well of transparent 384-well fibronectin coated microplates to obtain 70–80% confluent monolayers, and kept in the incubator for 24 h. Previous to the assay, cells were washed twice with assay buffer (HBSS with 20 mM HEPES, pH 7.15, 0.1% DMSO) and incubated in the reader for 2 hours in 30 µl/well of assay-buffer at 24 °C. Hereafter, the sensor plate was scanned and a baseline optical signature was recorded for 10 minutes before adding 10 µl of test antagonists (Candesartan or PD123319) dissolved in assay buffer, and 30 minutes later, followed by the addition of 10 µl of selective agonists (Ang II and/or CGP-42112A) also dissolved in assay buffer. DMR responses induced by the agonist were monitored for a minimum of 3,600 s.
Proximity Ligation Assay (PLA)
Detection in natural sources of clusters formed by AT1 and AT2 receptors was addressed in striatal
neurons, primary cultures of glial cells and rat brain slices. Cells were grown on glass coverslips, fixed in 4% paraformaldehyde for 15 min, washed with PBS containing 20 mM glycine to quench the aldehyde groups, permeabilized with the same buffer containing 0.05% Triton X-100 for 5 to 15 min and washed with PBS. After 1 hour incubation at 37 °C with the blocking solution in a pre-heated humidity chamber, primary cultures were incubated overnight at 4ºC with a mixture of a mouse monoclonal anti-AT1R antibody (1/100, sc-515884, Santa Cruz Biotechnology, Texas, USA), a rabbit monoclonal anti-AT2R antibody (1/100, ab92445, Abcam, Cambridge, UK) and Hoechst (1/100 from stock 1 mg/mL; SigmaAldrich) to stain the nuclei. The antibodies were validated following the method in the technical brochure of the vendor with fairly similar results and also by immunofluorescence in HEK-293T cells (transfected versus untransfected). Samples from KO animals were not available for validation. Cells were further processed using the PLA probes detecting primary antibodies (Duolink In Situ PLA probe Anti-Mouse plus and Duolink In Situ PLA probe Anti-Rabbit minus) (1/5 v:v for 1-hour at 37ºC). Ligation and amplification were done as indicated by the supplier (SigmaAldrich) and cells were mounted using the mounting medium 30% Mowiol (Calbiochem). To detect red dots corresponding to AT1/2Hets, samples were observed in a Leica SP2 confocal microscope (Leica Microsystems, Mannheim, Germany) equipped with an apochromatic 63X oil-immersion objective (N.A. 1.4), and a 405 nm and 561 nm laser lines. For each field of view a stack of two channels (one per staining) and 3 Z-planes with a step size of 1 µm were acquired. The Andy’s Algorithm [21], a specific ImageJ macro for reproducible and high-throughput quantification of the total PLA foci dots and total nuclei, was used for data analysis. Statistical analysis The data in graphs are the mean ± SEM (n = 5, at least). GraphPad Prism software version 7 (San Diego, CA, USA) was used for data fitting and statistical analysis. One-way ANOVA followed by post-hoc Bonferroni’s test were used when comparing multiple values. When a pair of values were
compared, the Student’s t test was used. Significant differences were considered when the p value
was < 0.05.
Results
Functionality of AT 1/2 Hets in a heterologous expression system
Interactions between AT1 and AT2 receptors have been previously reported [10, 11]. Hence, we first
investigated whether in HEK-293T cells and in our assay conditions AT1 and AT2 receptors may form
heteromers. We analyzed the colocalization of angiotensin receptors at the plasma membrane by
using HEK-293T cells coexpressing AT1R and AT2R fused to, respectively, the yellow fluorescent
protein (YFP) and Renilla luciferase (Rluc). The proper traffic of fusion proteins to the cell membrane
was confirmed by immunocytochemical analysis (Fig. 1A-B). The high degree of colocalization
between AT1R-YFP and AT2R-Rluc in the plasma membrane and in the cytosol is shown in yellow
(Fig. 1C). To know whether a direct interaction between AT1 and AT2 receptors is possible, BRET
assays were performed in HEK-293T cells expressing a constant amount of a fusion protein consisting
of AT2R and Renilla Luciferase (AT2R-Rluc) and increasing amounts of AT1R fused to YFP (AT1R-YFP).
The saturation curve in Fig. 1D indicates close proximity between the two Ang receptors. The
BRETmax and BRET50 values were 42 ± 1 mBU and 6 ± 2, respectively. When HEK-293T cells were
transfected with a constant amount of cDNA for σ1-Rluc and increasing amounts of cDNA for AT1 R-YFP, a linear response was observed indicating a nonspecific interaction of this negative control (Fig. 1D). These results confirm that the two Ang receptors may form heteromers in living HEK-293T cells. The proper functionality of fusion proteins was confirmed by cAMP assays (data not shown). A schematic representation of the technique is shown in Fig. 1E. To characterize the AT1/2 Het functionality, signaling assays were performed in single-transfected HEK-293T cells and in cotransfected AT1/2Hets-expressing cells. Cytosolic calcium levels, cAMP determination, ERK1/2 phosphorylation and label-free DMR assays were performed after treatment
with AT1R and/or AT2R ligands. Consistent with Gq coupling of AT1R, treatment of AT1R-expressing
cells with Ang II led to a marked increase in cytosolic calcium levels. The effect was receptor-mediated, as it was blocked by candesartan, the AT1R antagonist (Fig. 2A). In AT2R expressing cells,
the AT2R agonist CGP-42112A did not induce mobilization of the ion. These results agree with AT2R
not engaging Gq proteins. In cotransfected cells, CGP-42112A did not produce any effect but reduced
the response peak produced by Ang II. Hence, within the AT1/2Het, AT2R stimulation inhibits the AT1
receptor signaling. Unlike the selective AT1R antagonist, candesartan, which blunted the agonist
effect, the selective AT2R antagonist, PD123319, potentiated the AT1R-mediated effect (Fig. 2C).
Consistent with AT2R coupling to Gi, CGP-42112A reduced the forskolin-induced cAMP cytosolic levels
in AT2R single transfected cells. Interestingly, in AT1R expressing cells, Ang II treatment also reduced
the forskolin-induced cAMP levels. These effects can be explained by AT1R coupling not only to Gq, but also to Gi proteins. These effects were receptor-mediated and specific as they were blocked by the corresponding antagonist (Fig. 2D-E). Analysis of cAMP-PKA signaling in cotransfected cells is more complex. On the one hand, all agonists reduced forskolin-induced [cAMP] and each antagonist blocked the effect of the corresponding agonist. Simultaneous administration of Ang II and CGP-42112A did not result in an additive effect. On the other hand, the antagonist of the AT2R enhanced
the effect induced by the AT1R agonist and vice-versa, the antagonist of the AT1R enhanced the effect
of the AT2R agonist (Fig. 2F). These latter results fit with data from calcium release experiments assays where the antagonist of the AT2R potentiated the action of Ang II. Then, it seems that both angiotensin receptors regulate one another via heteromerization. The negative regulation can be reversed and the antagonist of one receptor can even reinforce the output due to activation of the partner receptor. In AT1R-expressing cells a marked increase in agonist-induced ERK1/2 phosphorylation that was blocked by candesartan was observed, while in AT2R-expressing cells a mild non-significant effect was obtained by treatment with the agonist, CGP-42112A (Fig. 3A-B). Remarkably, AT1/2Hets expression in cotransfected cells led to a significant increase in ERK1/2 phosphorylation upon Ang II treatment. The selective AT2R agonist was still unable to produce any significant effect but, in combined treatments,
it markedly reduced the effect induced by Ang II (Fig. 3C). Therefore, these results are in the same line with that observed in calcium release and cAMP accumulation, indicating that both receptors inhibit one another in the AT1/2Het. DMR was modified by agonists in both types of single-transfected cells. In AT1R-expressing cells the antagonist could not revert totally the effect of the agonist, indicating that part of the output signal is due to off-site action of Ang II (Fig. 3D). In contrast, the effect of CGP-42112A on AT2R-expressing was totally blocked by PD123319 (Fig. 3E). In cotransfected cells, the results indicate that both angiotensin receptors show a characteristic signal that is blocked by selective antagonists. However, coactivation in these cells produced an important decrease in the signal. This effect is named negative crosstalk and it is similar to that observed in MAPK phosphorylation assays (Fig. 3E). The enhancement by candesartan of the effect of CGP-42112A, the AT2R agonist, was also noticed. In summary, these results indicate a particular functionality of the AT1/2Het, namely Ang is able to engage two different signaling pathways. This dual effect is regulated by activation of the partner
receptor within the AT1/2Het as i) activation of AT1R blocks AT2R agonist induced effect and vice-versa
and ii) AT1R antagonist releases the inhibition exerted by AT2R over AT1R and vice-versa.
Functionality of AT 1 R and AT 2 R in primary cultures of striatal neurons
On the basis of the above-described relevance of Ang receptors in motor control and as potential
targets to combat PD, we investigated Ang receptor-mediated signaling in primary cultures of neurons
isolated from mouse striatum. Reduction of forskolin-induced [cAMP] increases were obtained using
Ang II, while no sign of Gi-coupled AT2R was detectable (Fig. 4A). Interestingly, in simultaneous
treatment with agonists, a lower decrease of forskolin-induced [cAMP] indicated the presence of AT2R
whose activation reduced AT2R-mediated signaling. In the presence of the AT1R antagonist,
candesartan, the AT2R agonist, CGP-42112A, induced a significant decrease in forskolin-induced cAMP
levels. These results indicate that in the AT1/2 Het, the AT2R signal is inhibited by AT1R expression
ERK1/2 phosphorylation determination in cultured striatal neurons, where cells responded (moderately) to Ang II and non-significantly to CGP-42112A (Fig. 4B). However, candesartan pretreatment potentiated AT2R signal. In agreement with the results in HEK-293T cells, cotreatment with agonists induced a lower signal to that induced by angiotensin II, indicating a negative crosstalk effect in both cAMP and MAPK phosphorylation signaling pathways. Overall, these cells express AT1/2Hets with similar functional characteristics to that observed in cotransfected HEK-293T cells.
Functionality of AT 1 R and AT 2 R in primary cultures of striatal microglia. Expression of AT 1/2 Hets. Before assessing the functionality of Ang receptors in resting and LPS + IFNγ activated microglia isolated from striatum, we used in situ PLA to assess the expression of AT1/2Hets; PLA is instrumental to detect clusters of interacting proteins in natural sources. Figure 5B shows that resting cells have a few number of red dots due to AT1/2Hets, while the negative control show a negligible number of red dots (Fig. 5A). Interestingly, the red label was markedly increased in activated cells, as shown in Fig. 5C and in the bar graph of Fig. 5D indicating that AT1/2Hets expression increases in activated microglia. We then performed cAMP level determination and ERK1/2 phosphorylation assays in resting
and activated microglial cells. The functionality of AT1R, AT2R and/or AT1/2Hets in resting cells was
very low. But in cAMP assays, pretreatment with candesartan potentiated AT2R induced signaling, and PD123319 potentiated AT1R functionality (Fig. 5E, G). In contrast, the angiotensin-receptor-mediated signaling was more robust in LPS + IFNγ activated cells (Fig. 5F, H). In cAMP assays, the agonist of the two receptors reduced the forskolin-induced levels of this second messenger, although receptor costimulation did not lead to any additive effect. As it occurred in HEK-293T cells and neuronal primary cultures, antagonist pretreatments potentiated the partner receptor signal. On the other hand, the agonist of any of the two receptors activated the MAPK signaling pathway, while simultaneous stimulation completely blunted the ERK1/2 phosphorylation effect in activated microglia. In this signaling pathway antagonists blocked the cognate receptor and did not potentiate the activation of the partner receptor in the heteromer. Taken together, these results indicate that AT1/2Hets are significantly expressed in activated microglia showing the same properties than those
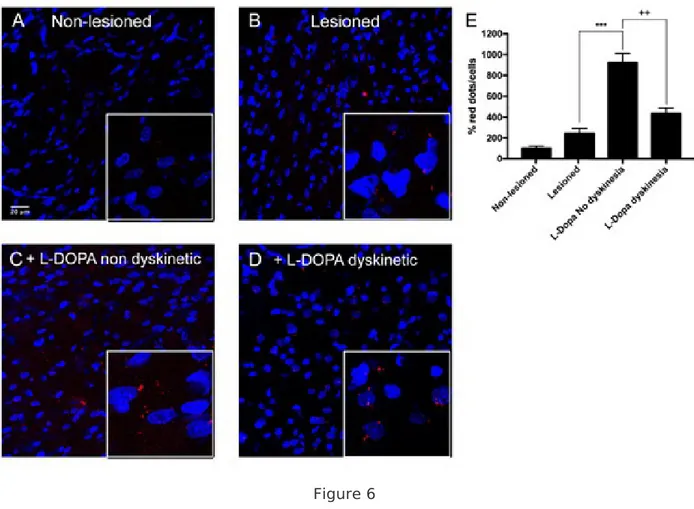
displayed in heterologous system. Expression AT 1/2 Hets in the striatum of parkinsonian and dyskinetic rats. Striatal sections of well-characterized 6-OH-dopamine hemilesioned rats, treated or not with levodopa (L-DOPA) and divided into dyskinetic or resistant to dyskinesia were prepared as described in methods. PLA assays were performed simultaneously and in identical conditions to detect the occurrence and the amount of AT1/2Hets. A representative image of each of the conditions is shown in Fig. 6A-D, while quantitation is shown in the form of bar graph in Fig. 6E. Whereas the amount of AT1/2Hets was negligible in the non-lesioned striatum, the lesioned one displayed more receptor clusters. Levodopa-treated dyskinetic animals showed a two-fold increase if compared with the ipsilateral hemisphere of lesioned rats (> 4-fold increase if compared with the contralateral non-lesioned side). Remarkably, levodopa-induced non dyskinetic animals had a circa 10-fold increase in the amount of AT1/2Hets (compared to control, non-lesioned hemisphere). These results show that, in this specific PD model, progression of the disease correlate with a marked increases in the amount of AT1/2Hets, with a stronger increase in non dyskinetic animals compared to animals showing dyskinetic movements.
Discussion
Details of peripheral RAS have been instrumental to develop a successful therapy to combat hypertension. The knowledge of RAS in the CNS is still fragmentary but with repercussions in dopaminergic neurotransmission and potential in PD and/or PD therapy-related dyskinesias. One of the added value of any future PD intervention based in central RAS is the safety of angiotensin receptor antagonists that have been used for decades in hypertensive patients. While no double-blind placebo controlled clinical trials have been designed, epidemiological studies addressing the risk of hypertensive patients taking angiotensin receptor antagonists have been performed. The fact that not all the drugs are able to cross the blood-brain barrier complicates data analysis. Anyhow, some of the reported results appear promising and using ß-blockers as a control and 65001 hypertensive patients for > 4 years [22] showed that the use of certain antihypertensives (angiotensin receptor blockersincluded) associates with reduced PD risk. The still unsolved question is whether such drugs may be
of benefit in delaying the progression of the disease.
First of all, it has been described that the global effects of angiotensin on AT1 and AT2 receptors are
opposite. In several tissues overactivity of the AT1
receptor has been linked to aging-related pro-inflammatory changes [7, 23]. Different mechanisms have been proposed to explain counteracting
effects of AT2R on AT1R signaling (see [24–26]for review). Although the issue is complex, the
expression of AT2R in brain suggests a relevant role in the regulation of neuroinflammation. On the one hand, as earlier indicated, the two angiotensin receptors may interact leading to receptor heteromers with particular properties such as regulating SERCA activity [10, 11]. On the other hand, several heteromers formed by angiotensin receptors have been described. Among other examples, [27] it has been reported that apelin and AT1 receptors interact and that the resulting heteromers mediate the apelin inhibition of AT1R-mediated actions. MAS protooncogene, the novel player in AT research, rescues a defective AT1R, likely by forming heterodimers [28]. The discovery of interaction
between AT1R and the most abundant receptor in the CNS, namely the cannabinoid CB1 receptor, has
led to hypothesize that these functional units may lead to pathogenic actions when AT is produced. However, the potential toxicity was studied in hepatic cells in relation to ethanol consumption but it was not assayed in neuronal cell models [29]. The AT1R may form complexes with a variety of adrenergic receptors [30, 31] although their relevance to CNS physiology seems scarce. Less data are available for the AT2R receptor that may interact (in the periphery) with MAS and with bradykinin B2 receptors [25, 32–34]. In addition, AT1/2Hets may form dimers that, may eventually interact with MAS or with bradykinin B2 receptors in cells in which three of these receptors are expressed together [35, 36]. One of the relevant results in this study is the demonstration in a rat model of microglial AT1/2Hets expression and its upregulation correlating with PD progression. What is relevant for PD pathophysiology and disease progression is to delay the death of the approximately 30% nigral dopaminergic neurons that are left at the time of PD diagnosis. Glia in
general, and microglia in what concerns to neuroinflammation, are key to preserve neurons from death. AT1Rs have been proposed as targets to reduce chronic neuroinflammation [37–39] as that occurring in PD. The general idea is that activation of the AT1R is detrimental, for instance by a microglia-mediated enhancement of neuronal loss in status epilepticus induced in rats [40]. In a previous study performed in the SN of rats we showed that angiotensin-induced Rho-kinase activation was involved in NADPH-oxidase activation, which, in turn, was involved in angiotensin-induced Rho-kinase activation [41]. In addition, a prevention of astrocyte activation and promotion of hippocampal neurogenesis has been attributed to AT1R antagonization and subsequent prevention of NFкB and MAP kinase signaling and activation of Wnt/β-catenin signaling [42]. In our experimental conditions performed with already activated striatal microglia, MAP kinase signaling is suppressed by
combined treatment with AT1 and AT2 receptor agonists. In the retina, AT1R activation results in
regulating microglial activation thus suggesting that AT may have important implications in diabetic retinopathy [43]. To our knowledge the expression of AT1/2Hets in retinal cells has not been addressed yet. In agreement with the occurrence of a RAS opposite arm consisting of AT2R (also of Mas receptor) [44], AT2R activation attenuates microglial activation in an autoimmune encephalomyelitis rodent model [45]. Activation of the receptor is neuroprotective in a model of ischemia induced in conscious rats [46]. Similarly, the report by Bennion et al. [47] proves that AT2R activation in neurons and glial cells affords long-term neuroprotection in stroke, by both direct and indirect mechanisms. Recent studies show that the receptor prevents/attenuates pro-inflammatory microglial activity via protein phosphatase 2A-mediated inhibition of protein kinase C [48]. To our knowledge the AT1-bradikinin B2 heteroreceptor complex was the first to be associated to a peripheral-affecting disease. In fact the expression of the heteromer was increased thus mediating a higher Ang responsiveness in preeclampsia, a disease that markedly alters blood pressure in pregnancy [49]. The heteromer physiological function involves diverse signaling pathways and a variety of cells events such as phosphorylation of c-Jun terminal kinase and enhanced production of nitric oxide and a second messenger, cGMP [32]. An unbalanced proportion of AT1-bradikinin B2
receptor heteromers alters activation of cognate G-proteins and receptor desensitization [50, 51]. We have collected data on differential expression of dopamine-receptor-containing heteromers in PD and the conclusion is that very often the expression of heteromers is altered in one or different stages of the disease. Usually the expression of those heteromers in dyskinesia is lower than in PD animals not displaying dyskinesia. Hence, this is the first example in which expression of heteromers that is already enhanced in parkinsonian conditions is further increased in non-dyskinetic conditions. These results are relevant as antagonists of angiotensin are considered as having potential to both improve PD symptoms and minimize levodopa-induced dyskinesias. Limitations of the study are related with the variety of cell types in neurons and in glial cells. It is a challenge to know the relative expression of receptors in projection neurons, in choline acetyltransferase (ChAT), parvalbumin (PV), calretinin (CR) or nitric oxide synthase interneurons and in astroglia and microglia, which may be at different degrees of activation depending on the disease status. Furthermore, receptor functionality in response to a given receptor ligand may vary from cell to cell [52] and at onset of disease when comparing naïve versus levodopa-treated individuals. But in any case, pharmacological manipulation of RAS components presents potential in PD [44]. One of the relevant findings in this paper is the insensitivity of AT2R to agonist treatment of striatal neurons. Indeed those neurons express both Ang receptor types as previously demonstrated [53]. However, it is more remarkable that it becomes functional in the presence of candesartan. There are few examples of similar findings and a recent one consists of progressive decrease of adenosine A2A receptor functionality upon coexpression of another adenosine receptor, A2B, and formation of A2A/A2B heteroreceptor complexes. This phenomenon is due to allosteric inter-protomer interactions in the heteromer, i.e. the presence of one receptor blocks the signaling of the partner receptor in the complex [54]. Interestingly, the presence of an antagonist could make, as in the case of Ang receptor
heteromers in striatal neurons, appear AT2R functionality back. Therefore, AT1R antagonists in these
neurons may achieve two benefits, which are repressing the detrimental actions mediated by the
activation. Furthermore, in terms of looking for interventions to prevent PD disease progression there is enough information to agree that microglial cells may be key if there is a way to skew the physiology to acquire the M2 neuroprotective phenotype. On the one hand, neuronal alpha-synuclein produces an upregulation of AT1R while increasing in microglia the proportion of pro-inflammatory M1 versus neuroprotective M2 markers; accordingly it is suggested that antagonists already used in hypertension and able to cross the blood-brain barrier, may be repurposed for the therapy of PD [8].
On the other hand, microglial AT2Rs, constituent in AT1/2Hets, show promise as i) they are
upregulated in both parkinsonian conditions and in levodopa-induced dyskinesias and ii) their
activation is seemingly neuroprotective. Remarkably, AT1/2Hets do not show cross-antagonism, a
property displayed by many heteromers and that would lead to a therapeutic dead end in terms of
neuroprotection; instead the antagonist of one receptor releases the brake on activation of the
partner receptor. Taken together, the opposite action of AT1 and AT2 receptors, their expression in
microglia and the marked upregulation of AT1/2Hets lacking cross-antagonism but displaying
antagonist-mediated cross-potentiation, suggest that interventions aimed at antagonizing central
AT1Rs to potentiate AT2R-mediated actions may be neuroprotective in PD.
Conclusions
The present study demonstrates that AT1 and AT2 receptors form AT1/2Hets that are expressed in
cells of the central nervous system. AT1/2Hets are novel functional units with particular signaling properties. Importantly, the coactivation of the two receptors in the heteromer reduces the signaling output of angiotensin. Remarkably, AT1/2Hets, which are expressed in both striatal neurons and microglia, show a cross-potentiation, i.e. candesartan, the antagonist of AT1 increases the effect of AT2 receptor agonists. In addition, the level of expression in the unilateral 6-OH-dopamine lesion rat PD model increases upon disease progression and is maximal in dyskinetic animals. Importance and relevance of the study reported These findings reported are potentially important because they indicate that boosting the action of
neuroprotective AT2 receptors using an AT1 receptor antagonist constitutes a promising therapeutic strategy in PD. The strategy may consist of designing AT1R receptor antagonists able to readily cross the blood-brain barrier and effective in releasing the brake on the AT2 receptor.
Abbreviations
6-hydroxy-DA: 6-hydroxydopamine AIMS: Abnormal Involuntary Movements Ang: Angiotensin Ang II: Angiotensin II AT1/2Hets AT1-AT2 Heterodimers BRET: Bioluminescence Resonance Energy Transfer BSA: Bovine Serum Albumin cAMP: Cyclic Adenylic acid CAN: Candesartan CGP: CGP-42112A ChAT: choline acetyltransferase CNS: central nervous system CR: Calretinin Cy3: Cyano 3 DA: Dopamine DIV: Days In Vitro DMEM: Dulbecco’s modified Eagle’s medium DMR: Dynamic Mass Redistribution DMSO: Dimethyl sulfoxide FBS: Fetal Bovine Serum FK: Forskolin GPCR: G-protein-coupled receptor HBSS: Hanks' Balanced Salt SolutionHTRF: Homogeneous Time Resolved Fluorescence IFN- g: Interferon-g L-DOPA: Levodopa LPS: Lipopolysaccharide MAPK: Mitogen-Activated Protein Kinase mBU: Milli Bioluminescence resonance energy transfer Units NaCl: Sodium Chloride PBS: Phosphate Buffered Saline PD: Parkinson’s disease PEI PolyEthylenImine PKA: Protein kinase A PLA: Proximity ligation assays PV: Parvalbumin RAS: Renin-angiotensin system Rluc: Renilla luciferase SERCA: Sarco/endoplasmic reticulum Ca2+-ATPase SN: Substantia nigra TR-FRET: Time-resolved fluorescence energy transfer YFP: Yellow Fluorescent Protein
Declarations
Ethics Approval and consent to participate All animal experiments were carried out in accordance with EU directives (2010/63/EU and 86/609/CEE) and were approved by the Ethical committee of the University of Santiago de Compostela (#2016/0345) whose resolutions are supervised by regional and National regulatory bodies. Competing interests Author declares no conflict of interest FundingThis work was supported by grants of the Spanish Ministry of Health (PI17/00828 and CIBERNED) and from the Spanish Ministry of Science, Innovation and Universities (RTI2018-098830-B-I00 and RTI2018-094204-B-I00; they include EU FEDER funds). Authors' contributions RF, GN and JLL designed, supervised the work in the different laboratories and validated the data in the manuscript. RRS and IRR performed biophysical, signaling and immunohistochemical assays. RRS analyzed proximity ligation assay data. AM and AIRP did the lesions, characterized the different animal groups and prepared brain sections. RF wrote the first draft that was edited first by GN and JLL and, subsequently, by all co-authors. Acknowledgements We acknowledge the excellent technical/logistic help provided by Jasmina Jiménez.
References
1. 2014 Muñoz A, Garrido-Gil P, Dominguez-Meijide A, Labandeira-Garcia JL. Angiotensin type 1 receptor blockage reduces l-dopa-induced dyskinesia in the 6-OHDA model of Parkinson’s disease. Involvement of vascular endothelial growth factor and interleukin-1?? Exp Neurol. Elsevier Inc.; 2014;261:720–32. 2. Perez-Lloret S, Otero-Losada M, Toblli JE, Capani F. Renin-angiotensin system as a potential target for new therapeutic approaches in Parkinson’s disease. Expert Opin Investig Drugs. 2017;26:1163–73. 3. Garrido-Gil P, Valenzuela R, Villar-Cheda B, Lanciego JL, Labandeira-Garcia JL. Expression of angiotensinogen and receptors for angiotensin and prorenin in the monkey and human substantia nigra: an intracellular renin-angiotensin system in the nigra. Brain Struct Funct. 2013;218:373–88. 4. Valenzuela R, Barroso-Chinea P, Villar-Cheda B, Joglar B, Muñoz A, Lanciego JL, et al. Location of Prorenin Receptors in Primate Substantia Nigra: Effects on Dopaminergic Cell Death. J Neuropathol Exp Neurol. 2010;69:1130–42. 5. Grammatopoulos TN, Jones SM, Ahmadi FA, Hoover BR, Snell LD, Skoch J, et al. Angiotensin type 1 receptor antagonist losartan, reduces MPTP-induced degeneration of dopaminergic neurons in substantia nigra. Mol Neurodegener. 2007;2:1. 6. Labandeira-Garcia JL, Rodriguez-Pallares J, Dominguez-Meijide A, Valenzuela R, Villar-Cheda B, Rodríguez-Perez AI. Dopamine-angiotensin interactions in the basal ganglia and their relevance for Parkinson’s disease. Mov Disord. 2013;28:1337–42. 7. Labandeira-Garcia JL, Costa-Besada MA, Labandeira CM, Villar-Cheda B, Rodríguez-Perez AI. Insulin-Like Growth Factor-1 and Neuroinflammation. Front Aging Neurosci. 2017;9:365. 8. Rodriguez-Perez AI, Sucunza D, Pedrosa MA, Garrido-Gil P, Kulisevsky J, Lanciego JL, et al. Angiotensin Type 1 Receptor Antagonists Protect Against Alpha-Synuclein-Induced Neuroinflammation and Dopaminergic Neuron Death. Neurotherapeutics. 2018;15:1063–81. 9. Ferré S, Baler R, Bouvier M, Caron MGMG, Devi LALA, Durroux T, et al. Building a new conceptual framework for receptor heteromers. Nat Chem Biol Nature Publishing Group. 2009;5:131–4.Porrello ER, Pfleger KDG, Seeber RM, Qian H, Oro C, Abogadie F, et al. Heteromerization of angiotensin receptors changes trafficking and arrestin recruitment profiles. Cell Signal. 2011;23:1767–76.
11.
Ferrão FM, Lara LS, Axelband F, Dias J, Carmona AK, Reis RI, et al. Exposure of luminal membranes of LLC-PK 1 cells to ANG II induces dimerization of AT 1 /AT 2 receptors to activate SERCA and to promote Ca 2+ mobilization. Am J Physiol Physiol. 2012;302:F875–83. 12. Newell EA, Exo JL, Verrier JD, Jackson TC, Gillespie DG, Janesko-Feldman K, et al. 2′,3′-cAMP, 3′-AMP, 2′-AMP and adenosine inhibit TNF-α and CXCL10 production from activated primary murine microglia via A2A receptors. Brain Res. 2015;1594:27–35. 13. Pulido-Salgado M, Vidal-Taboada JM, Garcia Diaz-Barriga G, Serratosa J, Valente T, Castillo P, et al. Myeloid C/EBPβ deficiency reshapes microglial gene expression and is protective in experimental autoimmune encephalomyelitis. J Neuroinflammation. 2017;14:54. 14. Saura J, Tusell JM, Serratosa J. High-Yield Isolation of Murine Microglia by Mild Trypsinization. Glia. 2003;44:183–9. 15. Pinna A, Bonaventura J, Farré D, Sánchez M, Simola N, Mallol J, et al. l-DOPA disrupts adenosine A2A– cannabinoid CB1–dopamine D2 receptor heteromer cross-talk in the striatum of hemiparkinsonian rats: Biochemical and behavioral studies. Exp Neurol. 2014;253:180–91. 16. Benito C, Núñez E, Tolón RM, Carrier EJ, Rábano A, Hillard CJ, et al. Cannabinoid CB2 receptors and fatty acid amide hydrolase are selectively overexpressed in neuritic plaque-associated glia in Alzheimer’s disease brains. J Neurosci. 2003;23:11136–41. 17. De Filippis D, Steardo A, D’Amico A, Scuderi C, Cipriano M, Esposito G, et al. Differential Cannabinoid Receptor Expression during Reactive Gliosis: a Possible Implication for a Nonpsychotropic Neuroprotection. Sci World J. 2009;9:229–35. 18. Hinz S, Navarro G, Borroto-Escuela D, Seibt BF, Ammon C, Filippo E, De, et al. Adenosine A2A receptor ligand recognition and signaling is blocked by A2B receptors. Oncotarget. Impact Journals LLC. 2018;9:13593–611. 19. Franco R, Navarro G, Rivas Santisteban R, Awad Alkozi H. Potency of melatonin at G-protein-coupled MT1 and MT2 receptors. Available at: osf.io/w7qxh. 2019. 20. Chen T-W, Wardill TJ, Sun Y, Pulver SR, Renninger SL, Baohan A, et al. Ultrasensitive fluorescent proteins for imaging neuronal activity. Nature. 2013;499:295–300. 21. Law AMK, Yin JXM, Castillo L, Young AIJ, Piggin C, Rogers S, et al. Andy’s Algorithms: new automated digital image analysis pipelines for FIJI. Sci Rep. 2017;7:15717. 22. Lee YC, Lin CH, Wu RM, Lin JW, Chang CH, Lai MS. Antihypertensive agents and risk of Parkinson’s disease: A nationwide cohort study. Morishita R, editor. PLoS One. 2014;9:e98961. 23.
Franceschi C, Bonafe M, Valensin S, Olivieri F, De Luca M, Ottaviani E, et al. Inflamm-aging: An Evolutionary Perspective on Immunosenescence. Ann N Y Acad Sci. 2006;908:244–54. 24. Padia SH, Carey RM. AT2 receptors: beneficial counter-regulatory role in cardiovascular and renal function. Pflugers Arch. 2013;465:99–110. 25. Patel S, Hussain T. Dimerization of AT2 and Mas Receptors in Control of Blood Pressure. Curr Hypertens Rep. 2018;20:1–9. 26. Steckelings UM, Kaschina E, Unger T. The AT2 receptor–a matter of love and hate. Peptides. 2005;26:1401–9. 27. Siddiquee K, Hampton J, McAnally D, May L, Smith L. The apelin receptor inhibits the angiotensin II type 1 receptor via allosteric trans-inhibition. Br J Pharmacol. 2013;168:1104–17. 28. Santos EL, Reis RI, Silva RG, Shimuta SI, Pecher C, Bascands JL, et al. Functional rescue of a defective angiotensin II AT1 receptor mutant by the Mas protooncogene. Regul Pept. 2007;141:159–67. 29. Rozenfeld R, Gupta A, Gagnidze K, Lim MP, Gomes I, Lee-Ramos D, et al. AT1R-CBâ R heteromerization reveals a new mechanism for the pathogenic properties of angiotensin II. EMBO J. 2011;30:2350–63. 30. Barki-Harrington L, Luttrell LM, Rockman HA. Dual Inhibition of β-Adrenergic and Angiotensin II Receptors by a Single Antagonist. Circulation. 2003;108:1611–8. 31. González-Hernández M, Godínez-Hernández D, Bobadilla-Lugo RA, López-Sánchez P. Angiotensin-II type 1 receptor (AT1R) and alpha-1D adrenoceptor form a heterodimer during pregnancy-induced hypertension. Auton Autacoid Pharmacol. 2010;30:167–72. 32. Abadir PM, Periasamy A, Carey RM, Siragy HM. Angiotensin II Type 2 Receptor–Bradykinin B 2 Receptor Functional Heterodimerization. Hypertension. 2006;48:316–22. 33. Leonhardt J, Villela DC, Teichmann A, Münter L-M, Mayer MC, Mardahl M, et al. Evidence for Heterodimerization and Functional Interaction of the Angiotensin Type 2 Receptor and the Receptor MASNovelty and Significance. Hypertension. 2017;69:1128–35. 34. Villela D, Leonhardt J, Patel N, Joseph J, Kirsch S, Hallberg A, et al. Angiotensin type 2 receptor (AT 2 R) and receptor Mas: a complex liaison. Clin Sci. 2015;128:227–34. 35. Cerrato BD, Carretero OA, Janic B, Grecco HE, Gironacci MM. Heteromerization Between the Bradykinin B2 Receptor and the Angiotensin-(1–7) Mas Receptor: Functional Consequences. Hypertens (Dallas, Tex 1979). 2016;68:1039–48. 36. Rubio-Ruíz ME, Del Valle-Mondragón L, Castrejón-Tellez V, Carreón-Torres E, Díaz-Díaz E, Guarner-Lans V. Angiotensin II and 1–7 during aging in Metabolic Syndrome rats. Expression of AT1, AT2 and Mas receptors in abdominal white adipose tissue. Peptides. 2014;57:101–8.
37. Joglar B, Rodriguez-Pallares J, Rodriguez-Perez AI, Rey P, Guerra MJ, Labandeira-Garcia JL. The inflammatory response in the MPTP model of Parkinson’s disease is mediated by brain angiotensin: relevance to progression of the disease. J Neurochem. 2009;109:656–69. 38. Rodriguez-Pallares J, Rey P, Parga JA, Muñoz A, Guerra MJ, Labandeira-Garcia JL. Brain angiotensin enhances dopaminergic cell death via microglial activation and NADPH-derived ROS. Neurobiol Dis. 2008;31:58–73. 39. Jarrott B, Williams SJ. Chronic Brain Inflammation: The Neurochemical Basis for Drugs to Reduce Inflammation. Neurochem Res. 2016;41:523–33. 40. Sun H, Wu H, Yu X, Zhang G, Zhang R, Zhan S, et al. Angiotensin II and its receptor in activated microglia enhanced neuronal loss and cognitive impairment following pilocarpine-induced status epilepticus. Mol Cell Neurosci. 2015;65:58–67. 41. Rodriguez-Perez AI, Borrajo A, Rodriguez-Pallares J, Guerra MJ, Labandeira-Garcia JL. Interaction between NADPH-oxidase and Rho-kinase in angiotensin II-induced microglial activation. Glia. 2015;63:466–82. 42. Bhat SA, Goel R, Shukla S, Shukla R, Hanif K. Angiotensin Receptor Blockade by Inhibiting Glial Activation Promotes Hippocampal Neurogenesis Via Activation of Wnt/β-Catenin Signaling in Hypertension. Mol Neurobiol. 2018;55:5282–98. 43. Phipps JA, Vessey KA, Brandli A, Nag N, Tran MX, Jobling AI, et al. The Role of Angiotensin II/AT1 Receptor Signaling in Regulating Retinal Microglial Activation. Investig Opthalmology Vis Sci. 2018;59:487. 44. Labandeira-Garcia JL, Rodríguez-Perez AI, Garrido-Gil P, Rodriguez-Pallares J, Lanciego JL, Guerra MJ. Brain Renin-Angiotensin System and Microglial Polarization: Implications for Aging and Neurodegeneration. Front Aging Neurosci. 2017;9:129. 45. Valero-Esquitino V, Lucht K, Namsolleck P, Monnet-Tschudi F, Stubbe T, Lucht F, et al. Direct angiotensin type 2 receptor (AT 2 R) stimulation attenuates T-cell and microglia activation and prevents demyelination in experimental autoimmune encephalomyelitis in mice. Clin Sci. 2015;128:95–109. 46. McCarthy CA, Vinh A, Miller AA, Hallberg A, Alterman M, Callaway JK, et al. Direct Angiotensin AT2 Receptor Stimulation Using a Novel AT2 Receptor Agonist, Compound 21, Evokes Neuroprotection in Conscious Hypertensive Rats. Karamyan V, editor. PLoS One. 2014;9:e95762. 47. Bennion DM, Isenberg JD, Harmel AT, DeMars K, Dang AN, Jones CH, et al. Post-stroke angiotensin II type 2 receptor activation provides long-term neuroprotection in aged rats. Arumugam T V., editor. PLoS One. 2017;12:e0180738. 48. Bhat SA, Sood A, Shukla R, Hanif K. AT2R Activation Prevents Microglia Pro-inflammatory Activation in a NOX-Dependent Manner: Inhibition of PKC Activation and p47 phox Phosphorylation by PP2A. Mol
Neurobiol. 2019;56:3005–23. 49. AbdAlla S, Lother H, el Massiery A, Quitterer U. Increased AT1 receptor heterodimers in preeclampsia mediate enhanced angiotensin II responsiveness. Nat Med. 2001;7:1003–9. 50. AbdAlla S, Lother H, Quitterer U. AT1-receptor heterodimers show enhanced G-protein activation and altered receptor sequestration. Nature. 2000;407:94–8. 51. Wilson PC, Lee M-H, Appleton KM, El-Shewy HM, Morinelli TA, Peterson YK, et al. The Arrestin-selective Angiotensin AT 1 Receptor Agonist [Sar 1,Ile 4,Ile 8 ]-AngII Negatively Regulates Bradykinin B 2 Receptor Signaling via AT 1 -B 2 Receptor Heterodimers. J Biol Chem. 2013;288:18872–84. 52. Franco R, Aguinaga D, Jiménez J, Lillo J, Martínez-Pinilla E, Navarro G. Biased receptor functionality versus biased agonism in G-protein-coupled receptors. Biomol Concepts De Gruyter. 2018;9:143–54. 53. Garrido-Gil P, Rodriguez-Perez AI, Fernandez-Rodriguez P, Lanciego JL, Labandeira-Garcia JL. Expression of angiotensinogen and receptors for angiotensin and prorenin in the rat and monkey striatal neurons and glial cells. Brain Struct Funct. 2017;222:2559–71. 54. Hinz S, Navarro G, Borroto-Escuela D, Seibt BF, Ammon C, Filippo E, De, et al. Adenosine A2A receptor ligand recognition and signaling is blocked by A2B receptors. Oncotarget. 2018;9:13593–611.
Figures
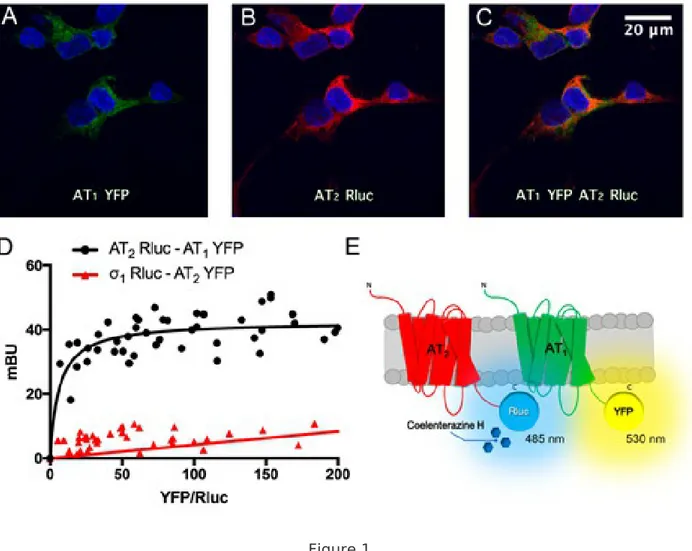
Figure 1 Human AT1 and AT2 receptors interact in a heterologous expression system. Panels A-C: Immunocytochemistry assays were performed in HEK-293T cells expressing AT1R-YFP (1 µg cDNA), which was detected by its own yellow fluorescence (green), and AT2R-Rluc (1 µg cDNA), which was detected by a mouse anti-Rluc antibody and a secondary Cy3 anti-mouse antibody (red). Colocalization is shown in yellow. Cell nuclei were stained with Hoechst (blue). Scale bar: 20 µm. Panel D: BRET assays were performed in HEK-293T cells transfected with a constant amount of cDNA for AT2R-Rluc (0.9 µg) or 1R-Rluc (0.75 µg) (as negative control) and increasing amounts of cDNA for AT1R-YFP (0.5 to 4 µg) or AT2R-YFP (0.1 to 4 µg) (as negative control). Values are the mean ± S.E.M. of 8 independent experiments performed in duplicates. Panel E: Schematic representation of BRET assay: the occurrence of energy transfer depends on the distance between the BRET donor (Rluc) and
the BRET acceptor (YFP). Figure 2 Human AT1 and AT2 receptors interact in a heterologous expression system. Panels A-C: Immunocytochemistry assays were performed in HEK-293T cells expressing AT1R-YFP (1 µg cDNA), which was detected by its own yellow fluorescence (green), and AT2R-Rluc (1 µg cDNA), which was detected by a mouse anti-Rluc antibody and a secondary Cy3 anti-mouse antibody (red). Colocalization is shown in yellow. Cell nuclei were stained with Hoechst (blue). Scale bar: 20 µm. Panel D: BRET assays were performed in HEK-293T cells transfected with a constant amount of cDNA for AT2R-Rluc (0.9 µg) or 1R-Rluc (0.75 µg) (as negative control) and increasing amounts of cDNA for AT1R-YFP (0.5 to 4 µg) or AT2R-YFP (0.1 to 4 µg) (as negative control). Values are the mean ± S.E.M. of 8 independent experiments performed in duplicates. Panel E: Schematic representation of BRET assay: the occurrence of energy transfer depends on the distance between the BRET donor (Rluc) and the BRET acceptor (YFP).
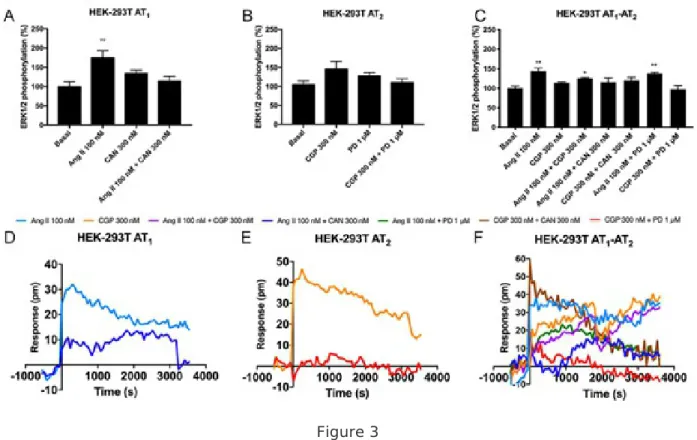
Figure 3 Functional characterization of AT1R-AT2R heteromer in HEK-293T cells. HEK-293T cells were transfected with cDNAs for AT1R (1 µg) and/or AT2R (1 µg). Cells were pretreated with selective receptor antagonists (300 nM candesartan for AT1R or 1 µM PD123319 for AT2R receptors) and subsequently treated with selective agonists (100 nM angiotensin II for AT1R and 300 nM CGP-42112A for AT2R receptors). Panels A-C: ERK1/2 phosphorylation was analyzed using an AlphaScreen®SureFire® kit (Perkin Elmer). Values are the mean ± S.E.M. of 5 independent experiments performed in duplicates. One-way ANOVA followed by Bonferroni’s multiple comparison post hoc test were used for statistical analysis (*p < 0.05, **p < 0.01, ***p < 0.001; versus vehicle treatment (basal)). Panels D-F: DMR tracings represent the picometer-shifts of reflected light wavelength over time. Values are the mean ± S.E.M. 8 independent experiments performed in triplicates.
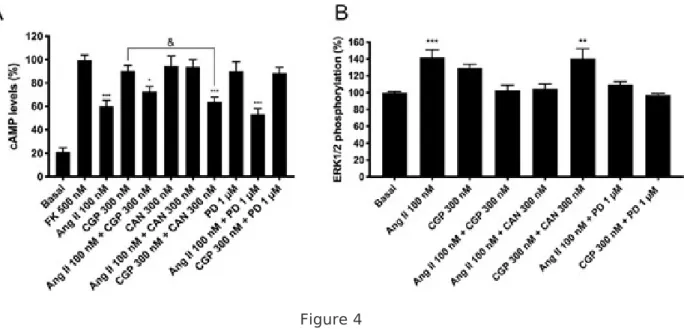
Figure 4 AT1R-AT2R heteromer functionality in primary cultures of striatal neurons. For cAMP (A) or ERK1/2 phosphorylation (B), cells were pretreated with selective receptor antagonists (300 nM candesartan for AT1R or 1 µM PD123319 for AT2R) and subsequently treated with selective agonists (100 nM angiotensin II for AT1R and/or 300 nM CGP-42112A for AT2R). Values are the mean ± S.E.M. of 5 independent experiments performed in triplicates. One-way ANOVA followed by Bonferroni’s multiple comparison post hoc test were used for statistical analysis (&p < 0.05 CGP-42112A treatment in cAMP determinations; and *p < 0.05, **p < 0.01, ***p < 0.001 versus forskolin treatment in cAMP determinations or versus vehicle treatment (basal) in pERK determinations).
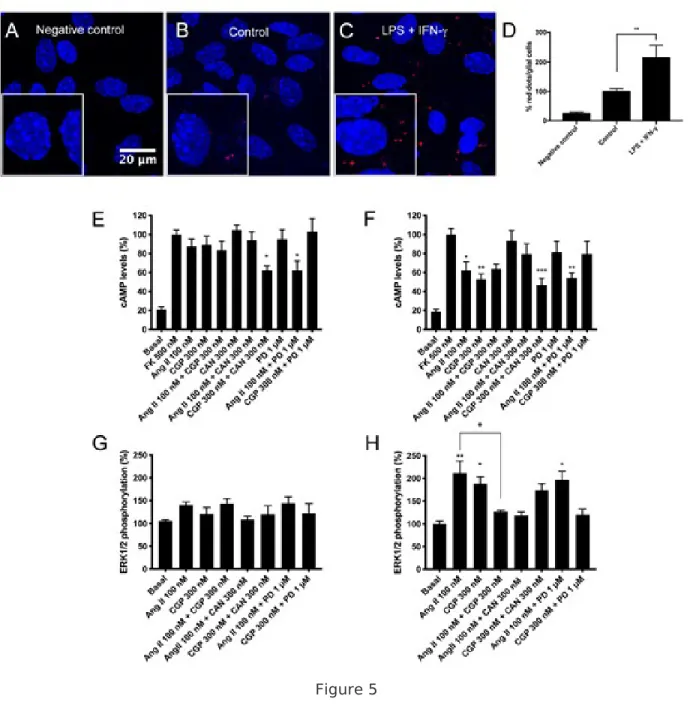
Figure 5 AT1R-AT2R heteromer functionality in microglial primary cultures treated with LPS and IFN-. Panels A-C: Expression of AT1R/AT2R heteromers in primary microglial cultures were determined by PLA, which was performed using specific primary antibodies against AT1 and AT2 receptors (Confocal microscopy images (stacks of 3 consecutive planes) show heteroreceptor complexes as red clusters and Hoechst-stained nuclei (blue). Scale bar: 20 µm. Panel D: Bar graph showing the percentage of red dots/cell respect non-treated cells (**p < 0.01; Student’s t test versus the control condition). Panels E-F: Microglial cultures were incubated for 48 h in the absence (left) or in the presence (right) of 1 µM LPS and 200
U/mL IFN- . Microglial cells were pretreated with selective receptor antagonists (300 nM candesartan for AT1R or 1 µM PD123319 for AT2R receptors) and subsequently with the specific agonists (100 nM Angiotensin II for AT1R and 300 nM CGP-42112A for AT2R receptors). cAMP (E) and ERK1/2 phosphorylation (F) were subsequently measured. Values are the mean ± S.E.M. of 5 independent experiments performed in triplicates. One-way ANOVA followed by Bonferroni’s multiple comparison post hoc test were used for statistical analysis (+p < 0.05 versus Ang II treatment in pERK determinations; and *p < 0.05, **p < 0.01, ***p < 0.001; versus forskolin treatment in cAMP measurements or versus vehicle treatment (basal) in pERK measuremnts).
Figure 6 AT1R-AT2R heteromer expression in brain striatal slices of Parkinson’s Disease (PD) rat model. Panels A-D. PLA assays in striatal slices from the 6-hydroxy-dopamine PD rat model, non-lesioned (A), lesioned (B) and lesioned plus chronically treated with L-DOPA and either lacking (C) or displaying (D) dyskinesias. Confocal microscopy images (stacks of 3 consecutive planes) show heteroreceptor complexes as red clusters and Hoechst-stained nuclei (blue). Scale bar: 20 µm. Panel E: Bar graph showing the percentage of red dots/cell. One-way ANOVA followed by Bonferroni’s post-hoc multiple comparison tests was used to compare the red dots/cell values (***p < 0.001; versus lesioned condition, ++p < 0.01; versus L-dopa non dyskinesia condition).