DOTTORATO DI RICERCA INTERNAZIONALE
in
INGEGNERIA AGRARIA
XXV CICLO
Antonella Celesti
ANALYSIS OF AMMONIA RELEASE AND BEST AVAILABLE PRACTICES TO SUPPORT FARM MANAGEMENT IN THE REDUCTION OF AMMONIA EMISSIONS IN DAIRY HOUSES
Tesi per il conseguimento del titolo di Dottore di Ricerca
Tutor: Ch.mo Prof. Giovanni Cascone
Coordinatore: Ch.mo Prof. Claudia Arcidiacono
UNIVERSITÀ DEGLI STUDI DI CATANIA
Dipartimento di Gestione dei Sistemi Agroalimentari e Ambientali Sezione Costruzioni e Territorio
CONTENTS
ABSTRACT………5
1 INTRODUCTION... 7
1.1 Preface ... 7
1.2 Objective and limits of the study ... 8
1.3 Work organization ... 9
2 SOURCES AND PROCESSES OF AMMONIA EMISSIONS ... 11
2.1 The nitrogen and its molecular forms ... 11
2.2 Ammonia in the environment ... 11
2.2.1 Particulate matter ... 12
2.3 Ammonia produced from manure ... 13
2.3.1 Sources and processes related to nitrogen turnover ... 14
2.4 A review of ammonia concentration measurement techniques ... 17
2.4.1 Ammonia Sampling ... 17
2.4.2 Measurement techniques of ammonia concentrations ... 21
2.4.3 Techniques to measure ammonia emission rate in naturally ventilated barns ... 29
2.5 Models of ammonia emission from naturally ventilated dairy houses 39 2.6 Management practices to reduce ammonia emissions ... 41
2.6.1 Pre-excretion techniques ... 41
2.6.2 Nutritional techniques ... 42
2.6.3 Post-excretion techniques ... 44
2.7 Legislation ... 47
2.7.1 Overview on Legislation to reduce ammonia emissions ... 47
2.7.3 Best Available Techniques (BAT) ... 53
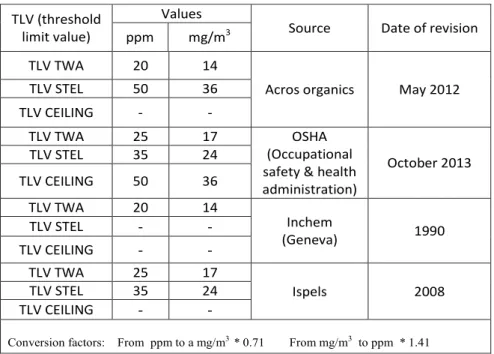
2.7.4 Threshold limits of ammonia (MAC: Maximum allowable concentration)... 54
3 MATERIALS AND METHODS ... 57
3.1 The livestock buildings under study... 57
3.1.1 Building A ... 57
3.1.2 Building B ... 58
3.2 Measurement setup ... 61
3.2.1 Portable measuring devices for ammonia concentration and microclimatic variables ... 61
3.2.2 Instruments for continuous measurement of indoor microclimatic data and outdoor climatic data ... 63
3.3 Sampling... 65
3.3.1 Sampling layout in the buildings analysed and data collection sessions ... 65
3.4 Methods of computation of Ammonia Emissions ... 67
3.5 Statistical Analyses on collected data ... 68
4 RESULTS AND DISCUSSION ... 73
5 GUIDELINES ON THE POTENTIAL APPLICATION OF DEVELOPMENT TECHNIQUES FOR REDUCING AMMONIA EMISSIONS IN EXISTING LIVESTOCK BUILDINGS ... 91
6 CONCLUSIONS ... 95
ABSTRACT
The objective of this thesis work was to verify the levels of ammonia concentrations in different functional areas of naturally ventilated dairy houses, through the measurement of the concentrations of ammonia at different heights from the floor of the breeding environment, also in relation to the main inside microclimatic variables and outside climate conditions.
The research activities were carried out in barns located in an area of the Province of Ragusa highly suited to livestock breeding, where are located most of the naturally ventilated barns present in Sicily (Italy).
In this work, issues of great interest which concern the protection of animal welfare, salubrity within the breeding environment, the operators’ safety in the workplace and the environmental protection have been dealt with through the outcomes of this research which gave a contribution to the analysis of ammonia concentrations and microclimatic variables in breeding environments of dairy houses.
An experimental protocol for measuring ammonia concentration within the breeding environment at different heights from the floor and for the measurement of the main internal microclimate variables and the external climatic ones was proposed.
The ammonia emission values related to the cows housed in the Building A ranged between 0.44 and 0.14 kg/h whereas the values related to the HPU were between 0.31 and 0.10 kg/h/HPU. The Heat balance method yielded ammonia emission values ranging between 0.005 and 0.27 kg/h and 0.004 and 0.19 kg/h/HPU.
A technique for the ammonia emissions reduction has been tested, by using a processing residue of the coffee industry. This technique could be regarded as feasible in this field since the experiment showed a reduction of approximately 50% of the emissions and the choice of this dried vegetal material is suitable due to its easy availability in the territory.
Finally, indications have been obtained to support farmers’ management choices in order to reduce ammonia emissions into the breeding environment. They are based on emission reduction techniques adapted to the specific case study.
1
INTRODUCTION
1.1
Preface
If not properly managed, intensive livestock farms have the potential to cause environmental pollution. Livestock installations and associated activities such as the application of manure on farmland are a significant source of different emissions into air, soil and water. Among gaseous emissions there are to mention unpleasant odours, ammonia, methane and nitrous oxide and dust. Emissions are mainly caused by the decomposition of animal waste (odour, ammonia, nitrous oxide), the digestion of ruminants (methane), the application of manure (ammonia, odour, nitrous oxide) and the feeding and bedding (dust) and barns management.
As regards ammonia (NH3), agriculture is known as the major source of
atmospheric NH3, contributing to 50% of NH3 emissions in the world (Bouwman
et al., 1997), over 90% in Europe (EEA, 2011) and 95% in Italy (ISPRA, 2011). Of this 95% the livestock sector is responsible for about 77% (Buijman et al., 1999).
Ammonia emission from naturally ventilated dairy houses is difficult to be quantified due to the direct relation between the outdoor wind and indoor environment. Moreover, since outdoor wind has a turbulent and time-varying nature it is complex to accurately know where and when high or low velocity gradients are present in the different functional areas of the livestock building. As a consequence, it is not generally known which area of the barn floor covered by the manure is subject to high air velocity gradients.
Besides the effects of ammonia emissions on the environment, the importance of evaluating the ammonia concentrations in livestock buildings regards the necessity to ensure the operators’ safety and animal welfare. In fact, high concentrations of NH3 inside the animal houses also represent potential health
hazards to humans and animals (Reece et al., 1980; Carr et al., 1990; Crook et al., 1991; Wheeler et al., 2000a). Chronic respiratory diseases of swine production facility workers have been attributed to dust and NH3 (Donham et al., 1995).
Animal respiratory diseases, such as sneezing, coughing, or pneumonia, increased when NH3 concentrations were 20÷40 ppm as compared with 5÷15 ppm (Busse,
1993).
In general, the release of ammonia from manure deposited on building floors depends on the characteristics of the manure, livestock management practices, climatic conditions within the buildings, and animal behaviour. To compute ammonia emissions, knowledge of the ventilation rate is also required.
Although studies of agricultural NH3 have increased in recent years, reliable
field measurements of NH3 at animal facilities (animal houses, and manure
storage and treatment) are a major need. Understanding and control of NH3 at
animal facilities depend on sampling/measurement techniques, including devices, instruments, and procedures. Accurate and reliable techniques provide high quality data that are essential to research as well as abatement of NH3 emissions.
In Italy, at present, few research studies, have regarded ammonia concentration surveys and the evaluation of how the different housing types and different techniques of manure management affect the emission of ammonia from livestock buildings, although ammonia concentrations in the breeding environment inside the barn could be of relevance and, as a consequence, ammonia emissions from livestock buildings.
1.2
Objective and limits of the study
The research study reported in this thesis work was carried out in an area of the Province of Ragusa (Sicily, Italy) which is one of the most important livestock breeding areas in the country. In this area, open or semi-open livestock buildings are widespread.
The main objective of this thesis work was to verify the levels of ammonia concentrations in different functional areas of barns for dairy cows, located in the considered area, through the measurement of the concentrations of ammonia at different heights from the floor of the breeding environment, also in relation to the main inside microclimatic variables and outside climate conditions.
The second objective regarded the computation of ammonia emissions from the breeding environment. Although some limits that are described below have affected this computation, an effort to seek for an approximate estimate of the ammonia release in the environment was performed.
An additional objective consisted in looking for possible “Best Available Practices” to support farm management in order to reduce ammonia emissions in the environment.
To achieve these objectives, a wide bibliographic research regarding measurement and computation methods of ammonia emissions in barns for dairy cows and methods of reducing emissions was carried out.
The limits of the work depending on the type of measurement instrument available for the trials can be summarised as follows:
- the measurements of gas concentrations inside the breeding environments were conducted as a succession of measurements on
predefined points through the use of a portable measuring device. Therefore, it was not possible to carry out a continuous and simultaneous recording of data of the concentrations of ammonia in the barns;
- measurements of air velocity in a location inside the barn and wind speed in a location outside the barn were collected. Therefore, it was not possible to make an accurate assessment of air exchanges between the interior and the exterior of the buildings based on simultaneous multiple measurements at the defined inlets and outlets of the barn.
The measuring instruments used in the trials were simpler than the equipments used in the works reported in the literature. However, the simplicity, the lower cost in comparison to those equipments and the good accuracy of the measurements may constitute good characteristics for a tool which could be more easily used by a farmer to control ammonia level. This usage would be suitable especially for the control of the ammonia level in specific areas of the barn, both for animal welfare and for the safety of operator’s work.
1.3
Work organization
In the second chapter of this thesis work, after a description of the molecular forms of nitrogen, the sources and the processes of ammonia emissions in the environment are described. Knowledge of ammonia production and the related release processe is of crucial importance to understand the distribution inside the breeding environments and suggest possible modifications in the barn management routines.
The third chapter of the thesis work gives an overview of the methods for measuring ammonia concentrations and computing ammonia emission rates. In detail, it describes a comprehensive review of ammonia measurement techniques and the models for NH3 emission simulation, as well as the related state of the art
in the application of these methods and models.
The fourth chapter describes the materials and methods of the research. In detail, it describes the breeding environments analysed and the method proposed for the sampling and measurements of ammonia concentrations in some functional areas of the barns under study.
The fifth chapter describes the results obtained from the application of the methods for ammonia concentration measurement and ammonia emission estimates, and provides a general discussion on these outcomes in relation to the observations provided by other researchers on similar experimental trials.
2
SOURCES
AND
PROCESSES
OF
AMMONIA
EMISSIONS
2.1
The nitrogen and its molecular forms
Nitrogen (N), and its molecular form (N2), is the most abundant element in the
atmosphere, hydrosphere and biosphere. However, it is not directly usable by most organisms, due to the large energy required to break its ties (Galloway et al., 2003). The agricultural land is often lacking in N content which is needed to provide optimum levels of nutrition for the crop (Godwin and Singh, 1998). Since the biological fixation of nitrogen is not sufficient to cover the needs of the crops, N fertilizers are widely used in order to enhance the soil supply of such macroelement and to increase the food production.
Anthropogenic flows of N constitute the mayor component of the earth’s nutrient cycles (Galloway, 2008), producing positive effects, as increase of yields, and negative effects as the release of reactive form of N (Nr) in the environment. In particular, significant fractions of the mobilized N are lost towards atmosphere by gaseous emissions of N compounds such as ammonia (NH3), nitrous oxide
(N2O), oxidised nitrogen (NOx) and nitric acid (HNO3), and through leaching and
runoff losses of nitrate (NO3-) to ground and surface waters (de Vries et al., 2001). Three N forms are mainly involved in the impact of the N excess on the environment: NOx mainly emitted by combustion processes; N2O formed by
nitrification and de-nitrification processes in the soil; reduced nitrogen, including NH3 and ammonium (NH4+), mainly formed by agricultural practices and from
livestock farming.
2.2
Ammonia in the environment
Ambient NH3 assumes an important role and growing interest among different
atmospheric N species, as a key of the future negative impacts of N on terrestrial ecosystems (Sutton, 2006). In particular, the environmental issues due to NH3
include mainly acidification of soils, eutrophication of water with loss of biodiversity, human health and the long-range transport of sulphur (S) and N (Sutton et al., 1993; Asman et al., 1998; Erisman et al., 2001; Harper, 2005). Moreover, by 2020 it is estimated that NH3 will be the largest single contributor to
acidification, eutrophication and formation of secondary particulate matter (Ammann et al., 2005).
Dry or wet deposition of ammonium particles to the ground contributes to soil acidification (van Breemen et al., 1982; Galloway, 2003), where NH4+ is nitrified in NO3-, with the realising of protons (H+). Soil pH will decrease when the buffer capacity of the soil is exhausted, causing changing in soil chemistry. In acidic
of base nutrients (Ca2+, Mg2+, K+, P) is reduced (Erisman and de Vries, 2000; Galloway, 2003). This effect may be worsened in natural systems where N is a limiting nutrient, causing increasing growth of the vegetal species and increased demand of these base cations (van der Eerden et al., 1998). The excess of N supply in natural or semi-natural ecosystems influences their structure, competitive processes, sensitivity to stresses and functionality of vegetal species. Furthermore, NH3 by means of NH4+ aerosol depositions, if not absorbed by the
vegetation, may lead to increased environmental loads, such as NO3- in the groundwater, and producing indirect greenhouse gas (GHG) emissions as nitrous oxide and ozone (O3) (Galloway et al., 2008; Sutton et al., 2011).
Direct deposition of NH4+ aerosols to water contributes significantly to the eutrophication phenomenon, with consequent negative effects on aquatic life and biodiversity. Surface freshwater ecosystems (wetlands, streams, lakes and rivers) receive most of their N from atmospheric deposition and from biological nitrogen fixation (Galloway, 2003), where an increase in N deposition leads to degradation of the resource. Marine ecosystems, receiving N from freshwater, groundwater and from atmospheric depositions, result frequently in excessive algae growth with consequences on biota due to hypoxic status of water.
2.2.1 Particulate matter
Particulate matter (PM) is defined as particles of solid or liquid matter suspended in air. They are characterized by their origin (primary and secondary particles), their particle size, their composition and their potential physiological pathways.
Primary emissions are directly emitted by a source. Secondary particles are formed in the atmosphere by chemical reactions of certain gases that either condense or undergo chemical transformation to a species that condenses as a particle (Seinfeld, 1986). (The expression “secondary particle” is also sometimes used to describe redispersed or resuspended particles.)
Ammonia is a chemically active gas and readily combines with nitrate (NO3-) and sulphate (SO4-) in acid cloud droplets to form particulates (Asmanet al., 1998). The formation of particulates prolongs their existence in the atmosphere and therefore influences the geographic distribution of acidic depositions. The emitted NH3 is subsequently deposited to land and water, either by dry deposition
of NH3 or by dry and wet deposition of ammonium (NH4+) (Asman and Van
Jaarsveld , 1991).
Atmospheric particles formed by the reactions of NH3 in the troposphere, could
interfere directly with radiation and energy balances through the increasing of earth albedo, or indirectly with clouds formation. Despite this effect cannot be quantified precisely, it contributes to a negative radiative forcing of about 1 W m-2
(Schimel et al., 1996). Once released from the sources, NH3 is rapidly dispersed in
the turbulent atmosphere, going toward chemical reactions by forming ammonium aerosols and incorporating in precipitation. Approximately 50% of the NH3
emitted does not react in atmosphere and returns as gas in dry deposition to natural surfaces, particularly wet surfaces and vegetation, within few kilometres (Asman, 1998; Ferm 1998).
Estimates of the atmospheric lifetime of NH3 range from approximately 0.5
hours to 5 days (Fowler et al., 1997). This short lifetime is the result of rapid conversion of NH3 gaseous to NH4+ on the liquid phase of atmosphere, causing
wet deposition on surface.
PM10 is the fraction of suspended particulate matter in the air with aerodynamic
diameters less than or equal to a nominal 10 μm. These particles are small enough to be breathable and could be deposited in lungs, which may cause deteriorated lung functions. In fact, particulate matter (PM) is considered to be a major threat to human health through respiratory cardiovascular disorders, especially by long term exposure of PM smaller than 2.5 μg (PM2.5), according to WHO (2005). At
the national level the incidence of agriculture in the formation of PM is about 4% of PM2.5, and 11% of PM10 (ISPRA, 2011).
2.3
Ammonia produced from manure
Ammonia emission is the transfer function of NH3 to the free air phase from
the air-phase in immediate contact to the ammoniacal solution. The concentration of NH3 in air close to the manure surface is in equilibrium with the dissolved NH3
(Génermont and Cellier, 1997). As the air from the atmosphere passes over the manure surface, NH3 from the manure surface is transported away horizontally by
advection and vertically by turbulent diffusion.
Once manure is excreted, microbial processes begin to release manure nutrients in forms that can be taken up by plants or readily transported in the environment. Nitrogen is excreted in the form of urea and uric acid in the urine of mammals and birds, respectively. Conversion of nitrogen in the form of urea or uric acid requires the enzyme, urease, which is excreted in the feces. This conversion occurs rapidly, often within a few days. The breakdown of complex organic nitrogen forms in the feces occurs more slowly (within months or years). In both cases, the nitrogen that is released exists predominantly in the form of ammonium (NH4+) under acidic or neutral conditions, or in the form of NH3 at higher pH
levels.
The relationship between NH4+, NH3, and pH (Fig.1) plays an important role in
determining the fate of manure nitrogen because NH3 is much less soluble in
water than NH4+. Therefore, NH4+ is not readily volatilized from manure, whereas NH is rapidly converted to a gaseous form and emitted from manure. The rate of
NH3 volatilization is influenced by the concentrations of manure NH3 and urea,
temperature, air velocity, surface area, and moisture.
Understanding how NH4+ and NH3 are formed, the characteristics of these
compounds, and the effects of various conditions on their environmental fate is the key to understanding how manure can be managed to minimize NH3
emissions.
Fig.1 Relationship ammonia (NH3) and ammonium ( NH4+) as
a function of pH. Source: G. Becker et al., 2001 2.3.1 Sources and processes related to nitrogen turnover
Ammonia originates from faeces and urine. Both the quantity and the composition of the faeces and urine are of interest when studying ammonia emission. Faeces are defined here as the fresh excreta from animals, while manure (solid) and slurry (liquid) are the mixture of faeces and urine as they are encountered in the animal house. Cows excrete their superfluous nitrogen as urea in the urine and undigested proteins in the faeces. Uric acid and undigested proteins are the main nitrogen components in the faeces, representing about 70% of the total nitrogen. Urea in urine and undigested proteins in faeces contribute also 70% to the total nitrogen excretion of cows, but this can vary considerably. The nitrogen components of uric acid, urea, ammonia/ammonium and undigested proteins are potential sources for ammonia volatilization.
2.3.1.1 Release of ammonia
Ammonia is mainly a product of the degradation of nitrogenous compounds. The biochemical degradation processes of uric acid (1), urea (2) and undigested proteins (3) are complex, but can be simplified as follows (Koerkamp et al., 1998):
3 2 2 2 4 3 4 5H O N 1.5O 4H O 5CO 4NH C (1) 3 2 2 2) 2 (NH H O CO NH CO (2) 3 NH proteins Undigested (3)
All three processes are affected by microbial action. Various authors have described the aerobic decomposition of uric acid to ammonia (Eqn. 1). According to these descriptions, water and oxygen must be available, and ammonia and carbon dioxide arise as products of this degradation process. The enzyme urease, commonly present in microorganisms, is specific to this reaction with uric acid. The degradation of uric acid and proteins is positively influenced by temperature, pH and moisture content. The degradation process of urea (Eqn. 2) follows the law of Michaelis-Menten and is positively influenced by the urease activity, pH and temperature.
The enzyme urease is produced by microorganisms that are commonly present in manure. Elzing et al. (1992) described the breakdown of urea in cattle urine on a dirty slatted floor. They measured a total breakdown of urea within several hours under normal housing conditions.
Taiganides (1987) gives a scheme for the anaerobic degradation of organic material into N, C and S compounds. A review of microbial transformation of inorganic nitrogen is given by Painter. Three main processes can be distinguished. First, the fixation of dinitrogen (N2) leading to ammonia production (aerobic or
anaerobic). Second, due to nitrification (autotrophic or heterotrophic), ammonium can be converted to nitrite (
2
NO ) and hence nitrate (NO3). Autotrophic
nitrification is considered to be most important, in which case sufficient oxygen must be available. Third, nitrate can be utilized by microorganisms either for its nitrogen (assimilation-synthesis of N), or for its oxygen (dissimilation). For assimilation, ammonia is generally preferred to nitrate, since nitrate first has to be reduced to ammonia. The end product of the dissimilation can be nitrite (
2
NO ),
nitric oxide (NO), nitrous oxide (N2O) or dinitrogen (N2). If any of the last three
are formed, the process is called denitrification. For dissimilation the conditions must be anaerobic or nearly so.
2.3.1.2 Volatilization of ammonia
The ammonia in manure or litter is liable to volatilization to the surrounding air. Before being liberated into the air, ammonia is involved in equilibria in the liquid (l) and gas (g) phase, as in the Eqns (4)-(7):
l NH l H
The ammonium-ammonia equilibrium is influenced by temperature and pH. Below a pH of 7, nearly all ammonia is bound as ammonium and not liable to volatilization. Higher temperatures favour ammonia concentrations, because of the positive influence of temperature on the dissociation constant Ka, which is defined as:
NH3 H3O / NH4
Ka (5)
The volatilization equilibrium of ammonia to the gas phase, follows Henry’s law for dilute systems,
) ( ) ( 3 3 l NH g NH (6) ) , ( ) , ( 3 3 g manure NH g air NH (7)
The partial pressure of gaseous ammonia, NH3 (g) is proportional to the NH3
(l) concentration. The volatilization of ammonia from manure to air, is defined as the mass flux. This flux is generally defined as the product of difference in partial pressure between the two media and a mass transfer coefficient. Higher partial pressure difference increases the flux. Mass transfer coefficients increase with increasing air velocity. The ventilation rate and pattern affect not only the global internal climate, but also the local climate above the manure and litter.
2.4
A review of ammonia concentration measurement
techniques
Understanding and control of NH3 at animal facilities depend on
sampling/measurement techniques, including devices, instruments, and procedures. Accurate and reliable techniques provide high quality data that are essential to research as well as abatement of NH3 emissions.
To obtain accurate information about NH3 at animal facilities, suitable
measurement techniques have to be adopted and one or more measurement variables have to be chosen depending on measurement objectives. These variables include NH3 concentration, air exchange rate (or ventilation rate), air
temperature, and air pressure.
Most NH3 concentration measuring devices provide direct reading in
volumetric concentrations. However, mass concentrations are required to calculate NH3 emissions. The volume of gas depends on temperature and pressure and is
therefore not constant. When converting from volumetric concentration to mass concentration, the volumetric concentration is multiplied by the molecular weight and the pressure, and divided by the gas constant and the temperature. Temperature and pressure therefore need to be known. However, although measurement of air temperature was often included in published works, air pressure measurements are seldom found. Atmosphere pressure varies between about 980 and 1040 mbar, a 6% variation, or a ±3% from standard atmosphere, which is often assumed. The measurements of temperature and air pressure are relatively easy with few technical challenges. Sampling and measurement methodologies applied at animal facilities are summarized in fig. 1 and some of them will be described in the following sections.
2.4.1 Ammonia Sampling
2.4.1.1 Location and time of sampling
The necessity of selecting location and time of sampling is obvious, because there are temporal and spatial variations of NH3 concentration in animal buildings
and open-air facilities for manure storage and treatment. An animal building is a ventilated and imperfectly mixed air space, where temperature and concentration gradients exist. Changes in room temperature and building ventilation usually follow diurnal and seasonal patterns. Although ventilation in the building creates air mixing, it can also increase the spatial concentration variations in situations when it dilutes NH3 at some locations more than other locations. Field studies
have confirmed non homogeneity of NH3 concentrations in livestock houses
Tab.1 Overview of techniques for the measurement of ammonia concentrations (Source: Ni et al., 2001)
2.4.1.2 Selection criteria of sampling techniques
Three main sampling methods currently applied in field tests are closed, point, and open-path methods. The differences among the three methods are the spatial coverage by the sampling devices. The closed method collects samples from an enclosed surface area. The point method and the open-path method target air at certain points and in a narrow optical path within a three-dimensional zone,
respectively. Depending on the sampling devices, the point sampling method can also be divided as two sub-methods: the passive exposure method and the active extraction method, which can be localized or centralized.
The closed sampling method involves a physical enclosure or chamber to create a limited headspace over a selected piece of NH3 release surface. The
‘‘static’’ chamber does not have air exchange between the outside and inside of the chamber and has thus far only been used in investigations of NH3 release from
soil. The dynamic sampling chambers have an open bottom and are equipped with one or more air inlets and one or more outlets. The chamber is placed on the floors of animal buildings or on the surfaces of liquid or solid manure that releases NH3 thus isolating the release surface from its surroundings. The equipment and setup costs of the closed method are low, however, a sampling chamber is intrusive and alters the facility’s natural conditions and gas concentration profile.
Point sampling is the method in which samples are taken at a selected single point or at multiple points at animal facilities. Unlike closed sampling, the sampling location of this method can be at different heights from the NH3 release
surface or at the air inlet/exhaust of a building. Exposure sampling uses passive sampling devices or sensors and therefore does not require sampling pumps. It can be a simple procedure when using measuring devices, such as detection tubes, where sample air is diffused to passive NH3 samplers/sensors for obtaining a
small number of time weighted average (TWA) concentration data. The cost of point sampling varies greatly because this method has different variations. The exposure method can have very low equipment and setup cost due to its simplicity. However, it can also be very high if a complicated micrometeorological sampling system is involved. Point sampling can be used for different study objectives. Samplers and sampling probes can be easily located at the animal and human breath zones. The method is flexible for different sizes of studies, ranging from a small emission source to an entire commercial animal farm. This method is basically nonintrusive and does not disturb the NH3 source
and its surroundings. It is the most widely used sampling method in animal buildings.
Open-path sampling uses optical detection devices, which consist of an emitter telescope and a receiver/detector. The source light from the emitter, ultraviolet (UV) or infrared (IR), is beamed in one direction over a certain distance (hence an open path), which contains gaseous NH3, to the
receiver/detector. Its sampling equipment and setup cost can be from low to medium depending on the complexity of the research objectives. It is not intrusive to the system being measured and there is also no adsorption of NH3 on sample
transporting system (e.g., tubing and fitting). Large areas can be investigated and the detection limit is very low. However, different emission sources lying close to
each other cannot be distinguished from each other, and in general it is not easy to use for animal exposure study inside the barns.
Sampling location and time are critical issues to obtain high quality data. Different sampling locations may result in wide variations in measurement data because of spatial NH3 differences. Measurements of varying concentrations that
cover excessively short periods produce data with serious temporal limitations. However, measurement objectives play an important role in selecting sampling location and time. For example, for animal or human exposure studies, sampling locations should be in animal or human respiration zones, whereas the best sampling locations are the building air exhausts for emission measurement.
In mechanically-ventilated negative-pressure animal houses, the sampling position can be chosen at the exhaust fans for emission study. The advantage of this technique is that the gas concentration in the exhaust represents the outgoing gas concentration. Since the ventilation rate can also be measured in the exhaust(s), it is favorable for obtaining relatively accurate gas emission data. This sampling technique was reported by Berckmans and Ni (1993), Hartung et al. (1997), and Heber et al. (2001).
In naturally-ventilated animal houses, since indoor ventilation is tightly connected to outdoor wind speed and direction, difficulties are encountered in identifying the openings as inlet or outlet and their changes with time. Therefore, the sampling positions are usually uniformly distributed points over the area of the openings.
The temporal variations of NH3 concentrations demonstrated that it is
important to select proper sampling time. Sampling time should be arranged to cover peak and valley concentrations during the day, especially when there are significant temperature and airflow rate fluctuations, to obtain daily mean concentration, whether short duration sampling (e.g. active gas detection tube) or long-duration sampling (e.g. passive gas tube or wet chemistry) techniques are used. Based on the same principle, sampling should be designed to cover the low concentration season (usually summer) and high concentration season (usually winter) if an annual mean concentration is to be obtained. (Ni et al, 2001)
It is clear that low frequency sampling results in poor representation of the true NH3 fluctuation pattern and therefore unreliable mean NH3 concentrations. The
higher the sampling frequency is, the better the data resolution, and the more accurate the mean value. According to the Nyquist Theorem, the sampling frequency should be at least twice the maximum frequency of the signal that is being sampled (Finkelstein and Grattan, 1994). Of course, high frequency sampling is subject to some technical restrictions like the capacity and response time of the measuring device.
2.4.2 Measurement techniques of ammonia concentrations 2.4.2.1 Selection criteria of measurement techniques
Selection of measurement techniques should be based on research objectives, coupled with the existing capabilities of the research institution and the budget constraints of the research. Cost of the techniques is one of the most important factors to be considered in almost all research projects. Thus, capital and operating costs may need to be assessed with the performance of the technique. A single-use sensor can only provide one measurement although it is relatively inexpensive. If large number of measurement data is required, the cost per measurement using a high-priced instrument with multi-use sensors may be less expensive than using low-price single-use sensors. In many cases, small numbers of short-term samples cannot satisfy the accuracy requirements of a careful field investigation. Techniques that produce large quantities of data should therefore be considered. Some expensive instruments, like IR analyzers and NH3 analyzers, are
usually only used at institutions conducting intensive research on agricultural NH3.
Standard wet chemistry requires analytical instruments that may already exist at many institutions. When the cost of analytical instruments does not need to be considered, wet chemistry methods are inexpensive and affordable techniques. They are especially useful with small sample numbers. The pH-paper-based test kits are appropriate for obtaining simple indications of in-building NH3
concentrations when accuracy is not a priority.
Applications of high and low sensitivity measuring devices are generally related to indoor and outdoor NH3 measurements, respectively.
Measuring devices with short response times (e.g. less than 2 min) are required to properly study the dynamic behavior and diurnal variations of NH3
concentrations. Sensors with long response times, e.g. passive gas tubes, are very good when only TWA (time –weighted-average) data are needed.
2.4.2.2 Classification of measurement techniques
The different techniques are classified according to analytical methods (wet or dry), sensitivity, delivery of measurement results (direct or indirect readout) type of sensor use (single or multiple use), method of sampling air delivery (active or passive sampling), response time.
- Wet and Dry
According to Kamin et al. (1979), analytical methods of NH3 can be classified
as “wet method”, which uses an aqueous medium, and “dry method”, which is the method of direct analysis of NH3 in the gas phase.
- Active and Passive Sampling
An active sampling technique needs a pump, whether hand or electric powered, to force the sample air flowing to the sensor. Techniques with active sampling also enable transportation of sample air through sampling tubing to realize multi-point measurements with a single set of measuring device.
A passive sampling technique lets air diffuse into the sensor, or lets air stay “as is” in the open measurement point, thus a pump is not required. Sensors for passive sampling need to be placed right at the sampling location during measurement. Passive sampling depending on diffusion takes longer to finish a measurement. Because of this, it can provide time-weighted-average (TWA) concentration in a single point measurement. Some active methods (e.g. wet chemistry using acid traps) also provide TWA concentrations.
- Readout
Direct readout is an important feature, especially for field measurements. Techniques with direct readouts provide an immediate visual display of NH3
concentration right after the measurement is completed. Most of the reported techniques provide direct readout. Some of them are followed by automatic data retrieving and processing.
Techniques with indirect readout require a chain of procedures and devices; for example, trapping NH3 in acid collection medium followed by laboratory analysis
of the medium with wet chemistry methods. Compared with the direct readout, the indirect readout method takes more time to obtain results and is not suitable for large numbers of measurements.
- Sensor Life
The sensor in an NH3 measuring device is the material or part that undergoes a
physical or chemical change when exposed to sample air. Single measurement techniques adopt disposable sensor materials that cannot be re-used. The gas detection tube is a typical single use sensor. In wet chemistry methods, the NH3
collection medium is used only once. Continuous measurement techniques can provide many concentration readings over time, usually in the form of electronic signals that can be easily recorded and processed. Sensor materials for these devices usually do not need to be replaced, with the exception of EC sensors (e.g.
Dräger unit that has a sensor life of 18 months). The cassette needed with the Chemcassette Gas Monitor is a single use sensor, although one cassette can provide multiple readings.
- Sensitivity
Sensitivity is the capability of a measuring device to discriminate between measurement responses representing different levels of a variable of interest. Sensitivity is determined from the value of the standard deviation at the concentration level of interest. It represents the minimum difference in concentration that can be distinguished between two samples with a high degree of confidence (USEPA, 1998).
Some of the techniques were reported to be highly sensitive, for example, the method of converting NH3 to NO followed by NOx analysis is sensitive at the ppb
level. Other techniques provide sensitivity at ppm level, e.g. NH3 detection tubes.
Sometimes high sensitivity techniques are called analytical techniques, which provide quantitative data, and low sensitivity ones are called detection techniques, which provide qualitative or semi-quantitative data.
- Response
Response is a measure to evaluate how quickly or slowly a measuring system can react to NH3 and present correct concentration readings. Manufacturers use
response time (TEI, 1995), time needed for an instrument to reach from 0 to 90% at zero to span difference in gas concentrations, to describe specifications of the instrument. The response of passive diffusion sampling can be as long as 8 or 24 h.
2.4.2.3 Analitical method and equipment description
The description of the analytical methodand equipment related to some wet methods is reported below.
- Colorimetry methods
These methods (e.g. Colorimetry-indophenol, Colorimetry-Nessler, Photometry, Conductimetry, Titrimetry Photometry- Nessler,) rely on collecting gaseous NH3 into a suitable acid solution and then performing concentration
determination. The volume of air passed through the scrubber is recorded and the NH3 concentration in the air is calculated (Hashimoto, 1972). With wet methods,
once valid samples of ammonium ions are obtained in solution, it is relatively simple to arrive at final analytical results in the laboratory. The most commonly used acid traps for measuring NH3 at animal facilities include boric acid (H3BO3)
Guingand, 1997; Pfeiffer et al., 1993; Jiang and Sands, 2000), and orthophosphoric acid (Asteraki et al., 1997; Kay and Lee, 1997; Misselbrook et al., 1998).
The ammonia captured in the acid can be assayed e.g. by colorimetry. The method is simple, cheap, reliable and suitable for low concentrations of ammonia in air, although only the average concentration over a long sampling time in hours may then be possible. The main drawback of the method is the high labor input and the fact that it is basically non-continuous.
- pH Test Paper Methods
Moum et al. (1969) developed a very simple method by employing pH test paper and neutral distilled water as an NH3 trap. The measuring range was 0–100
ppm and the accuracy was ±5 ppm. One follow-up use was tested by Seltzer et al. (1969). The method is inexpensive and provides direct in-situ readout. However, it has low sensitivity and precision.
The description of the analytical method and equipment related to some dry methods is reported below.
- Gas Detection Tubes
Gas detection tubes are based on adsorption of tested air pollutant on solid surfaces accompanied by a color reaction. The most obvious advantage of the gas detection tube is its operational and functional simplicity. There are two types of disposable tubes: active sampling tube and passive sampling tubes. Tubes with different measurement ranges are available. Usually, the sensitivities of the tubes are too low for measuring outdoor NH3 concentrations.
Active sampling involves a hand-pump that sucks a pre-defined volume of air per stroke. Both ends of the test tube are sealed when manufactured and are cut open just before measurement. The open-end tube is inserted tightly into the pump connector. By pumping the hand-pump, the air sample flows through the tube. The color that arises is evaluated to assess the NH3 concentration. Active gas
tubes from five different manufacturers have been used for NH3 measurement at
animal facilities. The Dräger Tube is probably the most widely used gas tube product.
Like the active tubes, the passive sampling tubes are also sealed before using. However, only one sealed end of passive tube is broken open to commence measurement. The opened tube is exposed at the selected sampling location for a specific time, usually several hours. The gas concentration indicated in the tube should be interpreted with the exposure time.
The diffusive sampler is direct-reading in the product of concentration and time of exposure (i.e. in p.p.m./h), but its lower limit of concentration is 1,8 mg/m3 (2.5 p.p.m.) and its coefficient of variation (20÷25%) is higher than that of the long-term detector tube.
- Fourier Transform Infrared Spectroscopy
Fourier Transform Infrared (FTIR) spectroscopy is a technique involving the interaction of IR electromagnetic radiation with the test sample. The technology has been called interferential spectroscopy; multiplex; Fourier spectroscopy; interferometric spectrophotometry, or Fourier transform spectroscopy through its development by physicists and manufacturers over the years. The acronym FTIR is almost universally used by chemists to refer to the technique (Johnston, 1991). The Fourier transformation is a mathematical manipulation that relates a signal, curve, or algebraic function to its frequency content. In Fourier spectroscopy, the output signal is known as an interferogram, and is produced by an interferometer. As the movable mirror of the instrument is gradually displaced, a cycle of maximum and minimum intensity recurs. It yields specific information about the chemical structure of organic and inorganic compounds based on the unique vibrational modes of different chemical bonds. The FTIR spectrum is rich with information because each vibrational mode absorbs a specific wavelength of IR radiation. Each bond within a molecule may have several vibrational modes. The FTIR absorption spectrum is a "fingerprint" for a particular molecule that can be compared with reference spectra of known compounds, thereby aiding in the identification of unknowns and providing unambiguous confirmation of the identity of "known" materials.
A few of the many models of FTIR spectroscopy have been used for NH3
measurement at animal facilities. A FTIR Spectroscope K300 with a White-Cell was used in Germany (Neser et al., 1997). Air samples were pumped into or through a special optic cell (White-cell), which used a series of mirrors to create a lengthened light path of 8 m (Amon et al., 1997).
In FTIR, software is used to carry out Fourier transforms, in order to ‘unscramble' the absorption peaks from each gas in a mixture of gases (Kolb et al., 1995). Thus, for example, interference from water vapour can be overcome and a good measurement of ammonia concentration can be obtained (Krahl et al., 1996). Systems based on flow-through cells and on long open paths both exist. A reading can be obtained typically once every minute, or, with some sacrifice of accuracy, once every few seconds (Phillips et al., 2000). A detection limit for ammonia of 1.1 mg/m3 (1.5 p.p.b.) has been reported (Biermann et al., 1988). Disadvantages include the high capital cost of a system and the need for very frequent and careful re-calibration with expensive standard gas mixtures and for an experienced operator (Phillips et al., 2000).
- Photo Acoustic Multi-gas Monitor
In Photo Acoustic Spectroscopy (PAS), the gas to be measured is irradiated by intermittent light of pre-selected wavelengths. The gas molecules absorb some of the light energy and convert it into an acoustic signal, which is detected by a microphone. The general principle of the PAS system is developed by Innova AirTech Instruments A/S, Ballerup, Denmark. The PAS monitor can automatically measure multiple gases with a single instrument. When gas samples are drawn from ambient air around the analyzer, the measurement time is approximately 30 s for one gas or water vapor, and about 120 s if five gases plus water vapor are measured. Increasing the length of the sampling tube increases the time required to pump in a new air sample and therefore increases the measurement time. The PAS requires less frequent calibration as compared with NOx analyzers. However, its investment is relatively high and it is subject to interference of water at high relative humidities (Ni et al., 2001).
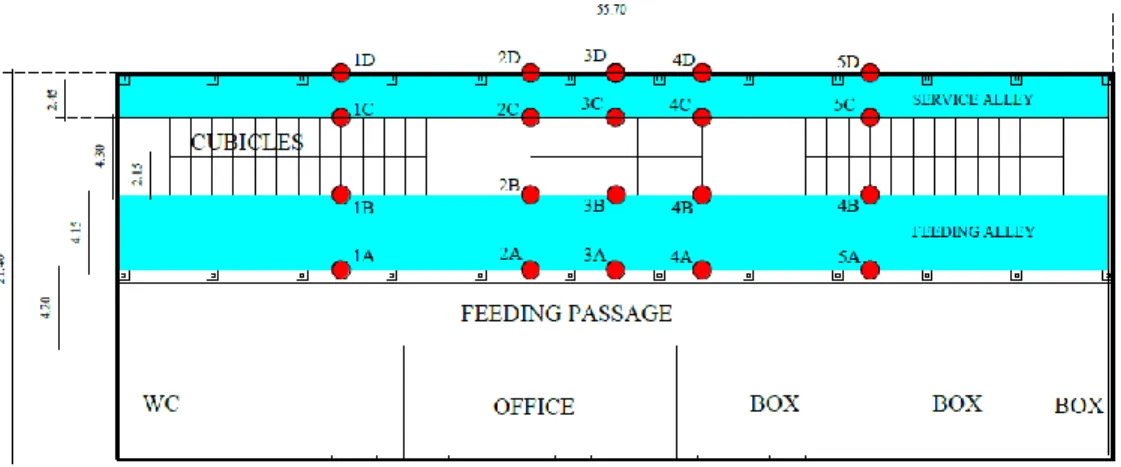
C.K. Saha et al. (2013) carried out measurements on concentrations of carbon dioxide (CO2), NH3, CH4, and N2O which were measured continuously inside the
barn at eight uniformly distributed points and outside the barn at four points (Fig. 2) for the specific periods. Gas concentrations were measured using an infrared photo-acoustic analyser (INNOVA 1312, Innova AirTech Instruments, Ballerup, Denmark) at 12 sampling points. The detection thresholds of the gases were: 1.5 ppm for CO2, 0.4 ppm for CH4, 0.2 ppm for NH3 and 0.03 ppm for N2O.
The results showed that NH3 emission varied seasonally following outside
temperature whereas CH4 emission did not show clear seasonal trend. Daily
variation of CH4 emission was less pronounced than NH3. The average NH3 and
CH4 emissions between 6 a.m. and 6 p.m. were 66% and 33% higher than the
average NH3 and CH4 emissions between 6 p.m. and 6 a.m., respectively for all
seasons. The significant relationships (P < 0.0001) between NH3 and influencing
factors were found. They included outside temperature, humidity, wind speed and direction, hour of the day and day of the year. The significant effect (P < 0.0001) of climate factors, hours of the day and days of the year on CH4 emission might be
directly related to activities of the cows.
- Non-dispersive infrared (NDIR) analysers
This method measure the spectral absorption of a gas at one spectral band of the IR spectrum. The spectral dispersion of the absorption spectrum of the gas is not used (Phillips et al., 2000). In general, the instrument consists of an IR source, an absorption chamber with windows, and a radiation detector. The IR radiation absorbed is a measure of the gas concentration in the chamber. To enhance the selectivity and sensitivity of NDIR analyzers, many different ways of optimizing the IR light source, absorption chamber and detector have been developed (Janac et al., 1971).
- Ultraviolet Differential Optical Absorption Spectroscopy
In the ultraviolet differential optical absorption spectroscopy (UV DOAS) method, an emitter-receiver set creates a light path in a detection zone. Light is generated by a xenon lamp in the emitter and projected to the receiver. Each gas in the detection path absorbs different parts of the light spectrum in a unique way. The absorption is recorded using a spectroscope.
The detection limit depends on the length of the light path and the averaging time of the measurement. The detection limit for ammonia is (Mennen et al., 1996) approximately 1 p.p.m. The light source (high-pressure xenon lamp) emits radiation in the UV range which is focused on the receiver connected to a fast scanning spectrometer. These instruments use a database of calibrated absorption spectra of gases to interpret the differential absorption spectrum sampled. (Phillips et al., 2000). The calibrated absorption spectra should be produced on the instrument with which it is measured (Spellicy et al., 1991). If available, absorption spectra of interfering gases can be used for correction (Hollander, 1993b). The UV DOAS system uses narrow light beams, which makes keeping transmitter and receiver aligned a difficult job under field conditions (Klarenbeek et al., 1993). Under these conditions, the process of aligning the system should be automated.
- Chemiluminescence Analyzer
Chemiluminescence (CL) NH3 analyzers involve an indirect measurement of
NH3 based on converting NH3 to nitric oxide (NO) and then performing NO
analysis by CL method. The NH3 content is obtained by either chemical or
mathematical subtraction of the background NO signal (Pranitis and Meyerhoff, 1987). This technique requires two instrument modules, an NH3 converter and an
NOx analyzer.
A chemiluminescence detector can be used to measure ammonia concentrations, provided ammonia is first oxidized to nitric oxide. When the nitric oxide is further oxidized within the instrument, using ozone, nitrogen dioxide is produced, in an excited state. The nitrogen dioxide molecules return to a lower energy state by releasing photons. This electromagnetic radiation has a wavelength around 1200 nm (Phillips et al., 2000).
- Electrochemical Sensor
Electrochemical (EC) NH3 sensors consist of two electrodes and detects NH3
on the measuring electrode, N H e NH 6 6 2 3 2
and on the counter electrode,
O H e H O2 6 6 3 2 2 / 3
Electrochemical sensors provide direct readout and continuous measurements. Several EC sensors have been tested or used at animal facilities. Hoy et al. (1992) and Hoy and Willig (1994) described a Series 6004 Quadscan Gas monitoring system, connected with a printer, for continuous measurement of NH3. This
system consists of two main components, the Series 6004 gas receiver and three Series 4485 NH3 gas transmitters.
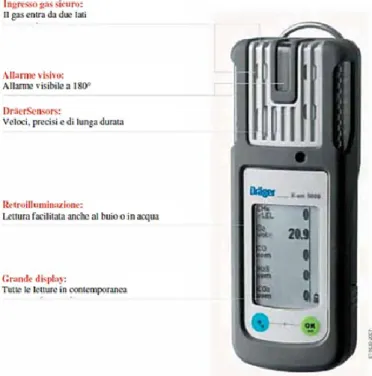
Heinrichs and Oldenburg (1993) used a Dräger apparatus for measuring NH3 in
a fattening pig house, but did not provide details of the system. A Dräger NH3
sensor (Polytron 2, Dräger Safety, Inc. Pittsburgh, PA) connected to a data logger was used in broiler houses (Wheeler et al., 1998; 1999; 2000a). The sensor was battery powered. Its scale was 0÷300 ppm and its precision was ±3% or ±9 ppm. The sensor was successful at a reasonable cost for research or demonstration projects. The unit consisted of a multi-gas body (Polytron 2) with a sensing unit. The multi-gas body can be combined with specific sensor units to measure over 60 toxic gases including NH3. The expected life of an NH3 sensor is equal to or
longer than 18 months.
- Gas chromatography and photo-ionization detectors
A gas chromatograph (GC) procedure has been reported (Yamamoto et al., 1994) in which ammonia is automatically collected from the air over a period of a few minutes in a tube containing alkalized Porasil B. The ammonia is desorbed thermally, dehumidified, separated on a GC column packed with 15% polyethylene glycol of mean molecular weight 6000 and 5% potassium hydroxide solution on Chromosorb 103, and detected by flame thermionic detection. The method has been demonstrated in a range of 1.4-70 µg/m3 (2-100 p.p.b.), and has been used to make continuous ambient measurements in an urban atmosphere. A detection limit of 0.014 µg/m3 (0.02 p.p.b.) was reported. Under particular circumstances, photo-ionization detectors can be used to determine concentrations of ammonia in air, although it must be borne in mind that such detectors are not inherently specific to ammonia.
In this type of detector, ultraviolet light ionizes the chemical and the ions formed are collected by electrodes, the current generated being a measure of the concentration. The UV ionizing lamp used in the detector is chosen to ionize selectively at the necessary potential. The ionization potential of ammonia is
10.15 eV, so a lamp of 10.9 eV is chosen. Typically, the detector is attached to a GC column in order to make the detector specific to NH3.
- Solid State Sensor
The solid state or electronic NH3 sensor is a relatively new measurement
method. It benefits from the spread of the electronic sensor technology. There are several types of these sensors that are sensitive to NH3 (Göpel and Schierbaum,
1991). There exist several advantages of solid state NH3 sensors, including
simplicity, low price, quick response, and automatic measurement. Their limitations include low accuracy, drift, and interference by humidity and other gases. Several types of NH3 sensors have been tested in animal houses. However,
they were still in the development stage. Krause and Janssen (1990; 1991) first used a chemical NH3 sensor to measure NH3 distribution in animal houses. The
sensor had a detection range of 1–1000 ppm, a response time <1 s and an accuracy of ± 10% between 4÷500 ppm.
Berckmans et al. (1994) described a test of a solid state NH3 sensor, developed
by the Interuniversity Micro Electronic Center (IMEC), Belgium, in livestock buildings. The sensor had a detection range of 0÷100 ppm NH3 and a response
time of 10÷15 s. It was a thick film semiconducting metal oxide sensor consisting of a heater element, a dielectric layer, a contact layer, and a gas sensitive semi-conductive metal oxide layer. The conductivity of semiconducting metal oxide films at a certain temperature was influenced by the presence of NH3 gas in the
surrounding atmosphere. The sensor’s optimum operating temperature was around 350÷400 °C. Hess and Hügle (1994) tested an NH3 measuring system called
SOLIDOX-NH3, manufactured in Germany, in animal houses for a few times but
with difficulties.
2.4.3 Techniques to measure ammonia emission rate in naturally ventilated barns
Most of the approaches to measure ammonia emission rates require the monitoring of building ventilation rates and airflow rates across slurry or manure stores. Three kinds of methods for monitoring such ventilation rate exist.
The first based on using a tracer gas, allows a direct measure of overall ventilation rate and thus, at least in principle, is applicable to both forced- and naturally ventilated buildings, as well as to airflows across slurry and manure stores. The tracer could be natural or artificial.
The second kind relies on measuring, in different locations, the airflow rates through all openings in a building and then summing these measures to obtain the overall ventilation rate of the building. This kind of technique is basically simpler, is readily applicable to force-ventilated buildings, but can only be applied to
naturally ventilated buildings under particular circumstances, nor is it applicable to manure stores (Phillips et al., 2000).
The third kind of technique is based on the natural ventilation theory in which the air exchange rate is determined by buoyant forces and wind pressures at the ventilation openings.
2.4.3.1 Tracer gas methods for direct measurement of overall ventilation rate The basic principle of tracer techniques for direct measurement of overall ventilation rate is to release a tracer at a known rate, monitor its concentration at downwind points and hence deduce the airflow necessary to reconcile the known rate of release with these measured concentrations. In the case of a livestock building, it is necessary to assume good air mixing inside. In practice, this may well not be the case, especially in naturally ventilated buildings, and errors in the ammonia emission rate may result (Barber and Ogilvie, 1982; Demmers et al., 1998).
The tracer gas may be carbon dioxide (CO2) (Kittas et al., 1996), nitrous oxide
(N2O) or sulphur hexafluoride (SF6) (Seipelt et al., 1999; Snell et al., 2003).
Sulphur hexafluoride is probably the most widely used of gaseous tracers and has already been used to some extent with livestock buildings (Gustafsson, 1996; Marik & Levin, 1996; Seipelt et al., 1998), as well as in other source quantification problems (e.g. Lamb et al., 1986, 1995; Claiborn et al., 1995). Its concentration is best measured by gas chromatography, using an electron capture detector. This can be automated to allow samples to be taken sequentially every few minutes, and measured with a detection limit of order 1 p.p.t. (International Atomic Energy Agency, 1992): the current background is 3 or 4 p.p.t. in the northern hemisphere (Maiss et al., 1996). Sulphur hexafluoride absorbs strongly in the infrared and so its concentrations can also be determined by infrared methods, but with less sensitivity.
Sulphur hexafluoride is non-toxic and stable in air and at surfaces in normal circumstances. It is non-infiammable. The only hazards are asphyxiation (requiring concentrations of tens of percent) and avoidance of very hot surfaces (which cause decomposition to the toxic hydrofluoric acid). In practice, the amounts required for an experiment are so small that there is no possibility of either hazard being significant. One of the few drawbacks of using sulphur hexafluoride is that it is a very powerful greenhouse gas with a very long half-life in the atmosphere.
Demmers et al. (2001) stated that the constant release tracer gas method gives the most reliable estimates of ventilation rate. Brehme (2000) described the compartmentalisation method which was used for many measurements in dairy buildings. This tracer gas method (i.e. decay method) combines, through a
dispersion mechanism, concentration measurements with air exchange measurements within which the volumetric flow rates are permanently fluctuating. The dependency of NH3 emission mass flow has been derived in form of
mathematical model as well as measured data or values.
An investigation was employed by S.Schrade et al., (2011) to determine emissions from two areas of different source intensity, with a tracer ratio method. A variety of accompanying parameters was used to characterise each measuring situation and to derive the relevant influencing variables. The daily average NH3
emission across all farms varied from 31 to 67 g LU-1 d-1 in summer, from 16 to 44 g LU-1 d-1 in the transition period, and from 6 to 23 g LU-1 d-1 in winter (1 LU = 500 kg liveweight). From a linear mixed-effects model the wind speed in the housing (p<0.001) and the interaction of outside temperature and the urea content of the tank milk (p < 0.001) emerged as significant variables influencing NH3
emission. A model-based calculation with bootstrapped variance components was used to calculate yearly averaged emission factors for two mountain and plain regions and two wind speeds (0.3 and 0.5 m s-1).The model input was based on milk urea contents from commercial dairy farms and air temperatures over a five-year period. The calculated NH3 emission factors, which thus accounted for
regional differences due to climatic conditions and feeding levels, ranged between 22 and 25 g LU-1d-1.
Experiments were carried out by Samer et al. (2011) about air exchange rates (AER) occurring in naturally ventilated dairy buildings during summer seasons 2006 to 2010. A tracer gas technique (TG) for AER measurements was developed. The AERs were determined by decay of radioactive tracer Krypton-85, and CO2
balance used as the reference method (RM). During each experiment, continuous measurements of gaseous concentrations (NH3, CO2, CH4 and N2O) inside and
outside the building and 85Kr tracer gas experiments were performed. The combined factors investigated were released over feeding table or over the manure alley, average values of AER per second (s-1) or the sum of impulses, selected radiation counts or all radiation counts. The results were compared using Pearson correlation analysis, developing a linear regression model, and testing the differences between the factor combinations and the RM using an ANOVA model. There were differences between impulses (Pr > |t| = 0.0013), where the sum of impulses showed better results than the average AER values. Although there was no difference (Pr > |t| = 0.344) between the readings of the radiation counts, it was considered that by using all the readings of the radiation counters it was more representative and easier to calculate the AER.
Natural tracers
In addition to releasable tracers, other naturally occurring tracers are available in livestock buildings: among them there are metabolic carbon dioxide, water vapour, and metabolic heat, produced by the livestock. Using one of these tracers
requires not only the presence of animals inside the building, but also an accurate knowledge of the carbon dioxide, water vapour or heat production rate of these animals. A procedure is also needed for predicting the site of production of the tracer in the building or manure store. Several models exist (e.g. the model called STALKL, reported by van Ouwerkerk & Pedersen, 1994) which can predict the production rates of carbon dioxide, heat and humidity by housed livestock to within 20%, based on a knowledge of the feed composition, body weight, species etc.
CO2 Balance
Carbon dioxide, formed by animal respiration and microbial degradation of faeces, can be used as a natural tracer gas. The ventilation rate throughout the building can be determined by calculating the mass balance of CO2 flow. CO2
balance is not in general terms used as reference method to measure air exchange rates.
The followin equation describes the relationship between the ventilation rate and the gas production rate assuming ideal mixing with the air inside the building:
0 2 2 C C P n V i CO CO (8) where:
PCO2 (mg h−1 cow−1) represents the excretion rate of CO2 from one cow,
n is the number of cows housed inside the building, 2
CO
V (m3 h−1) is the ventilation rate subject to CO2 balance, and Ci (mg m−3)
and Co (mg m−3) are the concentrations of the gas inside and outside the
building, respectively.
The air exchange rate can be then calculated by dividing the ventilation rate by the volume of the building.
This method requires valid heat production values for the animals and assumes that CO2 production is solely from animal respiration. However, much of the heat
production data was collected from 20 to 50 years ago and may no longer be valid due to advances in animal genetics and nutrition (Bicudo et al., 2002). Furthermore, measured CO2 concentrations may include CO2 from both animals
and microbial activities related to manure decomposition. Therefore, building ventilation rates based on the building carbon dioxide (CO2) balance method may