Lancet Infect Dis 2012; 12: 119–27 Published Online October 10, 2011 DOI:10.1016/S1473-3099(11)70248-1 See Commentpage 91 *Members listed at end of paper Correspondence to: Dominique Costagliola, UMR S 943 INSERM, 56 Boulevard Vincent Auriol, BP 335, 75625 Paris Cedex 13, France
Trends in virological and clinical outcomes in individuals
with HIV-1 infection and virological failure of drugs from
three antiretroviral drug classes: a cohort study
The Pursuing Later Treatment Option II (PLATO II) project team* for the Collaboration of Observational HIV Epidemiological Research Europe
(COHERE) Group*
Summary
Background
Limited treatment options have been available for people with HIV who have had virological failure of the
three original classes of HIV antiretroviral drugs—so-called triple-class virological failure (TCVF). However,
introduction of new drugs and drug classes might have improved outcomes. We aimed to assess trends in virological
and clinical outcomes for individuals with TCVF in 2000–09.
Methods
In our cohort study, we analysed data for adults starting antiretroviral therapy from 1998 in cohorts
participating in the PLATO II project, which is part of COHERE, a colla boration of European cohorts. TCVF was
defi ned as virological failure to at least two nucleoside reverse transcriptase inhibitors, one non-nucleoside
reverse-transcriptase inhibitor, and one ritonavir-boosted protease inhibitor, with virological failure of a drug defi ned as one
viral-load measurement of greater than 500 copies per mL after at least 4 months of continuous use. We used
multivariable generalised estimating equation logistic models and Poisson regression models to study trends in
virological suppression and incidence of AIDS or death after TCVF. We adjusted for sex, transmission group, age,
AIDS status, CD4 cell count, plasma viral loads at TCVF, achievement of virological response (<50 copies per mL),
and number of drug failures before TCVF.
Findings
28 of 33 cohorts in COHERE contributed data to the PLATO II project, of which four had no participants
eligible for inclusion in this study. 2476 (3%) of 91 764 participants from the remaining 24 cohorts had TCVF and at
least one viral load measurement in 2000–09. The proportion of patients with virological response after TCVF
increased from 19·5% in 2000 to 57·9% in 2009 (adjusted p<0·0001). Incidence of AIDS decreased from
7·7 per 100 person-years in 2000–02 to 2·3 in 2008 and 1·2 in 2009 (adjusted p<0·0001). Mortality decreased from
4·0 per 100 person-years between 2000 and 2002 to 1·9 in 2007 and 1·4 in 2008 (unadjusted p=0·023), but the trend
was not signifi cant after adjustment (p=0·22).
Interpretation
A substantial improvement in viral load suppression and accompanying decrease in the rates of AIDS
in people after extensive failure to drugs from the three original antiretroviral classes during 2000–09 was probably
mainly driven by availability of newer drugs with better tolerability and ease of use and small cross-resistance profi les,
suggesting the public health benefi t of the introduction of new drugs.
Funding
UK Medical Research Council.
Introduction
Investi gations of immunological and clinical outcomes
for patients after virological failure to all three original
antiretroviral classes
1–4have shown the eff ects of
widespread antiviral resistance on prognosis,
4the
importance of maintaining CD4 cell counts of 200 cells
per μL or higher,
2and the need to continue antiretroviral
therapy even when viral load is not controlled.
2,5,6Improved clinical outcomes were reported in individuals
with triple-class virological failure (TCVF) dependent
on the number of new drugs started, probably owing to
more favourable resistance profi les.
1,3However, most
people in these early studies started antiretroviral
therapy with only one or two drugs, which conferred a
high risk of resistance to nucleoside
reverse-transcriptase inhibitors (NRTIs). Now, all patients
starting anti retroviral therapy are recommended to do
so with potent combination regimens of three or
more drugs.
Although current regimens have led to sustained viral
suppression in an increasing proportion of people,
7some
individuals do still have virological failure to drugs from
the three original classes. As part of the Pursuing Later
Treatment Option II (PLATO II) project, we reported a low
rate of TCVF (3·4% by 5 years)
8in participants in the
Collaboration of Observational HIV Epidemiological
Research Europe (COHERE) database who started
anti-retroviral therapy including a non-NTRI (NNRTI) or a
ritonavir-boosted protease inhibitor from 1998. Virological
and clinical outcomes for people who had TCVF, and in
particular how these outcomes changed with time, have
not been widely studied.
9We aimed to assess trends in
virological and clinical outcomes over the past decade in
people with TCVF.
Methods
Study design and procedures
We analysed data obtained from participants in the
PLATO II project from the COHERE database
10(a
collaboration of 33 observational cohort studies of HIV
in Europe). The PLATO II project contains data from
28 participating cohorts, which submit information in a
standardised format
11to one of two regional coordinating
centres, where error checks are done before data are
merged into cohort data and added to COHERE.
Duplicate records from people in more than one cohort
were removed. We analysed data added to the COHERE
database as part of the PLATO II project in 2010 for
previously untreated participants aged 16 or older who
started antiretroviral therapy from 1998.
We defi ned virological failure of a drug as plasma HIV-1
RNA loads of more than 500 copies per mL despite
4 months or more of continuous use, irrespective of
concomitant use of other drugs in this timeframe.
Virological failure of drugs from all three classes was
defi ned as virological failure of two NRTIs, one NNRTI,
and one ritonavir-boosted protease inhibitor. We refer to
this combination as TCVF, although other drugs within
these classes might retain antiviral activity (eg, newer
protease inhibitors, such as darunavir, and NNRTIs, such
as etravirine, which were designed to be not
cross-resistant to existing drugs in the class). We included
patients with TCVF from 2000 onwards in the present
analysis if they had at least one plasma viral-load
measurement after TCVF between 2000 and 2009.
Statistical analysis
We calculated the proportion of people with virological
response (<50 copies per mL) after TCVF for the year
2000–09, using values recorded closest to July 1 for each
patient. We assessed trends in viral suppression adjusted
for characteristics of people at the time of TCVF that
could aff ect the probability of virological response by
fi tting a multivariable logistic regression model. We
adjusted for sex, transmission group, age, presence of
AIDS, CD4 cell count, plasma viral load at TCVF, previous
achievement of virological response, and number of drug
failures before TCVF. For the adjusted analysis of
virological response, we included all plasma HIV RNA
2000 2001 2002 2003 2004 2005 2006 2007 2008 2009 Individuals in follow-up 41 192 368 594 848 1138 1415 1561 1609 795 Age (years) 37 (32–40) 39 (33–44) 39 (34–44) 39 (35–44) 40 (35–45) 41 (36–46) 41 (36–47) 42 (37–47) 43 (38–48) 43 (38–49) Year of TCVF development 2000 (2000–2000) 2001 (2000–2001) 2001 (2001–2002) 2002 (2001–2003) 2003 (2002–2004) 2004 (2002–2004) 2004 (2003–2005) 2005 (2003–2006) 2005 (2004–2007) 2006 (2004–2007) Years since start of antiretroviral
therapy
2 (1–2) 3 (2–3) 3 (3–4) 4 (3–5) 5 (4–6) 6 (4–7) 7 (5–8) 8 (6–9) 8 (6–10) 9 (7–11)
Group
Men who have sex with men 18 (44%) 79 (41%) 119 (32%) 188 (32%) 251 (30%) 356 (31%) 419 (30%) 466 (30%) 482 (30%) 233 (29%) Heterosexual men 4 (10%) 24 (13%) 70 (19%) 121 (20%) 186 (22%) 241 (21%) 307 (22%) 331 (21%) 337 (21%) 165 (21%) Heterosexual women 9 (22%) 40 (21%) 73 (20%) 116 (20%) 180 (21%) 257 (23%) 343 (24%) 407 (26%) 422 (26%) 180 (23%) Injecting-drug users 5 (12%) 30 (16%) 67 (18%) 101 (17%) 135 (16%) 166 (15%) 201 (14%) 204 (13%) 208 (13%) 126 (16%)
Other or unknown 5 (12%) 19 (10%) 39 (11%) 68 (11%) 96 (11%) 118 (10%) 145 (10%) 153 (10%) 160 (10%) 91 (11%)
Individuals with AIDS before TCVF 19 (46%) 88 (46%) 156 (42%) 254 (43%) 352 (42%) 465 (41%) 540 (38%) 599 (38%) 605 (38%) 338 (43%) Antiretroviral therapy received
At least one PI/r 32 (78%) 145 (76%) 264 (72%) 444 (75%) 686 (81%) 913 (80%) 1182 (84%) 1320 (85%) 1322 (82%) 647 (81%) At least one NNRTI 20 (49%) 65 (34%) 91 (25%) 131 (22%) 157 (19%) 181 (16%) 192 (14%) 205 (13%) 219 (14%) 130 (16%) At least two NRTIs 33 (80%) 160 (83%) 301 (82%) 485 (82%) 676 (80%) 920 (81%) 1166 (82%) 1286 (82%) 1295 (81%) 634 (80%) At least four drugs 21 (51%) 60 (31%) 94 (26%) 156 (26%) 206 (24%) 260 (23%) 315 (22%) 350 (22%) 345 (21%) 163 (21%)
At least one new drug* 0 4 (2%) 8 (2%) 40 (7%) 218 (26%) 408 (36%) 624 (44%) 661 (42%) 789 (49%) 415 (52%)
At least two new drugs* 0 0 1 (<1%) 3 (<1%) 18 (2%) 30 (3%) 46 (3%) 67 (4%) 133 (8%) 86 (11%)
Darunavir 0 0 0 0 0 5 (<1%) 38 (3%) 92 (6%) 182 (11%) 117 (15%) Enfuvirtide 0 4 (2%) 5 (1%) 11 (2%) 43 (5%) 55 (5%) 70 (5%) 62 (4%) 31 (2%) 13 (2%) Etravirine 0 0 0 0 1 (<1%) 1 (<1%) 1 (<1%) 11 (<1%) 43 (3%) 35 (4%) Maraviroc 0 0 0 0 0 1 (<1%) 3 (<1%) 3 (<1%) 15 (<1%) 16 (2%) Raltegravir 0 0 0 0 0 1 (<1%) 3 (<1%) 32 (2%) 151 (9%) 92 (12%) Tipranavir 0 0 1 (<1%) 11 (2%) 13 (2%) 31 (3%) 38 (3%) 25 (2%) 15 (<1%) 2 (<1%) Atazanavir 0 0 3 (<1%) 21 (4%) 179 (21%) 345 (30%) 518 (37%) 519 (33%) 528 (33%) 253 (32%) None 3 (7%) 9 (5%) 19 (5%) 33 (6%) 42 (5%) 68 (6%) 65 (5%) 72 (5%) 71 (4%) 28 (4%)
Data are n (%) or median (IQR). TCVF=triple-class virological failure. NNRTI=non-nucleoside reverse transcriptase inhibitor. NRTI=nucleoside reverse transcriptase inhibitor. PI/r=ritonavir-boosted protease inhibitor. *Darunavir, enfuvirtide, etravirine, maraviroc, raltegravir, tipranavir, or atazanavir.
measurements obtained for all people after TCVF.
Because viral load was a repeated measurement, we used
generalised estimating equation models with an
exchangeable covariance matrix. Notably, because our
objective was mainly descriptive, we did not attempt to
further adjust for time-dependent variables such as access
to new drugs or improvements in adherence.
We estimated trends in incidence per person-year of
new AIDS-defi ning events (fi rst new diagnosis of AIDS
since diagnosis of TCVF, which might or might not be
the fi rst AIDS disease) between 2000 and 2009 and in
death rates between 2000 and 2008. We used the
European defi nition of AIDS,
12corresponding to the
clinical part of the US Centers for Disease Control and
Prevention defi nition. Person-years of follow-up were
censored 6 months after the last measurement of CD4 cell
count or viral load, the end of the year used in the
analysis, or on Dec 31, 2009, whichever occurred fi rst.
For incidence of AIDS, follow-up was censored at death.
For death, follow-up was censored on Jan 1, 2009, because
otherwise records might have been incomplete for some
cohorts. Thus, we only report death rates to 2008. We
used multivariable Poisson regression models to assess
the trends in the risk of AIDS or death in people with
TCVF, with the same covariates as we used for the
analysis of viral load. Patient-years with missing CD4
counts were excluded from the analyses.
All tests of signifi cance were two-sided, and p<0·05
was regarded as signifi cant. Analyses were done with
SAS software version 9.1 and Stata software version 11.0.
Role of the funding source
The sponsor of the study had no role in study design, data
collection, data analysis, data interpretation, or writing of
the report. Dominique Costagliola, Rebecca Lodwick,
Bruno Ledergerber, and Andrew Phillips had full access
to all the data in the study and had fi nal responsibility for
the decision to submit for publication.
Results
Two of 28 cohorts in the PLATO II project were paediatric
cohorts not included in this analysis. We also excluded
two cohorts that had few data for patients aged 16 years or
older starting combined antiretroviral therapy and no
data for patients with TCVF. By 2010, the PLATO II project
contained data for 91 764 individuals, of whom 2722 (3%)
had TCVF. Overall, 2709 (>99%) of 2722 people with
TCVF in included cohorts had failure in 2000–09, and
2476 (91%) had at least one viral-load measurement after
TCVF in this time. 1665 (67%) patients were men, 703
(28%) were men who have sex with men, 528 (21%) were
heterosexual men, 637 (26%) were heterosexual women,
and 354 (14%) were injecting drug users. At time of TCVF,
the median age was 39·5 years (IQR 34·4–45·2), median
viral load was 4·0 log
10copies per mL (3·2–4·8), and
median CD4 cell count was 270 cells per μL (147–430).
936 (38%) of 2476 people had had an AIDS defi ning event.
Figure: 2000–09 trends in virological and clinical outcomes in people with triple-class virological failure(A) Individuals with plasma HIV-1 RNA <50 copies per mL. (B) Incidence of new AIDS event. (C) Death rate.B
A
C
0 10 20 30 40 50 60 70 80 90 100 Individuals (%) 0 1 2 3 4 5 6 7 8 9 10 11Incidence per 100
person-years 0 1 2 3 4 5 6
Incidence per 100
person-years 2000−02 2003 2004 2005 2006 2007 2008 Year 2001 2003 2004 2005 2006 2007 2008 Year 2009 2002 2000 2000−02 2003 2004 2005 2006 2007 2008 Year 2009
The median year of start of antiretroviral therapy was 2000
(1998–2001) and the median year of TCVF was 2005
(2003–2006), which was a median of 4·3 years (2·7–6·2)
after the start of antiretroviral therapy. 892 (36%) of 2476
patients started on two NRTIs and one NNRTI, 679 (27%)
received two NRTIs and one protease inhibitor, 295 (12%)
received two NRTIs and one ritonavir-boosted protease
inhibitor, 123 (5%) received three NRTIs, and 487 (20%)
received other combinations. Table 1 lists characteristics
of individuals in follow-up in 2000–09. Notably, the
proportion of people receiving at least one new drug (ie,
atazanavir, darunavir, enfuvirtide, etravirine, maraviroc,
raltegravir, or tipranavir) rose from 0% in 2000 to 52%
in 2009. Few individuals received at least two of these
drugs (<1% in 2003 to 11% in 2009). In 2009, 253 (32%) of
2476 individuals were receiving atazanavir, 117 (15%) were
receiving darunavir, 92 (12%) were receiving raltegravir,
and 35 (4%) were receiving etravirine. The proportion of
people not on antiretroviral therapy remained low for all
years, but decreased from three (7%) of 41 people in 2000
to 28 (4%) of 795 in 2009.
We obtained data for 25 685 measurements of plasma
viral load after TCVF, with a median of eight
measure-ments (IQR four
to 15) per person, of which 9564 (37%)
were fewer than 50 copies per mL. The proportion of
patients with virological response after TCVF increased
from 19·5% for people followed up in 2000 to 57·9% in
2009 (p<0·0001; fi gure).
1 year after TCVF, the estimated proportion of
parti-cipants with virological response was 17·1% in those who
had TCVF in 2000 and 49·2% in those who had TCVF
in 2008. Irrespective of the year of TCVF (see
webappendix), people followed up to the most recent
calendar years had the best outcomes.
n Univariable analysis Multivariable analysis
Odds ratio (95% CI) p value Odds ratio (95% CI) p value
Year <0·0001 <0·0001 2000–02 1792 (7%) 0·29 (0·22–0·38) ·· 0·27 (0·20–0·36) ·· 2003 1882 (7%) 0·41 (0·33–0·51) ·· 0·40 (0·32–0·50) ·· 2004 2746 (11%) 0·65 (0·56–0·74) ·· 0·63 (0·55–0·73) ·· 2005 3524 (14%) 1 (reference) ·· 1 (reference) ·· 2006 4435 (17%) 1·18 (1·06–1·32) ·· 1·18 (1·06–1·33) ·· 2007 4695 (18%) 1·65 (1·46–1·87) ·· 1·65 (1·46–1·88) ·· 2008 4756 (19%) 2·28 (2·00–2·60) ·· 2·29 (2·00–2·62) ·· 2009 1855 (7%) 2·82 (2·39–3·33) ·· 2·79 (2·35–3·32) ·· Group <0·0001 <0·0001
Men who have sex with men 7911 (31%) 1 (reference) ·· 1 (reference) ··
Heterosexual men 5266 (20%) 0·77 (0·66–0·91) ·· 0·77 (0·64–0·93) ·· Heterosexual women 6337 (25%) 0·67 (0·57–0·78) ·· 0·63 (0·52–0·75) ·· Injecting-drug users 3473 (14%) 0·71 (0·59–0·86) ·· 0·81 (0·65–1·01) ·· Other or unknown 2698 (10%) 0·90 (0·73–1·11) ·· 0·95 (0·75–1·20) ·· Age at TCVF (years) 0·013 0·59 16–29 2940 (12%) 0·83 (0·67–1·01) ·· 0·95 (0·74–1·23) ·· 30–39 11 307 (44%) 1 (reference) ·· 1 (reference) ·· 40–49 8255 (32%) 1·12 (0·98–1·27) ·· 1·02 (0·88–1·18) ·· ≥50 3183 (12%) 1·16 (0·97–1·39) ·· 1·15 (0·92–1·42) ··
Drugs failed by date of TCVF 0·28 0·31
≤4 4059 (16%) 1·17 (0·98–1·41) ·· 1·23 (0·98–1·53) ··
5 6185 (24%) 1·13 (0·96–1·33) ·· 1·03 (0·85–1·24) ··
6 8222 (32%) 1·11 (0·96–1·29) ·· 1·07 (0·89–1·27) ··
≥7 7219 (28%) 1 (reference) ·· 1 (reference) ··
AIDS present before TCVF (yes vs no) Yes 10 800 (42%); no 14 885 (58%)
0·99 (0·88–1·12) 0·90 1·15 (0·99–1·32) 0·061
Never achieving viral load <50 copies per mL before TCVF (yes vs no)
Yes 9813 (38%); no 15872 (62%)
0·42 (0·37–0·48) <0·0001 0·62 (0·53–0·73) <0·0001
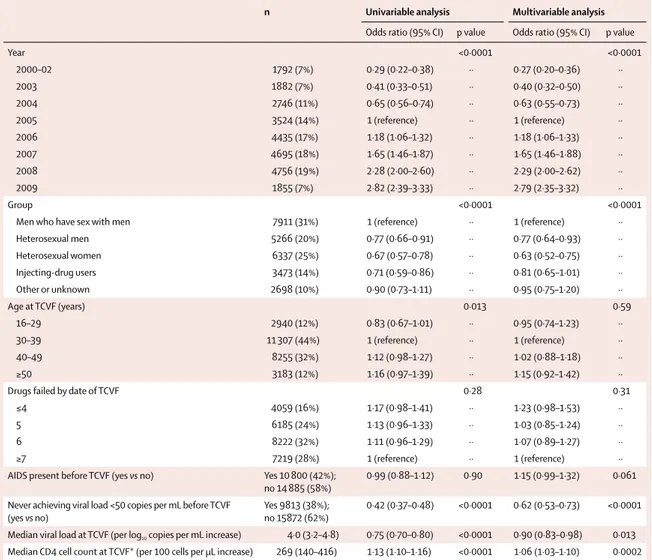
Median viral load at TCVF (per log10 copies per mL increase) 4·0 (3·2–4·8) 0·75 (0·70–0·80) <0·0001 0·90 (0·83–0·98) 0·013
Median CD4 cell count at TCVF* (per 100 cells per μL increase) 269 (140–416) 1·13 (1·10–1·16) <0·0001 1·06 (1·03–1·10) 0·0002
Data are number of viral load measurements (%) or median (IQR), unless otherwise stated. TCVF=triple-class virological failure. *Missing for 82 (0·3%) of 25 685 included viral load measurements.
Table 2: Predictors of virological response (viral load <50 copies per mL) in individuals with TCVF
Table 2 shows the results of the univariable and
multivariable models for prediction of virological
response. In the multivariable model, male and female
heterosexuals and injecting drug users were less likely to
achieve virological response than were men who have sex
with men. Individuals with a lower viral load and a higher
CD4 cell count at time of TCVF were more likely to
achieve virological response, whereas people who had
never achieved virological response before TCVF were
less likely to achieve it. Finally, patients who were followed
later (ie, closer to 2009) were more likely to achieve viral
suppression. Notably, there was no overlap between the
CI of the odds ratios for 2008–09 and those for 2006–07.
Results were robust when we used an auto regressive
covariance matrix instead of an exchangeable one
(webappendix).
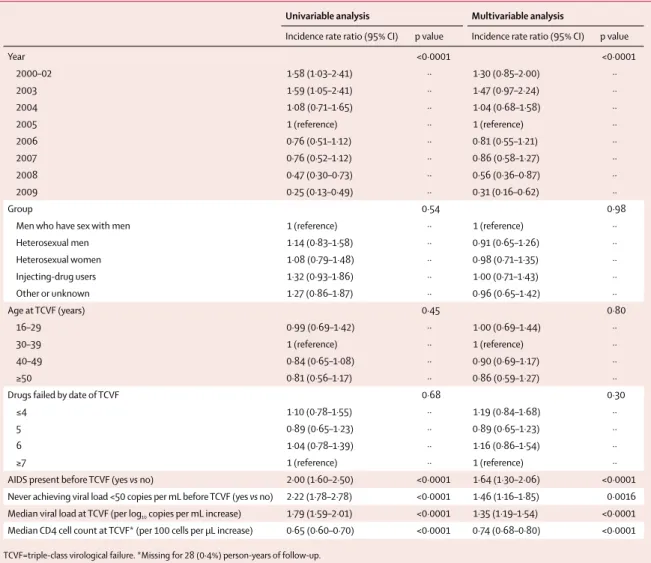
In 7777 patient-years of follow-up 311 people had a new
AIDS event. The crude incidence of AIDS-defi ning event
decreased from 7·7 per 100 patient-years between
2000 and 2002 to 2·3 in 2008 and 1·2 in 2009 (p<0·0001;
fi gure). This signifi cant trend was strongest in 2008 and
2009 in univariable and multivariable analyses (table 3).
People with a higher viral load, a lower CD4 cell count, or
a previous AIDS event at time of TCVF, or without
virological response before TCVF were more likely to
have a new AIDS event.
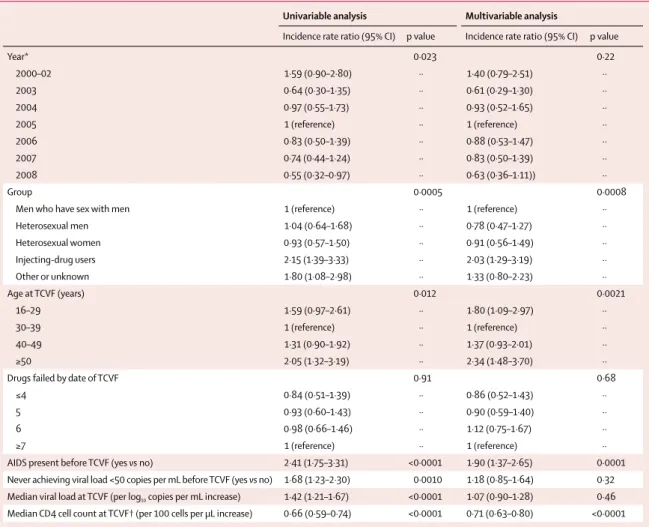
160 people died in 7568 patient-years of follow-up. The
crude rate of death decreased from 4·0 per 100
patient-years between 2000 and 2002 to 1·9 in 2007 and 1·4 in
2008 (p=0·023; fi gure). Injecting drug users, young
people (<30 years old), older people (≥50 years old), and
those who had had an AIDS event were more likely to die
(table 4). People with a higher CD4 cell count at time of
TCVF were less likely to die than were those with a low
CD4 cell count. After accounting for these variables, the
trend noted over time (p=0·023) was no longer signifi cant
(p=0·22). To account for the fact that injecting drug users
are more likely to die from causes not infl uenced by HIV
infection and its treatment, we did a post-hoc sensitivity
analysis excluding this group. In this analysis, 120 people
Univariable analysis Multivariable analysis
Incidence rate ratio (95% CI) p value Incidence rate ratio (95% CI) p value
Year <0·0001 <0·0001 2000–02 1·58 (1·03–2·41) ·· 1·30 (0·85–2·00) ·· 2003 1·59 (1·05–2·41) ·· 1·47 (0·97–2·24) ·· 2004 1·08 (0·71–1·65) ·· 1·04 (0·68–1·58) ·· 2005 1 (reference) ·· 1 (reference) ·· 2006 0·76 (0·51–1·12) ·· 0·81 (0·55–1·21) ·· 2007 0·76 (0·52–1·12) ·· 0·86 (0·58–1·27) ·· 2008 0·47 (0·30–0·73) ·· 0·56 (0·36–0·87) ·· 2009 0·25 (0·13–0·49) ·· 0·31 (0·16–0·62) ·· Group 0·54 0·98
Men who have sex with men 1 (reference) ·· 1 (reference) ··
Heterosexual men 1·14 (0·83–1·58) ·· 0·91 (0·65–1·26) ·· Heterosexual women 1·08 (0·79–1·48) ·· 0·98 (0·71–1·35) ·· Injecting-drug users 1·32 (0·93–1·86) ·· 1·00 (0·71–1·43) ·· Other or unknown 1·27 (0·86–1·87) ·· 0·96 (0·65–1·42) ·· Age at TCVF (years) 0·45 0·80 16–29 0·99 (0·69–1·42) ·· 1·00 (0·69–1·44) ·· 30–39 1 (reference) ·· 1 (reference) ·· 40–49 0·84 (0·65–1·08) ·· 0·90 (0·69–1·17) ·· ≥50 0·81 (0·56–1·17) ·· 0·86 (0·59–1·27) ··
Drugs failed by date of TCVF 0·68 0·30
≤4 1·10 (0·78–1·55) ·· 1·19 (0·84–1·68) ··
5 0·89 (0·65–1·23) ·· 0·89 (0·65–1·23) ··
6 1·04 (0·78–1·39) ·· 1·16 (0·86–1·54) ··
≥7 1 (reference) ·· 1 (reference) ··
AIDS present before TCVF (yes vs no) 2·00 (1·60–2·50) <0·0001 1·64 (1·30–2·06) <0·0001
Never achieving viral load <50 copies per mL before TCVF (yes vs no) 2·22 (1·78–2·78) <0·0001 1·46 (1·16–1·85) 0·0016 Median viral load at TCVF (per log10 copies per mL increase) 1·79 (1·59–2·01) <0·0001 1·35 (1·19–1·54) <0·0001
Median CD4 cell count at TCVF* (per 100 cells per μL increase) 0·65 (0·60–0·70) <0·0001 0·74 (0·68–0·80) <0·0001
TCVF=triple-class virological failure. *Missing for 28 (0·4%) person-years of follow-up. Table 3: Predictors of new AIDS event12 after TCVF
died during 6477 years of follow-up. In these analyses,
the decrease in the risk of death between 2000 and
2008 was signifi
cant in the univariable analysis
(p=0·0045) and neared signifi cance in the multivariable
analysis (p=0·064).
Discussion
Between 2000 and 2009, the proportion of people who
had virological response after TCVF improved
substantially, and there was a concomitant decrease in
AIDS incidence. However, we did not note an overall
decrease in mortality.
Our aim was to assess whether there was an improvement
in outcomes for people who had TCVF in the past decade,
and we adjusted our models only for variables measured
at the time of TCVF because such characteristics might
change with time and aff ect outcomes. With this type of
analysis we were able to show if there was, or not, a true
trend in time. We chose not to analyse the extent to which
the measures of improvements in antiretroviral therapy
could statistically explain (ie, remove) the positive trends.
This choice was made because we did not have measures
of drug adherence or good measures of the presence of
viral drug resistance. However, we intend in the future to
merge data for viral resistance in our study population to
assess trends in detected resistance. Because of our
objective, we do not think any other independent variables
available at TCVF should have been added in the models.
For example, CD4 cell count at treatment initiation, which
might have changed dependent on the year and might be
associated with any one of the three outcomes, would be
strongly correlated with CD4 cell counts at TCVF, so
would not be an independent factor.
The positive trends that we noted probably relate to
improvements in adherence and management of
resistance, increasing availability of new drugs within
existing classes (such as the protease inhibitor darunavir
and the NNRTI etravirine), and increasing availability of
drugs from new classes, making new regimens with
minimal cross-resistance possible.
13The trend for an
Univariable analysis Multivariable analysisIncidence rate ratio (95% CI) p value Incidence rate ratio (95% CI) p value
Year* 0·023 0·22 2000–02 1·59 (0·90–2·80) ·· 1·40 (0·79–2·51) ·· 2003 0·64 (0·30–1·35) ·· 0·61 (0·29–1·30) ·· 2004 0·97 (0·55–1·73) ·· 0·93 (0·52–1·65) ·· 2005 1 (reference) ·· 1 (reference) ·· 2006 0·83 (0·50–1·39) ·· 0·88 (0·53–1·47) ·· 2007 0·74 (0·44–1·24) ·· 0·83 (0·50–1·39) ·· 2008 0·55 (0·32–0·97) ·· 0·63 (0·36–1·11)) ·· Group 0·0005 0·0008
Men who have sex with men 1 (reference) ·· 1 (reference) ··
Heterosexual men 1·04 (0·64–1·68) ·· 0·78 (0·47–1·27) ·· Heterosexual women 0·93 (0·57–1·50) ·· 0·91 (0·56–1·49) ·· Injecting-drug users 2·15 (1·39–3·33) ·· 2·03 (1·29–3·19) ·· Other or unknown 1·80 (1·08–2·98) ·· 1·33 (0·80–2·23) ·· Age at TCVF (years) 0·012 0·0021 16–29 1·59 (0·97–2·61) ·· 1·80 (1·09–2·97) ·· 30–39 1 (reference) ·· 1 (reference) ·· 40–49 1·31 (0·90–1·92) ·· 1·37 (0·93–2·01) ·· ≥50 2·05 (1·32–3·19) ·· 2·34 (1·48–3·70) ··
Drugs failed by date of TCVF 0·91 0·68
≤4 0·84 (0·51–1·39) ·· 0·86 (0·52–1·43) ··
5 0·93 (0·60–1·43) ·· 0·90 (0·59–1·40) ··
6 0·98 (0·66–1·46) ·· 1·12 (0·75–1·67) ··
≥7 1 (reference) ·· 1 (reference) ··
AIDS present before TCVF (yes vs no) 2·41 (1·75–3·31) <0·0001 1·90 (1·37–2·65) 0·0001
Never achieving viral load <50 copies per mL before TCVF (yes vs no) 1·68 (1·23–2·30) 0·0010 1·18 (0·85–1·64) 0·32 Median viral load at TCVF (per log10 copies per mL increase) 1·42 (1·21–1·67) <0·0001 1·07 (0·90–1·28) 0·46
Median CD4 cell count at TCVF† (per 100 cells per μL increase) 0·66 (0·59–0·74) <0·0001 0·71 (0·63–0·80) <0·0001
*Data censored on Jan 1, 2009, to avoid potential incomplete data reporting for some cohorts. †Missing for 27 (0·4%) person-years of follow-up. TCVF=triple-class virological failure.
improved virological outcome was strongest in 2008 and
2009, shortly after four new drugs were approved in
Europe (darunavir in February, 2007, maraviroc in
September, 2007, raltegravir in December, 2007, and
etravirine in August, 2008).
Our results suggest eff ectiveness at a routine clinical
population scale of new antiretroviral drugs in terms of
morbidity and rates of virological suppression (panel). In
particular, because the risk of death did not seem to
increase and was perhaps decreasing in individuals who
do not use injecting drugs, this study supports the notion
that any adverse eff ects of these new drugs on mortality
are outweighed by the benefi ts. The positive trends we
reported between 2000 and 2009 in this study probably
result from improvements in tolerability and ease of use
of drug regimens,
14,15and in the availability of drugs with
non-overlapping resistance profi les. Our results are
consistent with recent studies indicating that the
proportion of overall clinic populations with suppressed
viral load has increased with time.
16–18Although we suggest there was a trend towards a
decline in mortality, this fi nding was not signifi cant in
multivariable analyses; however, there was a substantial
decrease in the rate of new cases of AIDS. The reason for
this diff
erence might be the small sample size
(160 endpoints for death vs 311 for AIDS). In the analysis
excluding injecting drug users, the time trend for a
decline in death rate approached signifi cance in the
multivariable analysis even though its power was smaller
than in the overall analysis (120 endpoints instead of 160).
Another reason for the absence of a signifi cant response
in death rate might be because, between 2000 and 2009,
a comparatively small and diminishing proportion of
deaths in those with TCVF was caused by AIDS.
19,20Thus,
there is less room for improvement through increased
virological control. Nevertheless, there is evidence that
HIV increases the risk of several serious non-AIDS
conditions
21so some decrease with time in death rates
from non-AIDS causes would be expected. Such disorders
might relate to HIV-induced immune activation and
infl ammation, which generally persist in the fi rst few
years after virological control, and could partly explain
the lesser trend that we noted for risk of death.
22,23Furthermore, long-term adverse events might have
contributed to the weak trend. We are aware that not all
cohorts link their data with national death registries,
which might result in an underestimation of mortality. A
long delay in ascertainment of deaths could lead to
overestimation of any positive trends in mortality. By
contrast, ascertainment of AIDS should be high because
this outcome is chiefl
y diagnosed at the clinics
themselves. This reasoning is why we censored data on
Jan 1, 2009, for death and report results about death to
2008. Nevertheless, this issue cannot explain weakness
of the trend for death.
A low CD4 cell count at TCVF was associated with low
probability of virological success and high risk of new
AIDS events and death. This result, once again,
emphasises the importance of maintenance of a healthy
CD4 cell count and of an early identifi cation and
treatment of HIV infection.
Despite improvements, viral loads cannot be
sup-pressed for some people with TCVF. This eff ect is
probably caused by insuffi
cient adherence to drug
regimens rather than presence of a virus resistant to all
drugs.
24However, some people do have viruses with
resistance to all drugs available in 2009.
25,26Whether the improving trend, or even the current rate
of viral suppression in 2009, can be sustained in the
future is unclear. Continued improvement will likely
need continued development of new drugs, which are
active against virus with resistance to existing drugs.
COHERE accumulates data from cohorts in most
countries in western Europe, and includes data for more
than 70% of the patients in care in France, the
Netherlands, and Switzerland, and 50% of such patients
in the UK. Individuals from these four countries make
up two-thirds of our dataset and thus we believe that our
results are representative of the trends for these countries,
and probably for western Europe as a whole. However,
we cannot exclude the possibility that, in these countries,
clinics contributing to the cohorts have a higher standard
of care and perhaps a greater level of viral suppression
than do non-participating clinics.
Panel: Research in context
Systematic review
Previous studies that investigated virological or clinical
outcomes in people who had virological failure on the original
three classes of antiretroviral drugs dealt mainly with people
who had started antiretroviral therapy with one or two
drugs;
1–4however, this group is now of decreased relevance. We
searched PubMed for articles published in any language
between January, 2004, and June, 2011, that investigated
virological or clinical outcomes (see webappendix) in people
with triple-class virological failure who started treatment when
combined therapy with three or more drugs had become the
norm (1998); we identifi ed only one such study.
9Because of its
small size (167 people with triple-class virological failure), this
study had a little power to assess trends of virological and
clinical outcomes after triple-class virological failure.
Interpretation
In western Europe, there has been a striking improvement of
virological status of people with triple-class virological failure
between 2000 and 2009 in routine clinical practice, especially
since 2008, and an accompanying decrease in the rate of
AIDS. This eff ect is probably largely due to the fact that, in the
same period, several drugs have become available that are
easier to use and better tolerated than were existing drugs,
and tend to be active against virus resistant to typical
fi rst-line and second-line drugs.
Overall, we showed substantial improvements between
2000 and 2009 in virological suppression in people who
had virological failure to drugs from the three original
classes of antiretrovirals, and accompanying decreases in
rates of AIDS. We suggest that the set of available drugs
is suffi
cient to enable construction of active regimens for
most infected people. However, because previously
untreated patients who start antiretroviral therapy from
2011 will do so with drugs that are diff erent from those
used in 1998–2001, drug resistance profi les will diff er in
the future and thus there will be a continuing need for
new drugs with non-overlapping resistance profi les.
Contributors
All members of the PLATO II analysis and writing committee participated in discussions about the design of the study, choice of statistical analyses, and interpretation of the fi ndings, and critically reviewed the manuscript. Dominique Costagliola, Bruno Ledergerber, Carlo Torti, Ard van Sighem, Daniel Podzamczer, Amanda Mocroft, Maria Dorrucci, Bernard Masquelier, Andrea de Luca, Klaus Jansen, Stephane De Wit, Niels Obel, Gerd Fätkenheuer, Giota Touloumi, Cristina Mussini, Antonella Castagna, Cristoph Stephan,
Federico García, Robert Zangerle, Xavier Duval, Santiago Pérez-Hoyos, Laurence Meyer, Jade Ghosn, Céline Fabre-Colin, Jesper Kjaer, and Genevieve Chene contributed to data acquisition and management. Céline Fabre-Colin, Jesper Kjaer, and Jesper Grarup provided administrative, technical, and material support. Dominique Costagliola, Rebecca Lodwick, Bruno Ledergerber and Andrew Phillips were responsible for the study concept and design, had full access to the dataset, did all analyses, interpreted the data, and drafted the report.
The Collaboration of Observational HIV Epidemiological Research Europe (COHERE) group
Analysis and Writing Committee—Dominique Costagliola,
Rebecca Lodwick, Bruno Ledergerber, Carlo Torti, Ard van Sighem, Daniel Podzamczer, Amanda Mocroft, Maria Dorrucci,
Bernard Masquelier, Andrea de Luca, Klaus Jansen, Stephane De Wit, Niels Obel, Gerd Fätkenheuer, Giota Touloumi, Cristina Mussini, Antonella Castagna, Cristoph Stephan, Federico García, Robert Zangerle, Xavier Duval, Santiago Pérez-Hoyos, Laurence Meyer, Jade Ghosn, Céline Fabre-Colin, Jesper Kjaer, Genevieve Chene, Jesper Grarup, and Andrew Phillips. Pursuing Later Treatment Option II (PLATO II) Project
team–Antonella Castagna (San Raff aele), Dominique Costagliola (ANRS
CO4 FHDH), Alessandro Cozzi-Lepri (ICONA), Andrea De Luca (ICONA), Stephane De Wit (St Pierre Cohort), Frank de Wolf (ATHENA), Maria Dorrucci (CASCADE), Xavier Duval (ANRS CO8 COPILOTE), Gerd Fätkenheuer (Cologne Bonn), Federico García (CoRIS), Jade Ghosn (ANRS CO6 PRIMO), Huldrych Günthard (SHCS), Klaus Jansen (KOMPNET), Louise Jørgensen (Danish HIV Cohort), Ali Judd (CHIPS), Bruno Ledergerber (SHCS),
Sergio Lo Caputo (Italian Master Cohort), Rebecca Lodwick (statistician), Bernard Masquelier (ANRS CO3 AQUITAINE), Laurence Meyer (ANRS CO2 SEROCO), Amanda Mocroft (EuroSIDA), Cristina Mussini (Modena Cohort), Antoni Noguera-Julian (CORISPE-cat), Niels Obel (Danish HIV Cohort), Dimitrios Paraskevis (AMACS), Roger Paredes (EuroSIDA), Santiago Pérez-Hoyos (GEMES-Haemo), Andrew Phillips (PLATO II project leader; UK HIV Drug Resistance Database and UK CHIC), Deenan Pillay (UK HIV Drug Resistance Database and UK CHIC), Daniel Podzamczer (PISCIS), José T Ramos (Madrid Cohort), Christoph Stephan (Frankfurt HIV Cohort), Pat A Tookey (NSHPC), Carlo Torti (Italian Master Cohort), Giota Touloumi (AMACS), Ard van Sighem (ATHENA), Josiane Warszawski (ANRS CO1 EPF), and Robert Zangerle (AHIVCOS). COHERE Steering Committee—Robert Zangerle, Giota Touloumi, Josiane Warszawski, Laurence Meyer, François Dabis (ANRS CO3 AQUITAINE), Murielle Mary Krause (ANRS CO4 FHDH), Jade Ghosn, Catherine Leport (ANRS CO8 COPILOTE), Frank de Wolf, Peter Reiss (ATHENA), Maria Prins (CASCADE), Heiner Bücher (CASCADE), Caroline Sabin (CHIC), Diana Gibb (CHIPS), For participating cohorts see
http://www.cphiv.dk/COHERE/ tabid/295/Default.aspx and http://etudes.isped.u-bordeaux2. fr/cohere
Gerd Fätkenheuer, Julia Del Amo (CoRIS), Niels Obel, Claire Thorne (ECS), Amanda Mocroft, Ole Kirk (EuroSIDA), Christoph Stephan,
Santiago Pérez-Hoyos, Antoni Noguera-Julian, Andrea Antinori (ICC), Antonella d’Arminio Monforte (ICONA), Norbert Brockmeyer (KOMPNET), José T Ramos, Manuel Battegay (MoCHIV), Andri Rauch (SHCS), Cristina Mussini, Pat Tookey, Jordi Casabona (PISCIS), Jose M Miró (PISCIS), Antonella Castagna, Stephane de Wit,
Tessa Goetghebuer (St Pierre Paediatric Cohort), Carlo Torti, Ramon Teira (VACH), Myriam Garrido (VACH). European AIDS Treatment
Group—David Haerry. Executive committee—Ian Weller (Chair, University
College London), Jordi Casabona (PISCIS), Dominique Costagliola, Antonella d’Arminio-Monforte, Manuel Battegay (MoCHIV), Maria Prins, Frank de Wolf, Jesper Grarup (Head of Copenhagen Regional Coordinating Centre), Genevieve Chene (Head, Bordeaux Regional Co-ordinating Centre). Regional co-ordinating centres (Bordeaux RCC cohorts)— Céline Colin, Christine Schwimmer, and Guillaume Touzeau.
Regional co-ordinating centres (Copenhagen RCC cohorts)—Jesper Kjaer and
Maria Paulsen. Project leaders and statistical analysis—Julia Bohlius, Vincent Bouteloup, Heiner Bücher, Alessandro Cozzi-Lepri, François Dabis, Antonella d’Arminio Monforte, Frank de Wolf, Maria Dorrucci,
Matthias Egger, Frederik Engsig, Hansjakob Furrer, Ole Kirk,
Olivier Lambotte, Charlotte Lewden, Rebecca Lodwick, Sophie Matheron, Laurence Meyer, Jose M Miró, Amanda Mocroft, Niels Obel, Roger Paredes, Andrew Phillips, Massimo Puoti, Joanne Reekie, Caroline Sabin, Alexandra Scherrer, Colette Smit, Jonathan Sterne, Rodolphe Thiebaut, Claire Thorne, Carlo Torti, Viktor von Wyl, Linda Wittkop, and Jim Young.
Confl icts of interest
No member of the PLATO II analysis and writing committee has any fi nancial or personal relationships with people or organisations that could inappropriately infl uence this work, although most members of the group have, at some stage in the past, received funding from a variety of pharmaceutical companies for research, travel grants, speaking engagements or consultancy fees.
Acknowledgments
The PLATO II project is funded by the UK Medical Research Council award G0700832. The COHERE study group has received funding from the Agence Nationale de Recherches sur le SIDA et les Hépatites Virales (ANRS) in France, HIV Monitoring Foundation in the Netherlands, and the Augustinus Foundation in Denmark. COHERE receives funding from the European Union Seventh Framework Programme (FP7/2007–2013) under EuroCoord grant agreement number 260694. A list of the funders of the participating cohorts can be found on the regional coordinating centre websites.
References
1 Mocroft A, Phillips AN, Friis-Moller N, et al. Response to antiretroviral therapy among patients exposed to three classes of antiretrovirals: results from EuroSIDA study. Antivir Ther 2002; 7: 21–30. 2 Ledergerber B, Lundgren JD, Walker AS, et al. Predictors of trend
in CD4-positive T-cell count and mortality among HIV-1-infected individuals with virological failure to all three antiretroviral-drug classes. Lancet 2004; 364: 51–62.
3 Costagliola D, Potard V, Duvivier C, et al. Impact of newly available drugs on clinical progression in patients with virological failure after exposure to three classes of antiretrovirals. Antivir Ther 2005;
10: 563–73.
4 Zaccarelli M, Tozzi V, Lorenzini P, et al. Multiple drug class-wide resistance associated with poorer survival after treatment failure in a cohort of HIV-infected patients. AIDS 2005; 19: 1081–89. 5 Kousignian I, Abgrall S, Grabar S, et al, and the Clinical
Epidemiology Group of the French Hospital Database on HIV. Maintaining antiretroviral therapy reduces the risk of
AIDS-defi ning events in patients with uncontrolled viral replication and profound immunodefi ciency. Clin Infect Dis 2008; 46: 296–304. 6 The Strategies for Management of Antiretroviral Therapy (SMART)
study group. Inferior clinical outcome of the CD4+ cell count-guided antiretroviral treatment interruption strategy in the SMART study: role of CD4+ cell counts and HIV RNA levels during follow-up. J Infect Dis 2008; 197: 1145–55.
7 Bartlett JA, Fath MJ, Demasi R, et al. An updated systematic overview of triple combination therapy in antiretroviral-naive HIV-infected adults. AIDS 2006; 20: 2051–64.
8 The Pursuing Later Treatment Options II (PLATO II) Project Team for the Collaboration of Observational HIV Epidemiological Research Europe (COHERE). Triple class virologic failure in HIV-infected patients on antiretroviral therapy for up to 10 years.
Arch Intern Med 2010; 170: 410–19.
9 Phillips AN, Leen C, Wilson A, et al, for the UK Collaborative HIV Cohort (CHIC) Study. Risk of extensive virological failure to the three original antiretroviral drug classes over long-term follow-up from the start of therapy in patients with HIV infection: an observational cohort study. Lancet 2007; 370: 1923–28. 10 Sabin CA, Smith CJ, Monforte AD, et al. Response to combination
antiretroviral therapy: variation by age—The Collaboration of Observational HIV Epidemiological Research Europe (COHERE) study group. AIDS 2008; 22: 1463–73.
11 Kjaer J, Ledergerber B. HIV cohort collaborations: proposal for harmonization of data exchange. Antivir Ther 2004; 9: 631–33. 12 Ancelle-Park R. Expanded European AIDS case defi nition.
Lancet 1993; 341: 441.
13 Grant PM, Zolopa AR. Optimal antiretroviral therapy: HIV-1 treatment strategies to avoid and overcome drug resistance.
Curr Opin Investig Drugs 2010; 11: 901–10.
14 Protopopescu C, Raffi F, Roux P, et al, for the ANRS CO8 APROCO-COPILOTE study group. Factors associated with non-adherence to long-term highly active antiretroviral therapy: a 10 year follow-up analysis with correction for the bias induced by missing data. J Antimicrob Chemother 2009; 64: 599–606. 15 Bangsberg DR, Ragland K, Monk A, Deeks SG. A single tablet
regimen is associated with higher adherence and viral suppression than multiple tablet regimens in HIV+ homeless and marginally housed people. AIDS 2010; 24: 2835–40.
16 Chaix ML, Descamps D, Wirden M, et al, ANRS AC11 Resistance Group; Cohort PRIMO ANRS CO 6; FHDH ANRS CO4 Study Groups. Stable frequency of HIV-1 transmitted drug resistance in patients at the time of primary infection over 1996–2006 in France.
AIDS 2009; 23: 717–24.
17 Bansi L, Sabin C, Delpech V, et al, for the UK Collaborative HIV Cohort (CHIC) Study and the Health Protection Agency. Trends over calendar time in antiretroviral treatment success and failure in HIV clinic populations. HIV Med 2010; 11: 432–38.
18 Ledergerber B, Cavassini M, Battegay M, et al, and the Swiss HIV Cohort Study (SHCS). Trends over time of virological and immunological characteristics in the Swiss HIV Cohort Study.
HIV Med 2011; 12: 279–88.
19 Lewden C, Salmon D, Morlat P, et al, the Mortality 2000 study group. Causes of death among HIV-infected adults in the era of potent antiretroviral therapy: emerging role of hepatitis and cancers, persistent role of AIDS. Int J Epidemiol 2005; 34: 121–30. 20 Lewden C, May T, Rosenthal E, et al, the ANRS EN19 Mortalité
Study Group and Mortavic. Changes in causes of death among adults infected by HIV between 2000 and 2005. The “Mortalité 2000 & 2005” surveys (ANRS EN19 and Mortavic).
J Acquir Immune Defi c Syndr 2008; 48: 590–98.
21 Phillips AN, Neaton J, Lundgren JD. The role of HIV in serious diseases other than AIDS. AIDS 2008; 22: 2409–18.
22 Lewden C, Chene G, Morlat P, et al, Agence Nationale de Recherches sur le Sida et les Hepatites Virales (ANRS) CO8 APROCO-COPILOTE Study Group; Agence Nationale de Recherches sur le Sida et les Hepatites Virales (ANRS) CO3 AQUITAINE Study Group. HIV-infected adults with a CD4 cell count greater than 500 cells/mm³ on long-term combination antiretroviral therapy reach same mortality rates as the general population. J Acquir Immune Defi c Syndr 2007; 46: 72–77. 23 Deeks SG, Phillips AN. HIV infection, antiretroviral treatment,
ageing, and non-AIDS related morbidity. BMJ 2009; 338: a3172. 24 Yazdanpanah Y, Fagard C, Descamps D, et al, ANRS 139 TRIO Trial
Group. High rate of virologic suppression with raltegravir plus etravirine and darunavir/ritonavir among treatment-experienced patients infected with multidrug-resistant HIV: results of the ANRS 139 TRIO trial. Clin Infect Dis 2009; 49: 1441–49.
25 Assoumou L, Descamps D, Yerly S, et al, ANRS AC11 Resistance study group. Prevalence of HIV-1 drug resistance in treated patients with viral load >50 copies/mL in 2009: a French nationwide study.
Antiviral Ther 2010; 15 (suppl 2): A185.
26 UK Collaborative Group on HIV Drug Resistance; UK CHIC Study Group. Long-term probability of detecting drug-resistant HIV in treatment-naive patients initiating combination antiretroviral therapy. Clin Infect Dis 2010; 50: 1275–85.