PCDD/F WIND-SELECTIVE SAMPLING IN TARANTO AREA
Giua R.1 , Menegotto M. 2 , Esposito V. 3 , Maffei A. 3, Ficocelli S. 2 , Nocioni A. 4 and Assennato G. 1 1Apulia Regional Environmental Protection Agency, Regional Direction, Corso Trieste 27, 70126 Bari, Italy 2Apulia Regional Environmental Protection Agency, Taranto Province Department, Ospedale Testa, Contrada Rondinella, 74100 Taranto, Italy
3Apulia Regional Environmental Protection Agency, Organic Micropollutants Laboratory, Via Anfiteatro 8, 74100 Taranto, Italy
4Apulia Regional Environmental Protection Agency, Brindisi Province Department, Via Galanti 16, 72100 Brindisi, Italy
Abstract
The most relevant dioxin emission source in Apulia region is ILVA iron ore sinter plant, located in Taranto industrial area. In order to determine its influence on air quality, we performed wind-selective sampling of PCDD/Fs and other POPs in sites at different distances from Taranto integrated steel facility. Results showed a strong directionality of micro-pollutants, with much higher dioxin concentrations with wind coming from industrial area, compared to other wind sectors; this situation appears significantly different with respect to other Apulia industrial areas, such as Brindisi.
Introduction
With over 200,000 inhabitants Taranto, in the Apulia Region (Southern Italy), hosts a heavy industrial district unfavourably positioned near residential areas which are downstream at prevailing winds. The industrial district includes an oil refinery, a cement facility and “ILVA”, one of the largest European steel factories including blast furnaces, converters, coke furnaces, steel rolling and tubing and a huge sinter plant, with an year production of about 9 millions of steel.
In 2005, in Taranto province, Regional Air Recovery Plan estimated emissions of 570,000 CO tons, 62,000 SO2 tons, 12,700 PTS tons, 12,200 COVNM tons, 47,000 NOx tons in Atmosphere per year, mainly due to Taranto industrial emissions.
In this context, emissions of organic micro-pollutants appeared particularly relevant: in 2005 INES register estimated an emission of 93.0 grams per year of dioxins from Taranto ILVA factory, which corresponded to the 90 per cent of Italian total emissions.
In addition to that, Taranto Cancer Registry showed increase of incidence for lung cancer and respiratory disease, typically related to environmental pollutants exposure.
In 2007-2008, ARPA (the Regional Environmental Protection Agency for Apulia) performed two PCDD/F monitoring campaigns on Taranto sinter plant atmospheric emissions; results showed a mean value for PCDD/F emissions of about 150 grams per year, significantly higher than INES inventory estimated amount.
In spite of the outlined situation, neither Italian nor European regulations presently provide air quality standards for PCDD/Fs, while Italian law keeps the rather “ancient” and extremely high limit for dioxins stack emissions of 10,000 ng/Nm3, not referred to Toxicity Equivalence Factors. Consequently, Apulia Environmental Autority has recently approved a regional law concerning organic micro-pollutants, which establishes the limit for PCDD/F emissions from steel facilities (equal to 2.5 ng I-TEQ/Nm3 until July 2009, to be reduced to 0.4 ng I-TEQ/Nm3 within the end of 2010).
Materials and Methods
In order to highlight the impact of local pollutants source (with regards to PCDD/F, dioxin-like PCBs , PAHs), we carried out “wind selective” monitoring campaigns of ambient air in Taranto urban and suburban areas close to the industrial district.
Devices employed were long term ambient air samplers, which collect samples on different cartridges depending on actual wind situation (total sampling volume about 100 m3/day).
Cartridges are made of two layers of polyurethane foam (PUF) and one quartz fiber dust filter (spiked with 13C12 PCDD/Fs e 13C12 PAH labelled standards).
Depending on the geographical localization of the monitoring sites, two wind sectors were defined according to which each sample was to be separately collected on different cartridges (“downwind” and “upwind” with respect to pollutants source). A third cartridge collected air sample in case of wind calm (i.e. wind speeds less than 0.5 m/s). Moreover, the sampling period was determined depending on actual wind circulation, taking into account the minimum necessary sampling volume for each cartridge (at least 100 m3).
The European Standard (EN 1948-1-2-3:2006) was followed for extraction, clean-up, identification and quantification of PCDD/F and PAH.
During 2008-2009, three sampling campaigns were carried out in Taranto area; the first (11÷29 august 2008) in one site, while the second and third at the same time (23 feb ÷ 5 mar 2009) in two different sites, as better described below.
Results and Discussion
The results of monitoring activities are reported hereunder.
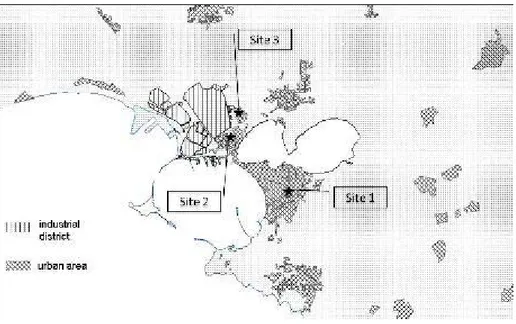
Taranto area is shown in figure 1. It is possible to locate the densely populated area, the contiguous industrial district and the three “wind-selective” monitoring sites. Sampling sites (all positioned on rooftop of not high buildings) had different features, such as their distance from the industrial district and their position with respect to industrial facilities with different emission characteristics (e.g. site n.2 is closer to the coke oven area, while site n. 3 is closer to the sintering unit).
Figure 1: Position of monitoring sites
Sites characteristics and meteorological data during monitoring (i.e. ambient temperature and rainfall) are listed in table 1.
Table 1: Sites and conditions during monitoring Distance from industrial
district limits Rooftop height
Monitoring season
Ambient air mean temperature
Rainfall (monitoring
period)
SITE 1 6 km About 20 mt above street level summer 28 °C 0 mm
SITE 2 0.5 km About 10 mt above street level winter 10°C 14 mm
SITE 3 0.5 km About 10 mt above street level winter 10°C 14 mm
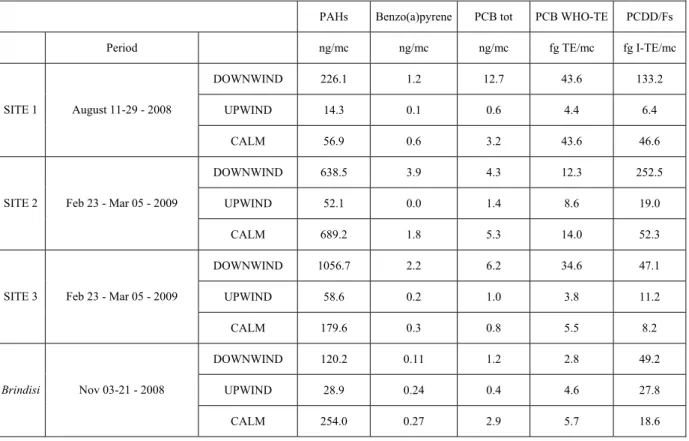
Analytical data with reference to PAHs, benzo(a)pyrene, dioxin-like PCB and PCDD/F, expressed in I-TEQ, are shown in table 2.
A significant difference stands out between downwind and upwind samples, with variations of more than one order of magnitude in POPs concentrations; downwind/upwind ratios clearly indicate the industrial district as the evident source of air pollution.
Moreover, there are remarkable differences depending on the monitoring site position and distance from the industrial area. For example, in site n. 2 benzo(a)pyrene ratio is equal to 92.4. Site n. 1 PCDD/F ratio appears equally remarkable, with a value of 20.9. In fact, site n. 1 is located at a greater height and distance from ILVA steel facility than the other two sites, and this matches well with the more relevant PCDD/F emission source of the zone, that is the sintering unit stack , 210 mt high.
For “wind calm”, we can assume the presence of a concentration gradient which is inversely proportional to the distance from the industrial district.
In table 2, by comparison, we list the results of a monitoring campaign in another site far from Taranto area, i.e. Brindisi, close to a huge coal-fired 2,600 MW power plant, in which POPs downwind/upwind ratios are visibly lower.
Evermore, one should take into account that at the end of 2008, the sinter plant underwent a severe reduced production (more than 2/3).
Table 2: POPs concentrations in Taranto and Brindisi sites
PAHs Benzo(a)pyrene PCB tot PCB WHO-TE PCDD/Fs
Period ng/mc ng/mc ng/mc fg TE/mc fg I-TE/mc
DOWNWIND 226.1 1.2 12.7 43.6 133.2 UPWIND 14.3 0.1 0.6 4.4 6.4 SITE 1 August 11-29 - 2008 CALM 56.9 0.6 3.2 43.6 46.6 DOWNWIND 638.5 3.9 4.3 12.3 252.5 UPWIND 52.1 0.0 1.4 8.6 19.0
SITE 2 Feb 23 - Mar 05 - 2009
CALM 689.2 1.8 5.3 14.0 52.3
DOWNWIND 1056.7 2.2 6.2 34.6 47.1
UPWIND 58.6 0.2 1.0 3.8 11.2
SITE 3 Feb 23 - Mar 05 - 2009
CALM 179.6 0.3 0.8 5.5 8.2
DOWNWIND 120.2 0.11 1.2 2.8 49.2
UPWIND 28.9 0.24 0.4 4.6 27.8
Brindisi Nov 03-21 - 2008
CALM 254.0 0.27 2.9 5.7 18.6
Finally, our “preliminary” wind selective monitoring campaigns showed considerable utility in correlating dioxins and PAH air concentrations of specific origin, which for Taranto industrial area was clearly individuated in ILVA steel factory and, specifically, in sinter plant for PCDD/F and coke oven plant for Policyclic Aromatic Hydrocarbons, allowing also a first evaluation of the impact of these emissions on ambient air.
We are presently carrying an inter-institutional study for aiming an accurate an accurate source-apportionment of POPs.
Acknowledgements
We thank Dr. Antonio Fornaro very much, for his precious help in fitting wind-selective devices and performing monitoring campaigns.
We thank Dr. Tina Mongelli for bibliographic documentation, Dr. Stefano Spagnolo for emission inventory data and Ing. Roberto Primerano for steel industrial process clarification.
References
1. Boscolo M., Padoano E. and Tommasi S. Ironmaking and Steelmaking 2008;35: 146. 2. Kasama S., Yamamura Y. and Watanabe K. ISIJ International 2006; 46: 1014.
3. Aries E., Anderson D.R., Fisher R., Fray T.A.T. and Hemfrey D. Chemosphere 2006; 65: 1470. 4. Primerano R., Esposito V., Angiuli L., Fanigliulo A., Ficocelli S., Giua R., Menegotto M., Nocioni A., Valenzano B., Bisceglia L. and Assennato G. Organohalogen Compounds 2007;69: 966.
5. Quaß U., Fermann M. and Bröker G. Chemosphere 2004; 54: 1319.
6. Chang M.B., Lin J.J. and Chang S.H. Atmospheric Environment 2002; 36: 279.
7. Chang M.B., Chi K.H., Chang S.H. and Chen Y.W. Atmospheric Environment 2004; 38: 2535. 8. Wevers M., De Fré R. and Desmedt M. Chemosphere 2002; 54: 1351.
9. Yu B.W., Jin G.Z., Moon Y.H., Kim M.K., Kyoung J.D. and Chang Y.S. Chemosphere 2006; 62: 494. 10. European Pollution Register Quaß U., Fermann M. and Bröker G. Chemosphere 2004; 54: 1319. 11. Italian Inventory of Emissions and Sources (INES) http:// www.eper.sinanet.apat.it/site/it-IT/.