1.84
m emission of Tm
3+sensitized by Yb
3+ions in monoclinic
KGd
„WO
4…
2single crystals
F. Güell,a兲J. Massons, Jna. Gavaldà, M. C. Pujol, M. Aguiló, and F. Díaz
Física i Cristallografia de Materials (FiCMA), Universitat Rovira i Virgili, Campus Sescelades, C/Marcellí Domingo, s/n, E-43007 Tarragona, Catalunya, Spain
共Received 4 October 2006; accepted 22 November 2006; published online 6 February 2007兲
By exciting at 940 nm, we have characterized the 1.84m near infrared emission of trivalent
thulium ions in Yb3+, Tm3+: KGd共WO4兲2single crystals as a function of the dopant concentration
and temperature, from 10 K to room temperature. An overall3H6Stark splitting of⬃470 cm−1for the Tm3+ions in the Yb3+, Tm3+: KGd共WO4兲2 was obtained. We also studied the blue emission at
476 nm共Tm3+兲 and the near infrared emissions at 1.48m共Tm3+兲 and 1m共Yb3+兲 as a function
of the dopant concentration. Experimental decay times of the1G4, 3H4, and 3F4共Tm3+兲 and2F 5/2
共Yb3+兲 excited states have been measured as a function of Yb3+ and Tm3+ion concentrations. For
the 3F4→3H6 transition of Tm3+ ions, we used the reciprocity method to calculate the maximum
emission cross section of 3.07⫻10−20cm2 at 1.84m for the polarization parallel to the N
m
principal optical direction. © 2007 American Institute of Physics.关DOI:10.1063/1.2433131兴
I. INTRODUCTION
Diode-pumped solid-state lasers operating in the
eye-safe 2m spectral region have applications in a number of
important areas because water has a strong optical absorption band at this wavelength. Potential applications lie in the fields of medicine, laser radar 关light detection and ranging
共LIDAR兲兴, and atmosphere monitoring. Tm3+-doped laser
materials are emerging as sources of light with a broad tun-ability around 2m on the 3F4→3H6 transition. Yb3+ ions
have an extremely simple energy level scheme with only one excited state,2F5/2, above the ground state,2F7/2. An
advan-tage of Yb3+-codoped materials is the intense absorption
band around 1m, which allows them to be pumped with an
efficient high-power InGaAs laser diode. KGd共WO4兲2
共KGW兲 single crystals are very attractive materials as laser
hosts.1 Their monoclinic structure provides an appreciable
optical anisotropy suitable for obtaining polarized laser radiation.2They are easily grown and Gd3+can be efficiently
substituted by Yb3+ and Tm3+ ions.3
An early demonstration of Tm3+ lasing on the 3F4
→3
H6 transition in monoclinic double tungstates was real-ized in 1997 with Xe-flash lamp pumping in which 0.5 at. % Tm3+: KY共WO4兲2 and 0.5 at. % Tm3+: KGW rods sensitized
with 5 at. % Er3+ and 5 at. % Yb3+ operated at cryogenic
temperatures and laser output wavelengths of 1.92 and
1.93m, respectively.4 Soon afterwards, cw room
tempera-ture operation of highly doped 15 at. % Tm3+: KY共WO4兲2
was demonstrated with longitudinal Ti:sapphire laser pump-ing near 800 nm.5They found that the thulium concentration must be high enough to ensure efficient pumping, but low enough to minimize concentration quenching effects due to cross-relaxation-type 共3H4+3H6→3F4+3F4兲 and
nonradia-tive energy transfer between acnonradia-tive ions. In 2002, Yb3+,
Tm3+: KY共WO
4兲2was studied for InGaAs diode pumping at
980 nm with subsequent excitation transfer from Yb3+ to
Tm3+ ions at several dopant concentrations.6,7
Recently, we
demonstrated the successful crystal growth of Tm3+: KGW
and studied its spectroscopic properties.8We obtained highly efficient tunable laser operation in the cw regime at room temperature on the3F4→3H6transition.9
In this paper, we have characterized the near infrared
emission at 1.84m of thulium ions in KGW single crystals
codoped with Yb3+ and Tm3+ ions by pumping at 940 nm.
We analyzed luminescence as a function of Yb3+ and Tm3+
ion concentrations and temperature. The reciprocity method
has been used to calculate the 1.84m emission cross
sec-tion from the absorpsec-tion cross secsec-tion and to compare it with the experimental results. The decay times corresponding to the emitting levels 1G4, 3H4, and 3F4 共Tm3+兲 and 2F
5/2
共Yb3+兲 were measured at several Yb3+and Tm3+ion
concen-trations.
II. EXPERIMENT
We grew good-optical-quality and inclusion-free single
crystals of KGW codoped with Yb3+ and Tm3+ ions at
sev-eral dopant concentrations by the top-seeded-solution-growth
slow-cooling method 共TSSG-SC兲 using K2W2O7 as solvent
according to the method described elsewhere.10 Powdered
precursors of Yb3+, Tm3+: KGW single crystals were K 2CO3,
Gd2O3, Tm2O3, Yb2O3, and WO3 共Fluka, 99.9% pure兲.
These were used to synthesize these types of single crystals
at several Yb3+ and Tm3+ ion concentrations,
KGd1−x−yYbxTmy共WO4兲2, with a binary solution
composi-tion of 11.5 mol % solute/88.5 mol % solvent. TableI
sum-marizes the dopant concentrations of Yb3+ and Tm3+ions in
the crystals measured by electron probe microanalysis 共EPMA兲. The dopant concentrations in the solution are re-lated to the total rare earth content. The substitution of the
a兲Electronic mail: [email protected]
rare earth in KGW for lanthanide ions was limited in the case
of KGW by Yb3+ ions at 10 at. %, when cracks began to
appear.
For the absorption measurements, we used the sample of KGd0.957Yb0.037Tm0.006共WO4兲2 with ytterbium and thulium
concentrations of 5.0 and 0.5 at. % in the solution, respec-tively. We cut and polished the sample with the faces perpen-dicular to the principal optical directions, with a thickness of 4.73 mm for the Nmand 5.35 mm for the Np. Optical absorp-tion spectra were measured with a Varian CARY 500 scan spectrophotometer.
Emission spectra were obtained with an optical para-metrical oscillator, VEGA 100, pumped by the third
har-monic of a Q-switched Nd3+: YAG共yttrium aluminum
gar-net兲 laser 共pulse duration, 7 ns; repetition rate, 10 Hz兲,
SAGA 120, from B.M. Industries. In order to compare the
emission intensities of Yb3+ and Tm3+ ions in different
samples, the measurements were performed under the same
experimental conditions. Fluorescence was dispersed
through a HR460 Jobin Yvon-Spex monochromator 共focal
length, 460 mm; f / 5.3; spectral resolution, 0.05 nm兲. The gratings used were a 1800 groove/ mm grating blazed at
1 m and a 600 groove/ mm grating blazed at 2m. The
detectors applied were Hamamatsu R928 and R5509-72 pho-tomultipliers and a P7163 InAs photovoltaic. These were connected to a Perkin Elmer 7265DSP lock-in amplifier.
Lifetime measurements were taken at various Yb3+and Tm3+
ion concentrations. Time decay curves were recorded using a Tektronix TDS-714 digital oscilloscope. For low temperature 共T艌10 K兲 emission measurements, the samples were mounted into a closed cycle helium cryostat Oxford CCC1104.
III. RESULTS AND DISCUSSION
A. Spectra and luminescence intensities
By pumping at 940 nm, Yb3+ions generated an emission
observed around 1m, corresponding to the 2F5/2→2F7/2
transition. At this pump wavelength, Tm3+ ions generated
emissions observed around 476 nm, 1.48m, and 1.84m,
corresponding to the 1G4→3H6, 3H4→3F4, and 3F4→3H6
transitions, respectively. We found that the intensities of these emissions were strongly affected by the concentrations of Yb3+ and Tm3+ ions. At a fixed Yb3+ concentration, the
intensity of the Yb3+ ion emission decreased as the Tm3+
concentration increased. Figure 1 shows the RT emission
spectra for the 1m emission, for samples with fixed
5.0 at. % Yb3+ and 0.5, 1.5, and 2.5 at. % Tm3+ion concen-trations. Since the emission intensity around 1 m decreases
with increasing Tm3+ ion concentration, the probability of
energy transfer from Yb3+to Tm3+ions is demonstrated to be very high, as observed in other works.11
At a fixed Tm3+concentration, the intensity of Tm3+ion emissions increased as Yb3+concentration increased. Also, at a fixed Yb3+ concentration, the intensity of Tm3+ ion emis-sions increased as Tm3+ concentration increased. Therefore,
the intensity of Tm3+ ion emissions increased as Yb3+ and
Tm3+ ion concentrations increased. Quenching phenomena
of thulium luminescence due to higher Yb3+ and Tm3+ ion
concentrations were not observed in the samples we studied.
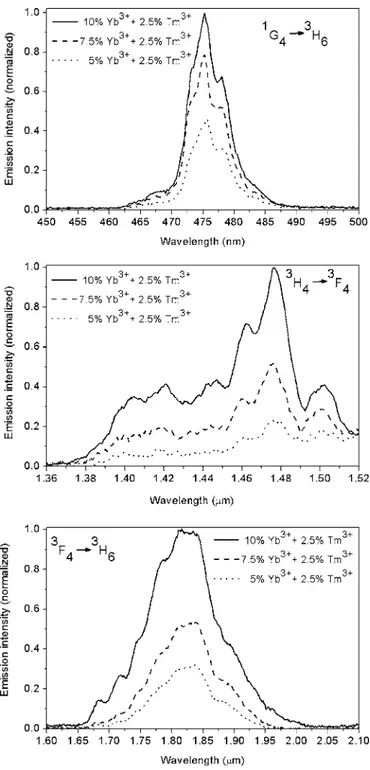
Figure 2 shows the RT emission spectra for the 476 nm,
1.48m, and 1.84 m emissions, for samples with 5, 7.5,
and 10 at. % Yb3+ and fixed 2.5 at. % Tm3+ ion
concentra-tions. Maximum emission intensity was found in samples containing 10 at. % Yb3+and 2.5 at. % Tm3+ion
concentra-tions.
We also analyzed the evolution with temperature of the 1.84m emission channel corresponding to the 3F4→3H6
transition for a 10 at. % Yb3+ and 2.5 at. % Tm3+ sample.
Figure3 shows the temperature dependence of the 1.84m
emission spectrum from 10 K to RT. We labeled the n Stark levels, increasing from 0 to n in energy, n
⬘
for the upper levelFIG. 1. Room temperature spectra of the emission of Yb3+ions as a function
of the combined Yb3+and Tm3+dopant concentration in KGW single
and n for the lower level. We observed seven peaks: at 1.770,
1.790, 1.808, 1.845, 1875, 1913, and 1.931m at 10 K,
which correspond to the electronic transitions 3F4共0
⬘
兲→3
H6共0兲, 3F4共0
⬘
兲→3H6共1兲, 3F4共0⬘
兲→3H6共3兲, 3F4共0⬘
兲 →3H6共7兲, 3F4共0
⬘
兲→3H6共10兲, 3F4共0⬘
兲→3H6共11兲, and 3F4共0
⬘
兲→3H6共12兲, respectively. These Stark sublevels of theground state3H6are located at 0, 69, 119, 227, 315, 427, and 470 cm−1, respectively. At 50 K we identified new peaks at
1.745, 1.755, 1.782, and 1.901m that appeared due to the
thermal population of the upper Stark levels of the 3F4 ex-cited state. From the3F4Stark splitting obtained in our
pre-vious work,12 these peaks correspond to the 3F4共3
⬘
兲→3
H6共0兲, 3F4共2
⬘
兲→3H6共0兲, and 3F4共5⬘
兲→3H6共10兲,transi-tions, respectively. All these results show a small shift from the corresponding energies of the Stark sublevels of the3H6
ground state in Tm3+-doped KGW single crystals13due to the incorporation of Yb3+ions in the lattice.
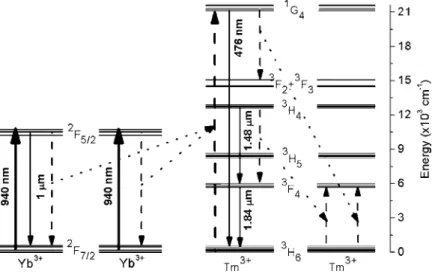
Figure 4 shows a partial energy level diagram of Yb3+
and Tm3+ ions in KGW single crystals,13,14
the possible en-ergy transfer processes and the luminescence channels inves-tigated. The ytterbium pump process and the luminescence channels are marked by solid arrows. The energy transfer
processes from Yb3+ to Tm3+ ions and the cross-relaxation
mechanisms within the Tm3+ energy levels are marked by
dash and dot arrows. The pumping at 940 nm excited only the Yb3+ions; the electronic population was excited from the
ground state2F7/2to the2F5/2energy level. The decay from the2F5/2to the2F7/2energy levels of Yb3+ions generated an
emission around 1m. Two Yb3+ ions in its excited state
2F
5/2transferred their energy to the1G4energy level of Tm3+
ions共2F5/2+2F5/2+3H6→2F7/2+2F7/2+1G4兲 共see Fig.4兲.11,15
The decay from the 1G4 to the 3H6 energy levels of Tm3+
ions generated the emission around 476 nm. Emissions
around 1.48 and 1.84m were generated due to the decay
from the3H4to the3F4and the 3F4to the 3H6energy levels of Tm3+ ions, respectively. The 3F
4 energy level of Tm3+
ions is also populated via two cross-relaxation mechanisms
through the phonon-assisted self-quenching process 共1G4
+3H6→3F2+3F3+3F4 and 3H4+3H6→3F4+3F4兲 共see Fig.
4兲.16 The effectiveness of this quenching process increases with higher thulium concentrations. Note that we have two
steady-state population inversions on the 3H4→3F4 and
3
F4→3H6transitions.
B. Dynamics of the Yb3+– Tm3+energy transfer
We investigated the lifetime of the 1G4, 3H4, and 3F4
共Tm3+兲 and2F
5/2共Yb3+兲 emitting levels as a function of Yb3+
and Tm3+ion concentrations. TableIIsummarizes the results
obtained. The experimental lifetimes of the 1G4 and 3H4
states decreased strongly as thulium concentration increased 共see TableII兲. This is explained by the very efficient energy
transfer mechanisms between thulium ions. The lifetimes of
FIG. 2. Room temperature spectra of the 476 nm 共a兲, 1.48m 共b兲, and 1.84m共c兲 emissions of Tm3+ions as a function of the combined Yb3+and
Tm3+dopant concentration in KGW single crystals by exciting at 940 nm.
FIG. 3. Temperature evolution of the 1.84m emission of Tm3+ions in
the 1G4 and 3H4 共Tm3+兲 and 2F
5/2共Yb3+兲 energy levels for
samples with fixed 5 at. % Yb3+ and 0.5, 1.5, and 2.5 at. %
Tm3+ion concentrations are shown in Fig.5. It can be seen
that the lifetime decreases with increasing Tm3+ion
concen-tration, which shows that the cross relaxation has a consid-erable effect on the lifetime of1G4and3H4energy levels and demonstrates the energy transfer from Yb3+to Tm3+ions due
to the decrease in the lifetime of 2F5/2 energy level. This transfer becomes more efficient with higher concentrations of acceptor ions and hence by a large thulium concentration.
The lifetimes of the 1G4 and 3H4 共Tm3+兲 and 2F
5/2
共Yb3+兲 energy levels for samples with 5, 7.5, and 10 at. %
Yb3+ and fixed 2.5 at. % Tm3+ion concentrations are shown
in Fig. 6. The figure illustrates that the lifetime is almost independent of the Yb3+ ion concentration for the 1G
4 and 3H
4 energy levels. Accordingly, it is considered that no
en-ergy back transfer from Tm3+to Yb3+ions occurs involving
the1G4and3H4energy levels. For the2F5/2energy level, the lifetime decreases with increasing Yb3+ion concentration, so
the energy transfer from Yb3+ to Tm3+ ions could also be
enhanced by a large ytterbium concentration. The reported
value of luminescence lifetime of 2 at. % Yb3+ in KGW
single crystals is 304s,17 whereas we measured 246s
with a sample containing 2.5 at. % of Yb3+and 1.5 at. % of
Tm3+. The shortening of Yb3+ lifetime in the presence of
thulium is evidence that the energy transfer process is
non-radiative, as was also observed in YVO4 single crystals
codoped with Yb3+and Tm3+ions.18
The decay times of the 3F4 energy level, which is the
upper level for laser operation around 2m, for samples
with fixed 5 at. % Yb3+and 0.5, 1.5, and 2.5 at. % Tm3+ion
concentrations are 1730, 1690, and 1560s. The decrease of the measured lifetime with increasing thulium concentration is due to the energy migration within the thulium ions. The experimental lifetimes of the 3F4 state are of the order of milliseconds because it is depopulated to the ground state
3H
6by predominantly radiative decay. So the3F4state is the
storage reservoir and would be interesting for laser operation because of its long lifetime.
C. Calculated emission and gain cross sections for the 1.84m emission
One of the most important parameters influencing the laser performance of a material is the stimulated emission cross section 共e兲. We calculated the emission cross-section spectra of the 3F4→3H6 transition using the so-called reci-procity method 共RM兲.19 The emission cross section 共e兲 is calculated from the absorption cross section 共a兲 and the splitting of the energy levels using the following equation:
e共兲 =a共兲 Zl Zu exp
冋
共EZL− h兲 kBT册
, 共1兲where Zl and Zu are the partition functions and EZL is the
zero line or energy separation between the lowest energy
sublevels of the ground state 共lower兲 and the first excited
state共upper兲, respectively. The partition functions are calcu-lated from
TABLE II. Experimental decay times of the2F
5/2共Yb3+兲 and1G4,3H4, and3F4共Tm3+兲 energy levels in KGW single crystals as a function of Yb3+and Tm3+
ion concentrations.
关Yb3+兴 共at. % in the solution兲 0.5 1.5 2.5 5.0 2.5 5.0 5.0 7.5 10.0
关Tm3+兴 共at. % in the solution兲 0.5 0.5 0.5 0.5 1.5 1.5 2.5 2.5 2.5
共2F 5/2共s兲兲 292 275 311 288 246 218 166 141 117 共1G 4共s兲兲 191 181 183 200 153 141 108 106 103 共3H 4共s兲兲 314 283 269 274 254 252 185 178 176 共3F 4共s兲兲 ¯ ¯ ¯ 1730 1770 1690 1560 1580 1610
Z =
兺
k dkexp冋
− Ek kBT册
, 共2兲where dk and the Ekare the degeneracies and the energies, respectively, of each sublevel of the upper and lower energy levels involved. In our case, the ratio Zl/ Zuwas 1.21 and EZL
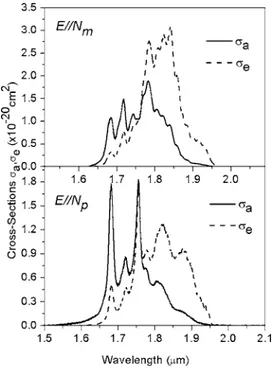
was 5651 cm−1. Figure7 shows the calculated emission and
experimental absorption cross sections for polarizations
E储Nm and E储Np of the 3F4→ 3
H6 transition at RT in the
1.5– 2m range. The maximum absorption cross sections
are 3.07⫻10−20cm2 for the polarization E储Nmat 1.840m and 1.73⫻10−20cm2for the polarization E储N
pat 1.756m.
The maximum emission cross sections are 3.07⫻10−20cm2
for the polarization E储Nm at 1.840m and 1.73
⫻10−20cm2for the polarization E储N
pat 1.756m. For po-larization E储Ng the absorption and emission cross sections are much lower than for polarizations E储Nmand E储Np, and consequently such orientation is not attractive for laser op-eration. Figure7shows that these spectra exhibit the charac-teristic optical anisotropy of the host KGW, where the spec-trum for the E储Nmpolarization is the most intense, resulting in the highest possibility of obtaining polarized stimulated
emission. These absorption and emission cross-section spec-tra will be useful for designing and modeling cw and pulsed lasers.
The 3F4→3H6 transition corresponds to a quasi-three-level laser scheme in which the lower quasi-three-level is thermally populated at RT. This results in considerable reabsorption and an increased threshold for laser operation. Reducing re-absorption and maintaining efficient re-absorption of the pump light is one of the key issues in the design of thulium-doped laser systems at this transition. The reabsorption processes of
the 1.84m emission by resonant transitions occur when
absorption and emission overlapping is important. As a first approximation, the threshold for light amplification is achieved when the emitted light counterbalances the absorp-tion losses. If  is the population inversion rate, the gain cross section can be calculated using gain=e−共1−兲a, whereeandaare the emission and absorption cross sec-tions derived from the RM, respectively, andgainis the ef-fective emission cross section. Figure8shows the gain cross sections calculated for several values of the parameterfor
E储Nmand E储Np polarizations in the 1.7– 2m spectral re-gion for the 3F4→3H6 transition. The figure shows that, in general, the gain for E储Nmis higher. For a population inver-sion level of 0.2, the gain produced is in the 1.85– 1.96m range. The higher energy limit of this interval increased when the population inversion level was increased, reaching
up to 1.76m for a population inversion level of 0.5. For
this level the maximum gain cross-section values were
1.09⫻10−20cm2 at 1.84m for E储Nm and 0.39
⫻10−20cm2at 1.88m for E储N
p.
By averaginge共兲 over the polarizations it is possible to obtain an estimation for the radiative lifetime共rad兲 of the 3F
4energy level using the Füchtbauer-Ladenburg equation.
20
FIG. 5. Tm3+ ion concentration dependence of the lifetime of the2F 5/2
共Yb3+兲 and1G 4and
3H
4共Tm3+兲 energy levels at fixed 5.0 at. % Yb3+.
FIG. 6. Yb3+ ion concentration dependence of the lifetime of the 2F 5/2
共Yb3+兲 and1G
4and3H4共Tm3+兲 energy levels at fixed 2.5 at. % Tm3+.
FIG. 7. Absorption cross sections at RT a corresponding to the 3H6
→3F
4transition recorded for polarizations E储Nmand E储Np共solid lines兲 and
emission cross sectionsa共dashed lines兲 calculated using the reciprocity
The error originating from the thermal distribution of the population in the ground state3H6at room temperature when calculatinga共兲 can be suppressed by integrating the corre-sponding equation over the frequency21
1
rad
= 8n2
冕
具e共兲典2 d, 共3兲
where具 典 denotes averaging over the polarizations. Using the
e共兲 dependence as calculated with the reciprocity method 共Fig.7兲 we thus arrive atrad= 1280s at room temperature
for 5.0 at. % Yb3+ and 0.5 at. % Tm3+ ion concentrations.
The measured value is = 1730s 共see TableII兲. To
com-pare the potential laser capabilities of different media it is better to use the characteristic valuee关the laser threshold
is proportional to 共e兲−1兴. This value is 5.31
⫻10−20cm2ms for polarization E储N
m and is therefore
higher than the one for Tm3+: YAG 共e= 2.31
⫻10−20cm2ms兲, which is one of the most efficient thulium
laser systems.22
IV. CONCLUSIONS
In conclusion, we studied the 1.84m near infrared
emission as a function of the dopant concentration and tem-perature pumping at 940 nm. Maximum emission intensity was found in samples containing 10 at. % Yb3+and 2.5 at. %
Tm3+ ion concentrations. From the polarized RT optical
ab-sorption measurements, we calculated the stimulated emis-sion cross section using the reciprocity method. The
maxi-mum emission cross sections are 3.07⫻10−20cm2 at
1.840m and 1.9⫻10−20cm2at 1.756m for the
polariza-tion parallel to the Nm and Np principal optical directions, respectively. We were therefore able to calculate the optical gain for several population inversion rates and determine the spectral region in which light amplification is possible for future laser experiments using this material. From the gain
ACKNOWLEDGMENTS
We gratefully acknowledge financial support from CICyT under Project Nos. JCI-2005-1924-13, MAT2005-06354-C05-03, MAT2004-20471-E, and
FiT-020400-2005-14, from the EU-Commission Project DT-CRYS 共STRP—
NMP3-CT-2003-505580兲, and from CIRIT under Project No. 2005SGR658.
1A. A. Kaminskii, Crystalline Lasers: Physical Processes and Operating
Schemes共CRC, Boca Raton, FL, 1996兲.
2M. C. Pujol, X. Mateos, R. Solé, J. Massons, J. Gavaldà, X. Solans, F.
Díaz, and M. Aguiló, J. Appl. Crystallogr. 34, 1共2001兲.
3M. C. Pujol, R. Solé, J. Gavaldà, M. Aguiló, F. Díaz, V. Nikolov, and C.
Zaldo, J. Mater. Res. 14, 3739共1999兲.
4A. A. Kaminskii, L. Li, A. V. Butashin, V. S. Mironov, A. A. Pavlyuk, S.
N. Bagaev, and K. Ueda, Jpn. J. Appl. Phys., Part 2 36, L107共1997兲.
5S. N. Bagaev, S. M. Vatnik, A. P. Maiorov, A. A. Pavlyuk, and D. V.
Plakushchev, Quantum Electron. 30, 310共2000兲.
6A. A. Demidovich, A. N. Kuzmin, N. K. Nikeenko, A. N. Titov, M. Mond,
and S. Kueck, J. Alloys Compd. 341, 124共2002兲.
7L. E. Batay, A. A. Demidovich, A. N. Kuzmin, A. N. Titov, M. Mond, and
S. Kück, Appl. Phys. B: Lasers Opt. 75, 457共2002兲.
8F. Güell, Jna. Gavaldà, R. Solé, M. Aguiló, F. Díaz, M. Galán, and J.
Massons, J. Appl. Phys. 95, 919共2004兲.
9V. Petrov, F. Güell, J. Massons, Jna. Gavaldà, R. Solé, M. Aguiló, F. Díaz,
and U. Griebner, IEEE J. Quantum Electron. 40, 1244共2004兲.
10M. C. Pujol, M. Aguiló, F. Díaz, and C. Zaldo, Opt. Mater.共Amsterdam,
Neth.兲 13, 33 共1999兲.
11J. Qiu and Y. Kawamoto, J. Appl. Phys. 91, 954共2002兲.
12F. Güell, R. Solé, Jna. Gavaldà, M. Aguiló, M. Galán, F. Díaz, and J.
Massons, Opt. Mater.共Amsterdam, Neth.兲 共accepted兲.
13F. Güell, X. Mateos, R. Solé, Jna. Gavaldà, M. Aguiló, F. Díaz, and J.
Massons, J. Lumin. 106, 109共2004兲.
14N. V. Kuleshov, A. A. Lagatsky, A. V. Podlipensky, V. P. Mikhailov, and
G. Huber, Opt. Lett. 17, 1317共1997兲.
15X. Pei, Y. Hou, S. Zhao, Z. Xu, and F. Teng, Mater. Chem. Phys. 90, 270
共2005兲.
16I. R. Martín, C. Goutaudier, S. Guy, Y. Guyot, G. Boulon, M. T.
Cohen-Adad, and M. F. Joubert, Phys. Rev. B 60, 7252共1999兲.
17V. E. Kisel, A. E. Troshin, V. G. Shcherbitskz, and N. V. Kuleshov, ASSP
2004共unpublished兲, Paper No. WB7.
18R. Lisiecki, G. Dominiak-Dzik, T. Lukasiewicz, and W.
Ryba-Romanowski, J. Mol. Struct. 704, 323共2004兲.
19D. E. McCumber, Phys. Rev. 136, A954共1964兲.
20L. D. Deloach, S. A. Payne, L. L. Chase, L. K. Smith, W. L. Kway, and W.
F. Krupke, IEEE J. Quantum Electron. 29, 1179共1993兲.
21F. D. Patel, E. C. Honea, J. Speth, S. A. Payne, R. Hutcheson, and R.
Equal, IEEE J. Quantum Electron. 37, 135共2001兲.
22S. A. Payne, L. L. Chase, L. K. Smith, W. L. Kway, and W. F. Krupke,
IEEE J. Quantum Electron. 28, 2619共1992兲. FIG. 8. Gain cross sections of the 1.84m emission at RT for polarizations