ALMA MATER STUDIORUM – UNIVERSITY OF BOLOGNA
SCHOOL OF ENGINEERING AND ARCHITECHTURE
Master Thesis
Tunnelling-induced deformation and damage on
framed structures with masonry infills
Supervisor:
Prof. Daniela Boldini
Co-supervisor:
Dr. Andrea Franza
Candidate:
Seyedmohsen Miraei
Table of Contents
i Table of Contents
Table of Contents ... i
Chapter. 1. Introduction ... 7
1.1 Background and motivations ... 7
1.2 Problem description ... 8
1.3 Organization and objectives of the thesis ... 9
Chapter. 2. Soil-structure interaction due to tunnelling ... 10
2.1 Soil and tunnel volume losses ... 10
2.2 Greenfield tunnelling-induced subsidence ... 13
2.3 Estimated damage for buildings ... 16
2.3.1 Building deformation parameters ... 18
2.3.2 Deformation parameters in masonry structures ... 20
2.3.3 Deformation parameters in framed structures ... 23
2.3.4 Damage prediction with equivalent beam approach ... 28
2.3.5 Response of infills ... 30
2.4 Risk assessment ... 32
2.4.1 Damage classification ... 33
Chapter. 3. Geotechnical modelling in centrifuge tests ... 37
3.1 Geotechnical centrifuge ... 37
3.2 Modelling of tunnelling ... 40
3.2.1 Instrumentation ... 41
3.3 Experimental case study: centrifuge tests at the University of Nottingham ... 42
3.3.1 Geotechnical centrifuge ... 42
3.3.2 Digital image analysis ... 47
3.3.3 Centrifuge experiments on tunnel frame interaction ... 48
Chapter. 4. Finite element modelling ... 51
4.1 PLAXIS ... 52
Table of Contents
ii
4.2.1 Basic concepts ... 55
4.2.2 Elastic and plastic strains ... 56
4.2.3 Critical state ... 57
4.2.4 Yield surface ... 57
4.2.5 Dilatancy, bounding and critical surfaces ... 57
4.2.6 Plastic flow ... 58
4.3 Implementation of SANISAND model in PLAXIS ... 58
4.4 Mechanical behaviour of Leighton Buzzard Sand ... 60
4.4.1 Physical properties of the sand ... 60
4.4.2 Experimental program ... 61
4.5 Calibration of parameters for SANISAND constitutive law ... 63
Chapter. 5. Numerical modelling of tunnel-bare frame interaction ... 66
5.1 Geometry and problem dimensions ... 66
5.2 Material properties ... 67
5.3 Performed analyses in PLAXIS 2D ... 68
5.3.1 Greenfield ... 69
5.3.2 Frame structure ... 71
5.3.3 Validation of the numerical results ... 73
5.4 Performed analyses in PLAXIS 3D ... 75
5.4.1 Greenfield ... 75
5.4.2 Frame structures ... 77
5.4.3 Validation of the numerical results ... 79
Chapter. 6. Tunnel frame with infills ... 81
6.1 Central structures: the effects of building length ... 84
6.1.1 Numerical model: 𝟐𝐒𝐞𝟎𝐋 ... 84
6.1.2 Numerical model: 𝟓𝐒𝐞𝟎𝐋 ... 86
6.2 Eccentric structures: the effects of building tilt ... 88
6.2.1 Numerical model: 𝟐𝐒𝐞𝟎𝟐𝐋 ... 89
6.2.2 Numerical model: 𝟐𝐒𝐞𝟎𝟓𝐋 ... 91
6.2.3 Numerical model: 𝟐𝐒𝐞𝟎𝟓𝐒 ... 93
6.2.4 Numerical model: 𝟓𝐒𝐞𝟎𝟐𝐋 ... 95
Table of Contents
iii
6.2.6 Numerical model: 𝟓𝐒𝐞𝟎𝟓𝐒 ... 99
6.3 Evaluation of deformation and damage parameters ... 101
6.4 Level of damage based on limiting tensile strains ... 110
Chapter. 7. The effects of openings in the infill walls ... 117
4
Acknowledgments
Throughout the writing of this dissertation I have received a great deal of support and assistance.
I would first like to thank my supervisor, Professor Daniela Boldini, for her dedicated support and guidance. She continuously provided encouragement, and her insightful feedback pushed me to sharpen my thinking and brought my work to a higher level.
I would also like to thank my co-supervisor, Dr. Andrea Franza, for his valuable guidance throughout my studies. He provided me with the tools that I needed to choose the right direction and successfully complete my dissertation.
In addition, I would like to thank Dr. Nunzio Losacco for providing advice regarding analysis and for his valuable contribution through this research.
In addition, I would like to thank my parents for their wise counsel and sympathetic ear. You are always there for me.
5
List of Publications
Conference papers
Boldini, D., Losacco, N., Franza, A., Miraei, M., Numerical modelling of framed structures with
masonry infills affected by tunnelling-induced deformations and damage, IS-Cambridge 2020, 10th
International Symposium on Geotechnical Aspects of Underground Construction in Soft Ground, Accepted, Cambridge, England, Accepted, 2020.
Boldini, D., Losacco, N., Franza, A., Miraei, M., Tunnelling-induced displacements and damage
on framed structures: comparison between centrifuge and numerical results, IACMAG, 16th
International conference of the International Association for Computer Methods and Advances in Geomechanics, Submitted, Turin, Italy, Accepted, 2020.
6
ABSTRACT
The expansion of cities often involves tunnel construction, which may result in detrimental effects on structures.This research describes a numerical approach aimed at investigating the interaction between tunnelling-induced ground deformations and framed buildings with masonry infills. This study includes experimental data obtained from geotechnical centrifuge tests and predictions of building response based on numerical analyses. The numerical model, analysed with the Finite Element method, includes the soil, the tunnel, and the framed structure with infills. It proved its capability in reproducing the soil response at different values of the volume loss and the principal soil-structure interaction mechanisms, including sliding and development of a gap at the soil-foundation interface. In addition, a large number of framed building models were simulated to investigate the effects of volume loss of the tunnel, presence of masonry infills, opening of infills, eccentricity, and dimensions of the building. The results are summarised in terms of angular distortion values for each bay as well as local tensile strains in the masonry infills. Moreover, the efficiency of angular distortion models in predicting the maximum tensile strain of the infills is also evaluated. Finally, the maximum tensile strains of infills are used to evaluate the building deformation based on the damage classifications.
Keywords:
tunnel subsidence, soil/structure interaction, centrifuge modelling, finite-element modelling, framed structure, masonry infills.
7
Chapter. 1. Introduction
1.1
Background and motivations
The development of cities and urban areas is resulting in an increased demand for sustainable transport and services infrastructure. Underground construction and infrastructure that often require the excavation of tunnels represent an ideal solution to satisfy these needs. Nowadays, tunnels are the most used techniques of transport in metropolitan cities of the world. Also, tunnel construction is increasingly taking place close to buried and surface structures. If protective measures are not adopted, tunnel construction inevitably affects existing structures due to the induced ground movements and stress relief which in some cases could represent damage for buildings located on the ground level. To optimize the design of tunnel excavations and minimize the surface movements generated by the excavation of a tunnel (which involves assessing tunnelling-induced greenfield soil movements, the deformations induced on structures resulting from soil-structure interactions, and the risk of failure), engineers need to be able to efficiently predict building distortions considering soil-structure interaction.
Current design approaches for the evaluation of tunnelling induced damage on buildings are based on semi-empirical evaluations of the deflection ratios and horizontal tensile strains at foundation level, assuming that the structure will conform to the greenfield displacements (Peck, 1969; Burland and Wroth, 1975; Burland, 1977; O'Rrielly and New, 1982; Boscardin and Cording, 1989; Burland, 1997). The response of buildings to tunnelling-induced ground movements has been investigated extensively (Pickhaver et al., 2010; Amorosi et al., 2014; Farrell et al., 2014; Bilotta et al., 2017). While the effect of tunnel excavation on masonry structures has been thoroughly studied (e.g. Potts and Addenbrooke (1997); Burd et al. (2000); Pickhaver et al. (2010); Amorosi et al. (2014); Losacco et al. (2014); Losacco et al. (2016)), the response of framed buildings have been received only limited attention in the past (e.g., Goh and Mair (2014); Fargnoli et al. (2015); Boldini et al. (2018); Xu et al. (2019); Xu et al. (2020); Xu et al. (2020)). Although the characteristics of the framed buildings must be considered during the evaluation of risk (Cook, 1994; Boone, 1996; Son and Cording, 2005), equivalent beam or plate models characterized by minimal shear flexibility are often adopted (Franzius, 2003; Pickhaver et al., 2010; Maleki et al., 2011; Farrell et al., 2014; Bilotta et al., 2017; Franza and Marshall, 2019).
8 According to recent studies, the effect of structural details (e.g., building position, presence of masonry infills, openings, and building dimensions) on the soil-structure interaction problem requires further research.
1.2
Problem description
Due to the lack of an experimental investigation on the effect of structural details on the soil-structure interaction problem, the research has focused on the development of numerical models capable of predicting the deformations and damages. The main goal of this research is providing experimental and numerical evidence regarding tunnel-soil-frame building interaction problems for which there is not enough availability of reliable data.
In this study, the numerical simulations were inspired by a set of centrifuge tests performed at the Nottingham University focusing on the response of framed buildings on raft foundations to tunnelling (Xu et al., 2019). A fine dry silica sand, known as Leighton Buzzard Fraction E, was adopted in all the experiments.
This research addresses the response of framed structures to tunnel excavation with 2D and 3D numerical approaches based on the Finite Element method of varying complexity and explores the role played by masonry infills. More specifically, the soil-structure interaction problem is simulated using advanced numerical models (considering the masonry infills, foundations, and the structural members of the building in fair detail and using an advanced elasto-plastic constitutive model for the soil). The soil behaviour is simulated by adopting the SANISAND bounding surface plasticity model originally proposed by Dafalias and Manzari (2004). SANISAND constitutive model is employed to capture the evolution of the displacement field with increasing volume loss. In contrast, a linear elastic constitutive law is adopted for the structural elements (i.e. the frame and the infills).
The thesis aims to investigate how a framed building with masonry infills responds to tunnelling-induced ground movements in terms of foundation and superstructure displacements. In this research, the finite element model was initially validated against available centrifuge data and proved to fairly reproduce the main mechanisms of the soil-structure phenomenon, including the formation of a gap and the relative sliding between the foundation and the soil. As mentioned, SANISAND constitutive model is used for the soil to simulate the tunnel excavation which plays an important role in the compatibility between the
9 experimental and numerical results. Accordingly, model parameters were preliminary calibrated against available laboratory and centrifuge tests performed on the Leighton Buzzard sand in the framework of other experimental campaigns (Visone and Santucci De Magistris, 2009; Farrell, 2011). Subsequently, an analysis of simulating greenfield conditions was also carried out, to serve as a reference. Afterward, both the cases of a bare frame and of a frame with masonry infills were studied, the latter being the building components most prone to tunnelling-induced damage. In these cases, the effects of structural stiffness and details (such as the presence of masonry infills, openings, building positions, and building dimensions) and variation of volume loss of the tunnel are the main factors in this study on the prediction of deformations and damages induced by tunnelling. Finally, results are summarized in terms of foundation displacements, shear strains for each bay, and maximum tensile strains of the masonry infill walls. Eventually, the maximum tensile strains of infills are used to evaluate the building deformation based on the damage classifications.
1.3
Organization and objectives of the thesis
This dissertation is structured as follows.- A review of the relevant literature to this research is provided in Chapter 2.
- The centrifuge model, experimental method, and centrifuge tests carried out by researchers at the University of Nottingham are summarised in Chapter 3.
- The Finite Element modelling and the implementation of SANISAND constitutive model are explained in Chapter 4.
- Chapter 5 reports the numerical modelling of tunnel-bare frame interaction performed in PLAXIS 2D and 3D and its comparison with the experimental centrifuge tests . - In Chapter 6, the effects of volume loss of the tunnel, presence of masonry infills,
eccentricity, and dimensions of the building on vertical and horizontal ground movements due to tunnelling in sands are studied. Also, shear strains for each bay and maximum tensile strains of the masonry infill walls are predicted for all cases.
- In chapter 7, the presence of openings in masonry infills is investigated on both structural stiffness and damage.
10
Chapter. 2. Soil-structure interaction due to tunnelling
The prediction of building distortion induced by tunnelling construction is nowadays a key issue in the planning process of any new underground projects. The main purpose of the latest studies is related to obtain a better understanding of the mechanism which can predict and control this interaction problem. Firstly, greenfield tunnelling is discussed with reference to tunnelling-induced subsidence and the prediction methods. The subsequent sections discuss the damage estimation for masonry and framed buildings. Finally, the classification of building damage is described for risk assessment.
2.1
Soil and tunnel volume losses
Ground movements are induced by the soil moving towards the drilling machine due to the stress-relief, which results in a ground loss. Generally, ground loss depends on the tunnel construction method (either open-faced or closed-face excavation using tunnel boring machines (TBMs)). There are two key parameters to describe the ground loss in tunnelling: the tunnel volume loss, 𝑉 𝑙,𝑡, and the soil volume loss, 𝑉 𝑙,𝑠, whose concept is shown in Figure 2.1.
Figure 2.1. (a) Illustration of the concept of soil and tunnel volume losses; (b) typical
tunnel volume loss distribution for shallow tunnels according to Loganathan and Poulos (1998) and Zhou (2015).
𝑉 𝑙,𝑠 is the ratio between the volume of the settlement trough per unit length of tunnel, 𝑉 𝑠, and the theoretical final area of the tunnel cross section, 𝑉 0.
11 Eq. 2.1 𝑉𝑙,𝑠= 𝑉𝑠
𝑉0 × 100 [%]
𝑉 𝑙,𝑡 is the ratio between the ground loss at the tunnel boundary, ∆𝑉, and the theoretical final area of the tunnel cross section, 𝑉 0.
Eq. 2.2 𝑉𝑙,𝑡 = ∆𝑉
𝑉0 × 100 [%]
Both of these key parameters are expressed as a percentage. In a brief description, 𝑉 𝑙,𝑡 is used to describe the magnitude of the tunnel overexcavation and contraction while 𝑉 𝑙,𝑠 is determined based on the field-measured settlements, obtained using instrumentation and monitoring methods.
The distribution of ground loss at the tunnel boundary plays an important role when modelling tunnel excavation. Some analytical approaches assume a uniform convergence around the tunnel; however, this assumption does not describe actual conditions adequately. According to the recent studies, the tunnel volume loss distributions are different in clays and sands. Figure 2.1(b) shows that the actual tunnel ground loss is distributed similar to an elliptical shape in clays, whereas the ground loss is concentrated at the tunnel crown in sands (Rowe and Kack, 1983; Loganathan and Poulos, 1998; Marshall, 2009; Zhou, 2015).
Different volume losses are expected on the basis of the adopted construction method (Mair, 1978; Mair and Taylor, 1997):
- for open face tunnelling, volume losses in stiff clays, such as London Clay, are generally between 1% to 2%.
- construction with sprayed concrete linings (NATM) is effective in controlling ground movements. It is reported in London Clay that the volume losses varying from 0.5%-1.5%.
- for closed tunnelling with pressurised face, a high degree of settlement control can be achieved, using earth pressure balance (EPB) or slurry shields, particularly in sands where volume losses are often as low as 0.5%. The volume losses of only 1%-2% have been reported in soft clays (excluding consolidation settlements). Volume losses may be higher in mixed face conditions for EPB or slurry shields, particularly where sands or gravels overlie stiff clays.
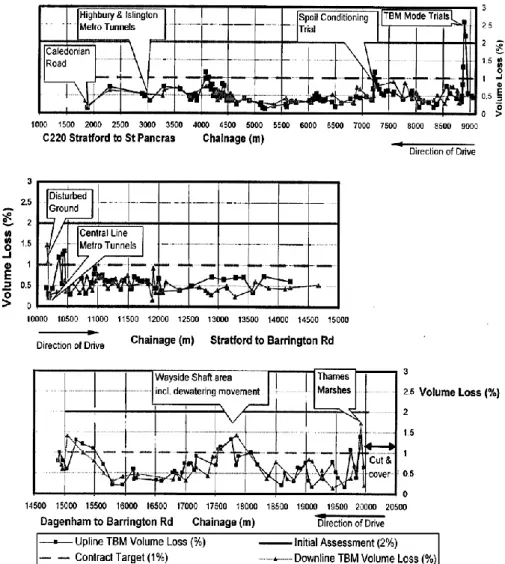
As an example, Figure 2.2 illustrates the variation of volume losses during tunnelling works for the tunnels of the channel rail link (CTRL) in London using earth pressure balance (EPB)
12 machine. These results refer to approximately 34km of 8.15m outer diameter tunnel bored through a variety of soils.
In London Clay, the short-term subsurface ground displacements are measured from the construction of the twin-bore Crossrail tunnels by EPB machines. Subsurface ground displacements were measured with surface monitoring by precise levelling and micro-meter stick measurements to provide absolute displacements. Clear insights were gained into subsurface displacement mechanisms: an ‘inward’ displacement field was observed around the cross-rail tunnel construction, in contrast to the ‘outward’ displacement field that developed around the shallower Channel tunnel rail link (Wan et al., 2017).
Figure 2.2. Volume losses observed on London tunnels of the channel rail link (CTRL)
(Leca and New, 2007).
In another example, relative to the excavation by an EPB machine of the metro line 5 in Milan in sands and gravels, an average volume loss of 0.5% was achieved (Boldini et al., 2016).
13
2.2
Greenfield tunnelling-induced subsidence
The construction of a tunnel causes both settlements (𝑆𝜐) and horizontal (𝑆ℎ) displacements in the ground. “Greenfield” conditions indicate a tunnelling scenario without nearby surface or buried structures. The resulting three-dimensional ‘settlement trough’ induced at the surface by tunnelling is shown in Figure 2.3. To simplify the three-dimensional distribution of ground movements in Figure 2.3, 𝑥, 𝑦 and 𝑧 directions are used to show the transversal, longitudinal and vertical settlements, respectively. Engineers tend to study the distribution of ground movements considering the two-dimensional cross sections corresponding to the transverse and longitudinal planes defined with respect to the tunnel axes.
Figure 2.3 Tunnel induced settlement trough after Attewell et al. (1986).
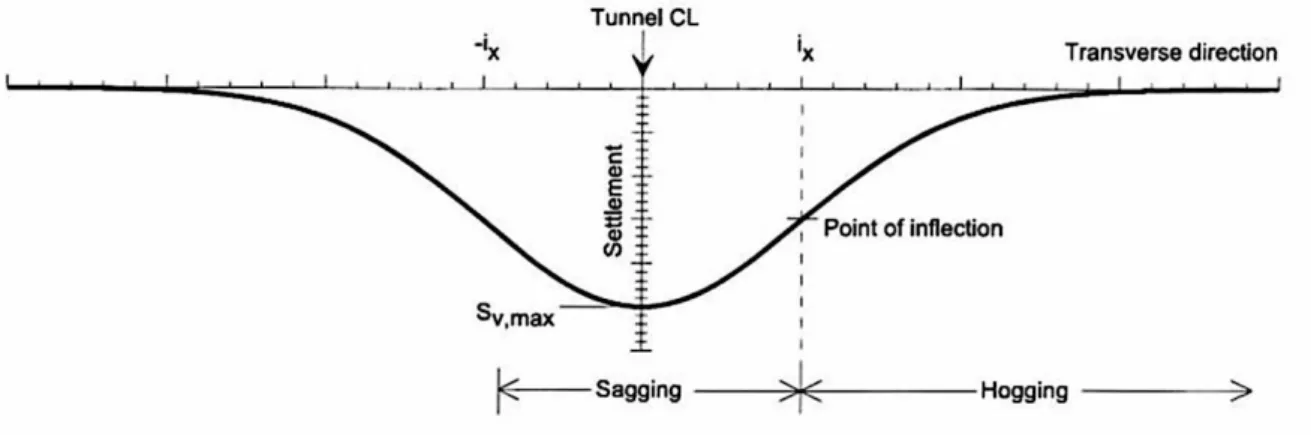
The assessment of greenfield settlements is often carried out by adopting empirical and semi-empirical expressions calibrated on the basis of on-site measurements. For simplicity, the final steady-state settlement distribution transverse to the tunnel axis is often approximated to a Gaussian distribution curve. Figure 2.4 illustrates an idealized transverse settlement trough approximated by a Gaussian curve (Peck, 1969), as a function of the horizontal offset x: Eq. 2.3 𝑆𝜐 = 𝑆𝜐,𝑚𝑎𝑥 . exp (−
𝑥2 2𝑖𝑥2)
where 𝑆𝜐,,𝑚𝑎𝑥 is the maximum settlement on the tunnel centre-line and 𝑖𝑥 is the horizontal distance from the tunnel centre-line to the point of inflection of the settlement trough. O'Rrielly and New (1982) proposed a linear relationship between distance of deflection (𝑖𝑥) and tunnel
14 Eq. 2.4 𝑖𝑥= 𝐾 . 𝐻
where K depends on the soil type; K=0.4-0.5 for stiff clays, K=0.6-0.7 for soft silty clays, and
K=0.2-0.3 for coarse-grained soils above water table level.
Figure 2.4. Gaussian curve used to describe the transverse settlement trough (Franzius et
al., 2006).
The volume of the settlement trough per unit length of tunnel, 𝑉𝑠 , is obtained by integrating
the Gaussian curve as follows
Eq. 2.5 𝑉𝑠= ∫−∞∞ 𝑆𝑉𝑑𝑥 = √2𝜋 𝑖𝑥 𝑆𝜐,𝑚𝑎𝑥
𝑆𝜐,𝑚𝑎𝑥 can be easily derived from Eq. 2.5:
Eq. 2.6 𝑆𝜐,𝑚𝑎𝑥= 𝑉𝑠
√2𝜋 𝑖𝑥
Eq. 2.7 𝑉𝑙,𝑠 = 𝑉𝑠
𝐴 × 100
Eq. 2.5 can be inserted in the Eq. 2.3 to express the settlement profile as a function of the volume loss:
Eq. 2.8 𝑆𝜐(𝑥) = 𝑉𝑙,𝑠
√2𝜋 𝑖𝑥exp (−
𝑥2 2𝑖𝑥2)
As far as the y-axis is concerned, the maximum settlement recorded along the longitudinal section (y and z axes, with x = 0) can be expressed by the integral form of the Gauss function, indicated by the term 𝐹(𝑦) (Figure 2.5). Attewell (1982) proposed the distribution in y direction with a function 𝐹(𝑦), where the parameter 𝑖𝑦 is having the same meaning of 𝑖𝑥. The value of 𝐹(𝑦 = 0), in correspondence to the tunnel face, is 50% of the maximum settlement (Figure 2.5).
15
Figure 2.5. Longitudinal settlement trough (Franzius et al., 2006).
Finally, the subsidence curve can be expressed by the general expression: Eq. 2.9 𝑆𝜐(𝑥, 𝑦) = 𝑆𝜐,𝑚𝑎𝑥 𝐹 (𝑦
𝑖𝑦) exp (−
𝑥2 2𝑖𝑥2)
Besides the vertical displacements, building damages can also be caused by horizontal tensile strains which result from horizontal movements of ground surface. However, there are uncertainties in the estimation of greenfield horizontal movements because of the lack in monitoring data. In this way, the horizontal displacement, 𝑆ℎ, is related to 𝑆𝜐 by:
Eq. 2.10 𝑆ℎ = 𝑆𝜐.𝑥
𝐻
from which it follows that
Eq. 2.11 𝑆ℎ(𝑥) = 𝑆𝜐.𝑥 𝐻 = 𝑥 𝐻 𝑉𝑠 √2𝜋 𝑖𝑥exp (− 𝑥2 2𝑖𝑥2)
Horizontal strains are obtained by deriving the previous expression: Eq. 2.12 𝜀ℎ(𝑥) = 𝜕𝑆ℎ 𝜕𝑥 = 𝑆𝜐. 𝐻 ( 𝑥2 𝑖𝑥2− 1)
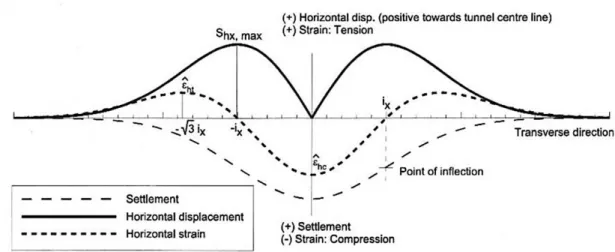
The distribution of horizontal and vertical displacements as well as of horizontal strains is plotted in Figure 2.6. In this figure, it can be observed that the maximum horizontal displacement occurs at the inflection point of the settlement curve. The curvature of the settlement curve defines two distinct areas at the ground surface, respectively named hogging and sagging zones (Figure 2.7).
16
Figure 2.6. Distribution of settlements, horizontal displacements, and strains after Franzius
et al. (2006).
Figure 2.7. Definition of hogging and sagging zones (Franzius et al., 2006).
2.3
Estimated damage for buildings
The excavation of a new tunnel will generate ground movements that can detrimentally affect existing structures, including buildings. It should be recognized that the building and the ground interact with each other in a complex soil-structure interaction problem; typically, the stiffness of the existing structure reduces its resulting deformations.
17
Figure 2.8. Typical idealized building response (Attewell et al., 1986; Leca and New,
2007).
Existing structures can be masonry structures and framed structures (e.g., steel and reinforced concrete structures). For frames, structures will have a high level of bending stiffness and tend
18 to be subjected to shear rather than bending. The building height (number of floors), the building length (short and long buildings), the number of openings, the type of structure (concrete walls, beams and pillars, etc.) and eccentricity play the most important role on the response pattern. Figure 2.8 illustrates some idealized response patterns have been sketched for typical building configurations, either narrow or long, and in relation to their location with respect to the settlement trough.
The following types of movements can occur in a structure located in the vicinity of a tunnel: - uniform settlements (or heave)
- differential settlements (or heave) between supports - overall or differential rotation
- overall horizontal displacements
- differential horizontal displacement in compression or extension
The current design approaches to assess the potential damage to buildings consider that the structure conform to the greenfield displacements (Burland, 1977; O'Rrielly and New, 1982; Boscardin and Cording, 1989; Burland, 1997). More refined analyses can be made by taking into account the buildings in a simplified fashion with equivalent beams or solids (Potts and Addenbrooke, 1997; Franzius et al., 2006; Pickhaver et al., 2010; Maleki et al., 2011; Farrell et al., 2014; Losacco et al., 2014) or in details in the context of advanced numerical analyses (Amorosi et al., 2014; Fargnoli et al., 2015; Bilotta et al., 2017; Boldini et al., 2018).
This section reviews previous studies on soil-structure interactions due to the tunnelling and its effects on structures with shallow foundations.
2.3.1 Building deformation parameters
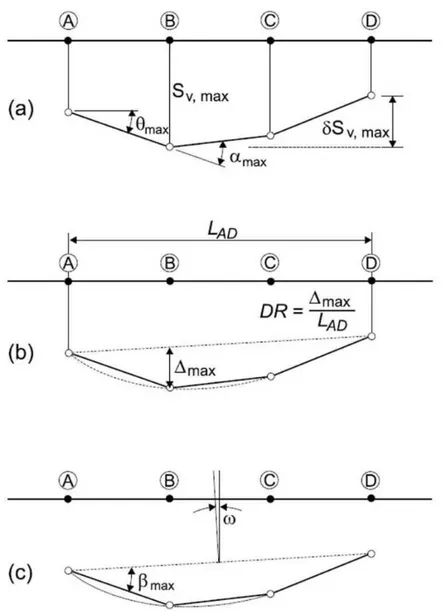
Tunnel excavation causes vertical and horizontal movements at the foundation level that results in load redistributions, structural damage and strain variation within the structure. Eventually, structures can experience local cracks and loose the bearing capacity of the structural elements. The main deformation parameters to be considered are listed as bellow and illustrated in Figure 2.9:
- settlement, 𝑆𝑣
- maximum relative settlement, 𝛿𝑆 𝑣,𝑚𝑎𝑥
19 - angular strain, 𝛼 𝑖 : the difference between two slopes at edges of one point.
- angular distortion (or relative rotation), 𝛽 𝑖,𝑗 : the rotation of the straight line connecting
two points relative to their tilt.
- relative deflection, ∆𝑚𝑎𝑥 : defined with respect to a line connecting two points is the
maximum distance between the settlement curve and the straight line.
- deflection ratio, 𝐷𝑅 = ∆𝑚𝑎𝑥⁄ : the ratio between the relative deflection between two 𝐿 points and their horizontal distance.
- tilt, 𝜔 : the rigid body rotation of the entire structure or part of it.
Figure 2.10 shows the definition of these deformation parameters in hogging and sagging zones.
20
Figure 2.10. Definition of building deformation parameters in (a) sagging (b) hogging
(Franza, 2017).
2.3.2 Deformation parameters in masonry structures
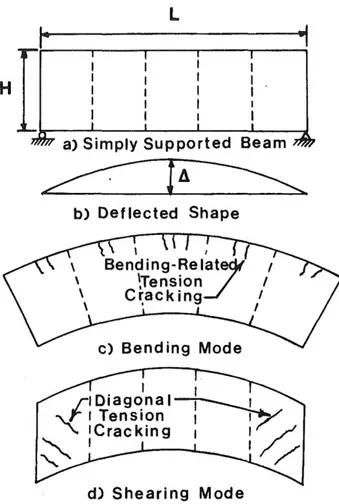
The deformation mechanism of the structure should be completely evaluated to determine the response of structures due to tunnelling. For this reason, tunnelling engineers usually assess the tensile strain in structural elements and evaluate the risk of damage in the building. Mair et al. (1996), Burland (1977) and Boscardin and Cording (1989) provided the standard procedure for preliminary risk assessment of surface structures to tunnelling-induced movements. By idealizing the structure as an equivalent weightless, linear-elastic, and isotropic beam, Burland (1977) calculated the maximum extreme bending strain, 𝜀 𝑏𝑚𝑎𝑥, and the shear (or diagonal) strain, 𝜀 𝑑𝑚𝑎𝑥, from the deflection ratio, 𝐷𝑅 = ∆ 𝐿⁄ for a hogging or sagging deflected shape. In this method, the equivalent beam is supposed to have a length, L, height,
H, and unit thickness. Figure 2.11 illustrates the shape of equivalent beam model with its
possible modes of deflection including bending and shear.
In most structures, the equivalent beam deflects in a combined mode of bending and shearing. Timoshenko (1957) introduced a formula to compute the total midspan deflection, ∆, for the case of a simply supported beam with a central load:
Eq. 2.13 ∆= P𝐿3
48𝐸𝐼 [1 + 18𝐸𝐼 𝐿2𝐻𝐺]
21
Figure 2.11. An equivalent beam idealization with the possible modes of deflection on
cracking (Boscardin and Cording, 1989).
In the hogging zone, the neutral axis can be set at the lower edge of the beam model because the foundations are likely to offer considerable restraint causing the neutral axis to move downwards. Burland and Wroth (1975) suggest to assume the neutral axis should be located at the middle and bottom of the beam in the hogging and sagging zone, respectively, to empirically account for the higher potential for damage associated with the hogging deformations. This equation is adopted by Burland and Wroth (1975) to relate the deflection ratio to the maximum bending strain as follow:
Eq. 2.14 ∆ 𝐿= [0.083 𝐿 𝐻+ 1.3 𝐻 𝐿] 𝜀 𝑏𝑚𝑎𝑥
In a similar way, the deflection ratio can be related to the maximum shear strain: Eq. 2.15 ∆
𝐿= [0.064 𝐿2
𝐻2+ 1] 𝜀 𝑑𝑚𝑎𝑥
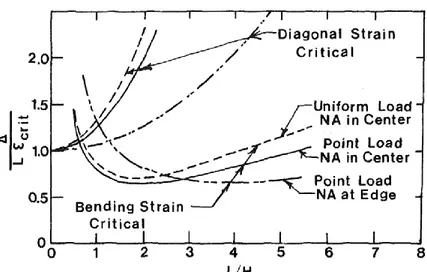
These relations are plotted in Figure 2.12 based on Eq. 2.14 and Eq. 2.15 for structures with different 𝐿 𝐻⁄ ratios. Plots of Eq. 2.14 and Eq. 2.16 are shown in Figure 2.12, where the maximum tensile strains, either bending or diagonal tension, are related to the critical tensile
22 strains These graphs show that when 𝐿 𝐻⁄ ratios are less than one, the first damage will be in the form of diagonal tension cracking.
Figure 2.12. Variation of the inflection ratio with the dimensions of the equivalent beam
(Boscardin and Cording, 1989).
Boscardin and Cording (1989) proposed that the critical tensile strain, 𝜀 𝑐𝑟𝑖𝑡, can be computed
to account also for the horizontal strain:
Eq. 2.16 𝜀 𝑐𝑟𝑖𝑡 = 𝜀 𝑏𝑚𝑎𝑥+ 𝜀 ℎ
For the case of diagonal tension with horizontal extension, the maximum tensile strain, 𝜀 𝜃𝑚𝑎𝑥, can be written as:
Eq. 2.17 𝜀 𝑐𝑟𝑖𝑡 = 𝜀 𝜃𝑚𝑎𝑥 = 𝜀 ℎ𝑐𝑜𝑠2𝜃
𝑚𝑎𝑥 + 2𝜀 𝑑𝑚𝑎𝑥cos 𝜃𝑚𝑎𝑥sin 𝜃𝑚𝑎𝑥
To identify the start of serviceability loss, Burland (1977) firstly used the concept of “limiting tensile strain”, 𝜀 𝑙𝑖𝑚.
Alternatively to the deflection ratio, the angular distortion, 𝛽, is the other parameter to evaluate the response of the system. For a simply supported beam with a central point load the maximum change in the slope along the beam (the slope at the support) can be estimated from:
Eq. 2.18 𝛽 = 3∆ 𝐿 [ 1+4(𝐸𝐺)(𝐻2 𝐿2) 1+6(𝐸 𝐺)( 𝐻2 𝐿2) ]
Son and Cording (2005) investigated several cases of physical model tests, numerical and field observations to investigate the ratios between the angular distortions, 𝛽, and the deflection ratio, ∆
𝐿. In summary, they found that the ratio is in the rage 2-4. For elastic conditions (including
23 the ratio is around 4. The low ratio of 2 indicates that the distortion in a structure is less than the change in differential ground slope (Δ𝐺𝑆) that would occur in the absence of structure, and the high ratio of 4 has the distortion in a structure being close to differential ground slope (Δ𝐺𝑆) in ground slope (Son and Cording, 2005).
Mair et al. (1996) introduced a two-stage approach to estimate the structural deformations. In the first, conservative, stage, greenfield movements are imposed to the building. In the second phase, if the results of previous phase indicate a not acceptable risk level, soil-structure interaction analyses are performed.
2.3.3 Deformation parameters in framed structures
The equivalent beam method has proven itself over the years to be very reliable for estimating the damage induced on masonry buildings. However, the concepts previously exposed must be revised if the superstructure has a frame configuration.
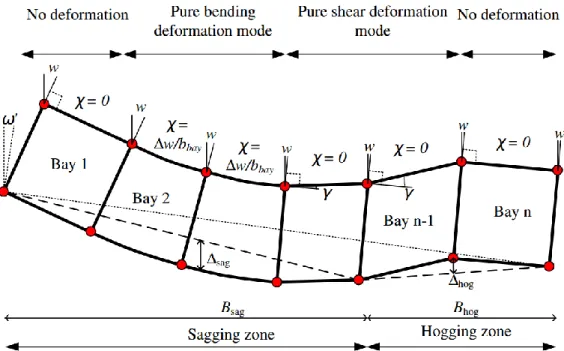
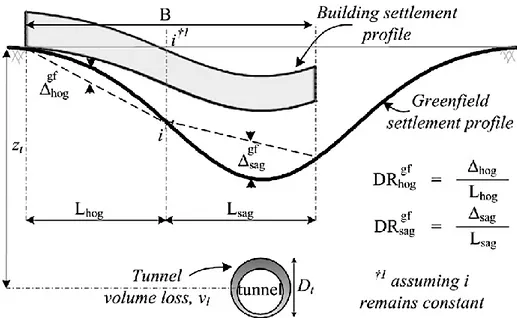
For a more effective evaluation of building deformations and damages in framed structures, the building is divided into several spans (or units) with equal size, which are composed of beams (or pillars) and wall panels. Cook (1994) mentions that each structure can have one or more floors and be composed of several spans. For better understanding the type of movements in each part of the building, Figure 2.14 shows the deformation parameters used to describe the response of the frame to the movements induced by the tunnelling. The deformation parameters for framed buildings are developed and studied in more detail (Xu et al., 2020):
- The sagging and hogging deflection ratios 𝐷𝑅𝑠𝑎𝑔/ℎ𝑜𝑔 could be computed from the maximum deflections ∆𝑠𝑎𝑔/ℎ𝑜𝑔 and lengths of the sagging/hogging zones 𝐵𝑠𝑎𝑔/ℎ𝑜𝑔. In this case, the sagging profile is divided into sagging (compression deformations) and hogging (extension deformations) zones (Burland, 1977; Mair et al., 1996).
- The angular distortion 𝛽 of each bay is the rotation of the straight line concerning two points relative to their local tilt (Boscardin and Cording, 1989).
- The longitudinal strain, 𝜀 𝑥𝑥, is related to axial and bending stresses. This parameter is negligible in frames with continuous foundations because of the axial slabs and foundation stiffness.
- The diagonal deformation, 𝜀 𝑥𝑧, generated by shear stresses and normally related to the shear deformations 𝛾 of each span (Figure 2.13).
24 The diagonal deformations, 𝜀 𝑥𝑧, are instead determined starting from the shear deformation recorded on each single span:
Eq. 2.19 𝜀 𝑥𝑧 = γ
2
where precisely 𝛾 is the shear deformation angle (Figure 2.13), approximately equal to the angular distortion 𝛽 (Ritter et al., 2020).
Figure 2.13. Distortions of a building due to settlements and illustration of deformation
parameters (Xu et al., 2020).
25 The maximum tensile strains can be determined using Eq. 2.20 and Eq. 2.21(Mair et al., 1996), based on a Mohr’s circle of strain for a plane-stress or plane-strain condition, respectively, where 𝜀 𝑥𝑥 is longitudinal strain due to axial and bending deformations associated with curvature χ, 𝜀 𝑥𝑧 is diagonal strain due to shear deformations associated with shear strain γ, and ν is Poisson’s ratio. Eq. 2.20 𝜀 𝑚𝑎𝑥 = 𝜀 𝑥𝑥 (1−𝜈) 2 + √ 1 4𝜀𝑥𝑥 2 (1 + 𝜈)2+ 𝜀 𝑥𝑧2 Eq. 2.21 𝜀 𝑚𝑎𝑥 = 𝜀 𝑥𝑥 2 + √ 1 4𝜀𝑥𝑥 2 + 𝜀 𝑥𝑧2
Boone (1996) evaluated damage in terms of cumulative crack width determined from strains. Son and Cording (2005) assimilate the building to a set of units or portions (Figure 2.14(c)), avoiding the dependence of the parameters 𝛽 and 𝜀 ℎ on the geometric characteristics of the
structure. A direct and effective approach is therefore defined to determine the response of each substructure by simply measuring the displacements at the four vertices of each span (A, B, C and D in Figure 2.14(c)), namely the bay analysis adopted in this thesis.
Son and Cording (2005) summarized the generalized damage criterion referring to a vertex of a single unit (Figure 2.15). The criterion is based on the concept that a structure is deformed by the combination of angular distortion, lateral strain, and the maximum strain on the structure. Son and Cording (2005) subdivided a building adjacent to a deep excavation into bays based on the location of intermediate walls, building columns, different structural properties (e.g., geometry or stiffness) or gradient of ground displacements.
The angular distortion and lateral strain for building damage estimate can be determined by measuring vertical and horizontal displacements at the corners, A, B, C, and D of a building unit (Figure 2.14(c)). This criterion has the following steps:
1- a structure is deformed by the combined action of 𝛽 and 𝜀 ℎ.
2- 𝛽 and 𝜀 ℎ are determined by considering the vertical and horizontal displacements of the edges of a building unit.
3- the maximum principal deformation 𝜀 𝑚𝑎𝑥 of the structure is obtained by a combination of 𝛽 and 𝜀 ℎ.
26
Figure 2.15. State of strain at point or average state of strain in distorting portion of
structure (Son and Cording, 2005).
The combination of angular distortion and lateral strain at a point or in a building unit results in a maximum principal tensile strain is:
Eq. 2.22 𝜀 𝑚𝑎𝑥 = 𝜀 𝑝 = 𝜀 𝐿𝑐𝑜𝑠2𝜃𝑚𝑎𝑥 + β cos 𝜃𝑚𝑎𝑥sin 𝜃𝑚𝑎𝑥 in which:
Eq. 2.23 tan(2𝜃𝑚𝑎𝑥) = β
𝜀 𝐿
where 𝜃𝑚𝑎𝑥 is the direction of crack formation and the angle of the plane on which 𝜀 𝑝 acts, measured from vertical plane.
It should be noted that when 𝛽 = 0, 𝜀 𝑚𝑎𝑥 = 𝜀 ℎ acts on the vertical plane and therefore 𝜃𝑚𝑎𝑥 = 0°. From the other point of view, if 𝜀 ℎ = 0, 𝜀 𝑚𝑎𝑥 =
1
2𝛽 acts on the plane at 𝜃𝑚𝑎𝑥 =
45° and a crack forms at 𝜃𝑚𝑎𝑥 = −45°. These possible values indicate 0° < 𝜃𝑚𝑎𝑥 < 45°.
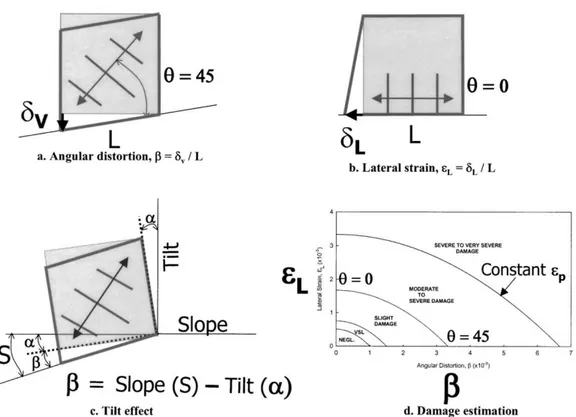
Typically, the angular distortion and lateral strains are determined for the section of bay in the first third to one half of the base length where the damage was concentrated. The angular distortion (𝛽) is the shearing distortion of the bay and defined as (Son and Cording, 2005):
27 Eq. 2.24 𝛽 = 𝑆𝑙𝑜𝑝𝑒 − 𝑇𝑖𝑙𝑡
This formula considers the scheme in Figure 2.14(c) and it is equal to: Eq. 2.25 𝛽 = 𝑆 − 𝛼 =𝑈𝑧,𝐷−𝑈𝑧,𝐶
𝑏𝑏𝑎𝑦 −
𝑈𝑥,𝐴−𝑈𝑥,𝐶
2ℎ𝑠𝑡𝑜𝑟𝑒𝑦
where 𝑈𝑖,𝑗 represents the horizontal and vertical displacements of the corners in which 𝑖 = 𝑥; 𝑧 is the displacement direction, and 𝑗 = 𝐴; 𝐵: 𝐶; 𝐷 is the location of the bay corner. Indeed, C and D are the two lower corners of the base where as A and B are the upper corners. The other parameters are the lateral strain at the top and base of each bay proposed by Son and Cording (2005). The lateral strain at top, 𝜀 𝐿𝑎𝑡(𝑇), is the change of lateral displacement at the top over the length L of the bay. Similarly, the lateral strain at base, 𝜀 𝐿𝑎𝑡(𝐹), is possible to be found. These formulas are:
Eq. 2.26 𝜀 𝐿𝑎𝑡(𝑇) =𝑈𝑥,𝐴−𝑈𝑥,𝐵
𝐿
Eq. 2.27 𝜀 𝐿𝑎𝑡(𝐹) = 𝑈𝑥,𝐶−𝑈𝑥,𝐷
𝐿
Cook (1994) suggests to use top and bottom corner displacement of each bay to isolate tilt, bending displacements, and shear displacements and to estimate the average bay curvature and shear strain from bay corner displacements. Ritter et al. (2020) proposes an analytical procedure to estimate the shear strain or average shear distortion, γ, of a building unit or bay: Eq. 2.28 γ =𝑈𝑧,𝐷−𝑈𝑧,𝐶
𝑏𝑏𝑎𝑦 −
3𝑈𝑥,𝐴−3𝑈𝑥,𝐶−(𝑈𝑥,𝐵−𝑈𝑥,𝐷)
4ℎ𝑠𝑡𝑜𝑟𝑒𝑦
To distinguish between bending and shear displacements (and strains), the framework outlined by Cook (1994) is used (the sign convention and tilt and bending deformations are shown in Figure 2.16). The settlement due to tilt is computed as:
Eq. 2.29 𝑆 𝑣,𝑡𝑖𝑙𝑡 = 𝜔2 𝐿𝑢
Also, the bending-related settlement is derived as: Eq. 2.30 𝑆 𝑣,𝑏𝑒𝑛𝑑 = 𝜒𝐿2𝑢
2 = ∆𝜔 𝐿𝑢
2
28
Figure 2.16. Framework to investigate building response after Cook (1994): (a) sign
convention and reference condition for bay; (b) tilt and bending deformations; and (c) different contributions of shear, tilt and bending deformations.
2.3.4 Damage prediction with equivalent beam approach
To characterize the effects of building stiffness on the soil-structure interaction, Potts and Addenbrooke (1997) conducted a parametric finite element analysis to investigate the response of buildings to tunnelling. Two parameters were defined to account for the modification to the settlement and the axial response of buildings; they are the relative bending stiffness; 𝜌∗; and
the relative axial stiffness; 𝛼∗. 𝜌∗ and 𝛼∗ were later modified by Franzius et al. (2006), the former to be dimensionless. The relative bending stiffness and the relative axial stiffness formula, defined by Franzius et al. (2006), are:
Eq. 2.31 ρ𝑚𝑜𝑑∗ = 𝐸𝐼
𝐸𝑠𝐵2𝑧0𝐿
Eq. 2.32 𝛼𝑚𝑜𝑑∗ = 𝐸𝐴
𝐸𝑠𝐵𝐿
where 𝐸𝐼 and 𝐸𝐴 are the bending stiffness and the axial stiffness of the structure, respectively. 𝐸𝑠 is the secant stiffness of the soil at an axial strain of 0.01% and at a depth of 𝑧 = 𝑧0⁄ . 𝐵 is 2 the building width and 𝐿 is the length of the building in the longitudinal direction of the tunnel. The dimensions are illustrated in Figure 2.17.
29
Figure 2.17. Influence of soil-structure interaction on settlement distortions (Farrell et al.,
2014).
In the next years, Mair (2013) proposed the relative bending stiffness factors 𝜌𝑠𝑎𝑔 ℎ𝑜𝑔⁄ as:
Eq. 2.33 𝜌𝑠𝑎𝑔 ℎ𝑜𝑔⁄ =
𝐸𝐼 𝐸𝑠𝐵𝑠𝑎𝑔 ℎ𝑜𝑔,𝑔𝑓3 ⁄ 𝐿
= 𝐸𝐼∗
𝐸𝑠𝐵𝑠𝑎𝑔 ℎ𝑜𝑔,𝑔𝑓3 ⁄
where 𝐸𝐼∗ is 𝐸𝐼 per running meter of the building. 𝐵𝑠𝑎𝑔 ℎ𝑜𝑔,𝑔𝑓⁄ is the length of building in the
sagging/hogging zones defined by the greenfield settlement inflection point. In this equation, 𝐸𝐼∗ is used to indicate the total building stiffness (e.g. Goh and Mair (2014)) without distinguishing between bending and shear contributions.
Settlement distortions to building are typically measured in both hogging and sagging modes of determination using the deflection ratio ( ∆ 𝐿⁄ or 𝐷𝑅, defined in Figure 2.17). The hogging and sagging regions are partitioned by the point of inflexion (i) of the settlement trough, assuming that each building responds fully flexibly. Potts and Addenbrooke (1997) introduced the deflection ratio modification factors 𝑀𝐷𝑅,𝑠𝑎𝑔 and 𝑀𝐷𝑅,ℎ𝑜𝑔, defined as:
Eq. 2.34 𝑀𝐷𝑅,𝑠𝑎𝑔 ℎ𝑜𝑔⁄ = 𝐷𝑅𝑠𝑎𝑔 ℎ𝑜𝑔⁄ ,𝑏𝑙𝑑
𝐷𝑅𝑠𝑎𝑔 ℎ𝑜𝑔⁄ ,𝑔𝑓
where 𝐷𝑅𝑠𝑎𝑔 ℎ𝑜𝑔⁄ ,𝑏𝑙𝑑 and 𝐷𝑅𝑠𝑎𝑔 ℎ𝑜𝑔⁄ ,𝑔𝑓 are, respectively, the deflection ratios of the building
settlement profile and the greenfield settlement trough.
Modification factors to the greenfield settlement distortions are highly dependent on ρ𝑚𝑜𝑑∗ . Similarly, the modification to tensile and compressive horizontal strains, in the hogging and sagging regions, respectively, are highly dependent on 𝛼𝑚𝑜𝑑∗ (Franzius et al., 2006).
30
2.3.5 Response of infills
Masonry buildings and frames with masonry infills suffer different damages due to the horizontal and vertical movements of ground surface. Cracking on infill walls occur due to the deformation of surrounding beams and columns that leads to create tensile strain inside the infills. The deformation in framed buildings is expected to primarily result from differential vertical movement of columns due to the higher tensile strength of framed buildings. Since columns may be in sagging and hogging zones, tilt of the building must also be considered separately and subtracted from the deformation due to differential column settlement. Boone (1996) assumed the tilt equal to the slope of the chord between endpoints of symmetric ground movement profile segments. Figure 2.18 shows the deflected shape of a fixed end beam frame and a simple beam frame. The deflected shape of fixed end beams will resemble an elongated
S with an inflection point at the midspan. In this case, the shear strain is ∆S 𝐿⁄ ; however, the maximum curvature will be on half of beam length. Therefore, in completing analyses of fixed end beams using the above methods, calculation of the 𝐿 𝐻⁄ ration, radius of curvature, and central deflection must be based on 0.5𝐿.
Figure 2.18. Geometry of beams and infill/panel walls: (a) Fixed end beam frame; (b)
Simple beam frame (Boone, 1996).
Figure 2.18(a) shows the infill walls bound by fixed-end beams and columns that in this type of deformation it is reasonable to expect that the deformed shape could be approximated as shown in Figure 2.18(a). Since end rotation is restricted and the wall is forced to conform to the beam’s deformed shape, the wall itself have greater deformation between the wall quarter points with a maximum shear at the wall midspan equal to 2∆S 𝐿⁄ (excluding tilt). The expected
31 deformed shape for infill walls supported by simple beams and columns is shown in Figure 2.18(b). In both cases shear is likely be the predominant mode of strain deformation.
Cracks in buildings usually have diagonal patterns for different cases subjected to ground movements and these types of cracks refer to shear cracking.
Cracking of structures deforming principally in shear will likely follow irregular patterns through masonry, mortar joints, and/or other discontinuities along the principle stress trajectories. Although 𝜀 𝑝could be used to approximate the potential crack width and severity, the length over which the strain will occur is difficult to define in simple terms and depends on many factors including height, length, openings, and load-bearing walls and infill walls supported by fixed-end beams may be applied to an equivalent diagonal length based on the building element height and length approximated by:
Eq. 2.35 𝑙 𝑑 = √(𝑙 2⁄ )2+ 𝐻2
and for infill walls supported by simple beams
Eq. 2.36 𝑙 𝑑 = √𝑙2+ 𝐻2
Recent studies in the last few decades investigated the response of infilled frames both in terms of their global and local behaviour. In the first elastic phase, by increasing the loads due to the ground movements, the first cracks in the infills lead to separation from the frame, and a compression strut mechanism occurs. Figure 2.19 shows four mechanisms were identified in the masonry infilled frames, depending on the mechanical properties of masonry and on the relative panel-to-frame stiffness. The main failure modes, which were introduced by Blasi et al. (2018), consist of: (1) mid-height cracking, (2) diagonal cracking, (3) horizontal slip and (4) corner crushing.
32
Figure 2.19. Failure mechanisms of infills (a) mid-height sliding, (b) diagonal cracking, (c)
bed joint cracking, and (d) corner crushing (Blasi et al., 2018)
2.4
Risk assessment
Protection of adjacent or overlying structures occupies a major part of the cost, schedule, and third-party impacts of an urban underground construction. Risk assessment is the most important work of engineers to do during the analysis and evaluation of damages for the design of structures which are exposed to the shallow tunnelling. Methods used to limit damage or mitigate their effects include limiting movements at the excavation source with controlled construction measures, improve ground characteristics or using compensation methods to replace ground loss, underpinning reinforcing, repairing, or replacing structures. Predicting and then monitoring building performance is a key aspect in planning, design, and implementation of such measures.
Son and Cording (2005) developed a procedure to estimate the building damage induced by ground movements (Figure 2.20). The procedure starts from a conservative screening that eliminates from further study buildings that do not fall within a significant damage category using even the conservative estimate. This procedure allows a number of buildings in urban areas to be investigated in a limited time.
33
Figure 2.20. Procedure for building damage estimate to excavation-induced ground
movement (Son and Cording, 2005).
2.4.1 Damage classification
Classification of building damage has been traditionally divided into three categories such as architectural damage, functional damage, and structural damage. Architectural damage affects the appearance of structures and is related to cracks or separations in panel walls and doors. Functional damage affects the use of the structure, and is exemplified by jammed doors and windows, extensively cracked and falling plaster, tilting of walls and floors, and other damage that would require non-structural repair to return the building to its full-service capacity. Structural damage affects the stability of the structure, usually related to cracks or distortions in primary support elements such as beams, columns and load bearing walls (Boscardin and Cording, 1989).
34 There are several levels in evaluating the effect of ground movements on building performance (Boscardin and Cording, 1989). An initial screening determines the potential affected structures along the project alignment by considering the width, maximum settlement, and ground slope of the free-field trough. Table 2-1 summarises different categories of risk based on the maximum slope and settlement of building (Rankin, 1988; Boscardin and Cording, 1989).
Table 2-1. Typical values of maximum building slope and settlement for damage risk
assessment [after Rankin (1988) and Son and Cording (2005)].
Risk category Maximum slopes of building
Maximum settlement
of building (mm) Description of risk
1 Less than 1/500 Less than 10 Negligible: superficial damage unlikely
2 1/500-1/200 10-50
Slight: possible superficial damage which is unlikely to have structural
significance
3 1/200-1/50 50-75
Moderate: expected superficial damage and possible structural damage to buildings, possible damage to relatively
rigid pipelines
4 Greater than 1/50 Greater than 75
High: expected structural damage to buildings. Expected damage to rigid pipelines, possible damage to other
pipelines
Burland (1997) presented a table of damage category according to crack width (see Table 2-2). The adopted classification provides five categories, ranging from negligible (category 0) to severe damage (category 5). These categories were correlated to a range of limiting tensile strains by Boscardin and Cording (1989). Mair et al. (1996) stressed the importance of the transition from category 2 to category 3, with the latter category often associated with relevant tunnelling-induced damage.
If the predicted degree of damage falls into the first three categories from 0 to 2, the risk is considered low. At these degrees of damage, the structural integrity is assured, and the damage can be easily and economically fixed. A major objective of designers is to maintain the level of risk below the category 3, as this is considered safe threshold for all buildings.
35
Table 2-2. Damage classification system proposed by Burland (1997) and Boscardin and Cording
(1989). Category of
damage
Damage class
Description of typical damage and ease of repair Approx. crack width (mm) Limit. tensile strain levels Aesthetic damage
Negligible Hairline cracks of less than about 0.1
mm width. up to 0.1 mm 0 -0.05
Very slight
Fine cracks which can easily be treated during normal decoration. Perhaps isolated slight fracturing in building. Cracks in external brickwork
visible on close inspection.
up to 1 mm 0.05 –0.075
Slight
Cracks easily filled. Redecoration probably required. Several slight fractures showing inside of building. Cracks are visible externally and some
repainting may be required externally to ensure water tightness. Doors and
windows may stick slightly.
up to 5 mm 0.075– 0.15 Functional damage, affecting serviceability Moderate
The cracks require some opening up and can be patched by a mason. Recurrent cracks can be masked by suitable linings. Repainting of external
brickwork and possibly a small amount of brickwork to be replaced. Doors and windows sticking. Service pipes may fracture. Weather-tightness
often impaired. 5 to 15 mm or a number of cracks > 3 mm 0.15 –0.3 Severe
Extensive repair work involving breaking out and replacing sections of
walls, especially over doors and windows. Windows and door frames
15 to 25 mm, but also depends on
36 distorted, floors sloping noticeably.
Walls leaning or bulging noticeably, some loss of bearing in beams. Service
pipes disrupted. number of cracks Structural damage, affecting stability Very severe
This requires a major repair involving partial or complete rebuilding. Beams loose bearing, walls lean badly and require shoring. Windows broken with
distortion. Danger of instability.
usually > 25 mm, but depends on number of cracks > 0.3
37
Chapter. 3. Geotechnical modelling in centrifuge tests
Nowadays, physical modelling is an increasingly used approach in the engineering field, which includes a set of methodologies to study the real behaviour of soil and structures by using prototypes and small models. In tackling some complex geotechnical problems, centrifuge modelling is often considered as a preferred experimental method.
Geotechnical centrifuge modelling is a technique for testing physical scale models of geotechnical engineering systems. A geotechnical centrifuge is used to conduct model tests to study geotechnical problems such as the bearing capacity of foundations for bridges and buildings, settlement of embankments, stability of slopes, earth retaining structures, the effect of tunnelling/excavation on adjacent existing underground structures (mechanized or traditional excavation) and the dynamic problems (earthquakes).
This section briefly introduces the use of centrifuge modelling for geotechnical, and more specifically soil-structure interaction, problems. A brief introduction on the theoretical and practical aspects of geotechnical centrifuge modelling is given followed by a description of the experimental set-ups and investigative techniques implemented today at the University of Nottingham, where experimental results for tunnel-frame interaction were obtained.
3.1
Geotechnical centrifuge
The mechanical principle at the base of centrifuge modelling is simple; if a body of mass 𝑚 is rotating at constant radius 𝑟 about an axis with steady speed 𝜈 (Figure 3.1), in order to keep it in that circular orbit, a constant radial centripetal acceleration 𝜈2⁄ or 𝑟𝜔𝑟 2 (where 𝜔 is the
swept angular velocity) develops. To produce this acceleration, the body should experience a radial force 𝑚𝑟𝜔2 directed towards the axis. The centripetal acceleration can be normalized with earth’s gravity 𝑔 and the body is being subjected to an acceleration of 𝑛𝑔 where 𝑛 = 𝑟𝜔2⁄ . 𝑔
38
Figure 3.1. Object moving in steady circular orbit (Wood, 2003).
If the equilibrium of an element of unit cross-sectional area and of thickness 𝛿𝑧 taken from a column of soil at the surface of the earth were considered (Figure 3.2(a)), the increase in stress through the element should balance the weight of the element (which itself comes from the gravitational acceleration) in order to prevent any acceleration of the element:
Eq. 3.1 𝛿𝜎𝜈 = 𝜌𝑔𝛿𝑧
and, considering a constant density, at a depth z below the free surface Eq. 3.2 𝜎𝜈 = ∫ 𝜌𝑔𝑑𝑧
𝑧
0 = 𝜌𝑔𝑧
In the centrifuge, if the equilibrium of an element of unit cross-sectional area and of thickness 𝛿𝑧 were considered (Figure 3.2(b)), the stress increase should provide the force necessary to generate the centripetal acceleration. The equation of motion becomes:
Eq. 3.3 𝛿𝜎𝜈 = 𝜌𝑛𝑔𝛿𝑧
and at depth 𝑧 𝑛⁄ below the free surface (again, assuming a constant density) Eq. 3.4 𝜎𝜈 = ∫ 𝑛𝜌𝑔𝑑𝑧
𝑧 𝑛⁄
0 = 𝜌𝑔𝑧
39 In the centrifuge tests, a model with geometry of 𝑁 times smaller than the prototype is constructed and is tested under centrifugal acceleration field with a magnitude of 𝑁 times the Earth’s gravity (Schofield, 1980). A 1/𝑁-scale model located at a distance, 𝑟, from the axis of a centrifuge (Figure 3.3) is rotated at a rotational speed, Ω = √𝑁/𝑟 , which is sufficient to raise the acceleration field at the location of the model to 𝑁 times the acceleration of gravity. In principle, the stress conditions at any point in the model should then be identical to those at the corresponding point in the full-scale prototype. The overall behaviour (e.g., displacements, failure mechanisms, etc.) should also be identical. The gravitational acceleration at the top of the model is lower than that at the bottom of the model due to the fact that the gravitational field increases with radial distance.
Figure 3.3. Cross section through a geotechnical centrifuge (Kramer, 1996).
Similitude considerations play an important role in the planning and interpretation of centrifuge tests. Table 3-1 shows the scaling factors for a number of parameters. The scaling factors show how dynamic events are speed up in the centrifuge. For example, the stresses and strains in a 30-m -high prototype earth dam could be modelled with a 30-cm -high centrifuge model accelerated to 100g.
Obviously, high-speed transducers and data acquisition systems are required to obtain useful results in dynamic centrifuge tests. Since the scaling laws apply to all parts of the model, miniaturized transducers and cables are required to minimize their influence on the response of the model.
Table 3-1. Scaling factors for centrifuge modelling (Kramer, 1996). Type of event Quantity Model Dimension
40 Prototype Dimension All events Stress Strain Length Mass Density Force Gravity 1 1 1/N 1/N3 1 1/N2 N Diffusion events Time Strain rate 1/N2 N2
3.2
Modelling of tunnelling
In geotechnical engineering, the understanding of the behaviour of soils and their interactions with structures induced by tunnelling is often achieved with the use of experimental testing and measurements obtained by monitoring and field data.
In tunnelling, the diameter 𝐷 of the tunnel is typically small in comparison with its depth 𝐶 from the ground surface; as such gravitational variation of stress in the soil from crown to invert of the tunnel is not great. Figure 3.4 shows a scheme of the classic centrifuge test performed by Mair (1978). Tunnel excavation was modelled by progressively reducing the pressure in a fluid-filled bag as shown in Figure 3.4. The three-dimensional problem of collapse of a partially unsupported tunnel heading was modelled using a half-cylindrical tunnel with fluid pressure supporting the tunnel face and a length 𝑃 of unlined cross surfaces. Tunnel heading collapse can be analysed for the two extremes of fully lined and fully unlined tunnels.
41
Figure 3.4. Three-dimensional model of partially lined tunnel heading (Mair, 1978).
The fluid pressure is a very approximate replacement of the actual anisotropic in-situ stress state. To have a more realistic modelling of the soil removal and lining installation in centrifuge tests, robotic techniques are now available (Wood, 2003).
3.2.1 Instrumentation
In full-scale geotechnical systems, there are some important quantities, such as pore pressures, contact stresses, displacements, and structural responses, that should be measured during the analyses.
Pore pressures are usually measured by Druck transducers composed of a silicon diaphragm as a differential pressure-sensitive element. Contact stresses, measured by contact stress transducers, are difficult to be estimated reliably at any scale. The differentiation of experimental observations always introduces errors. The use of tactile pressure sensitive mats is described by Springman et al. (2002). These can measure local stresses over a grid of 1936 contact points over an area 56 × 56mm. The sensitivity of this measuring device is not particularly good, and the calibration is not straightforward, but this is a promising emerging technology. Displacements can be measured by LVDTs (linear variable differential transformers) at discrete points of the model. Additionally, non-contact lasers can be used to monitor displacements across surface profiles. These devices are appropriate and practical for recording displacement patterns rather steady state conditions. Figure 3.5 shows the use of several overhead-fixed cameras mounted above the surface of the model to capture and record the actual movement of the ground surface.
42
Figure 3.5. Close-range photogrammetry for recording three-dimensional surface
displacements (Taylor et al., 1998).
3.3
Experimental case study: centrifuge tests at the University of
Nottingham
This section briefly introduces the instruments and techniques for modelling of soil-structure interaction problems in centrifuge tests at University of Nottingham.
3.3.1 Geotechnical centrifuge
The beam centrifuge at University of Nottingham, manufactured by Thomas Broadbent & Sons Ltd, is shown in Figure 3.6. This centrifuge has 2m radius with one swinging cradle and 50g-tonne capability. The centrifuge can operate at 100-g with a payload of 500kg and up to 150-g at a reduced payload of 330kg. The centrifuge package components for the study of tunnelling include the centrifuge strong box, the soil, the model tunnel, and the tunnel volume control system. These components are described in the following sections.
43
Figure 3.6. Main components of the University of Nottingham geotechnical centrifuge
(Ellis et al., 2006).
3.3.1.1 Centrifuge strong box
The centrifuge strong box was designed such that measurements of soil and structure deformations are made using image-based analysis techniques at the plane of symmetry provided by the Perspex wall. The main components of the strong box are a stainless U-channel, a Perspex front wall and a Back-aluminium wall which was shown in Figure 3.7(a) and schematically for the cross-section in Figure 3.7(b). To avoid leakage, the stainless-steel U-channel was bolted to the Perspex window and the aluminium back wall. The plain dimensions at the strong box are 640 × 260mm and the maximum height of soil within the box is 500mm. The thickness of the front wall was made of 100mm thick Perspex to estimate the ground movements from a series of pictures taken during the test. The internal face of Perspex sheet is curved with a circular hole of 20mm depth. It is important to report that the friction at the soil-Perspex interface reduces ground movement magnitude by 10%-15% without significant impact on the displacement distribution (i.e. the shape of the deformation pattern) (Marshall, 2009).
44
Figure 3.7. The strong box (a) model tunnel; (b) cross-section through model (Franza,
2017).
3.3.1.2 Soil
In the investigated experiments, the box was filled with dry Leighton Buzzard Fraction E silica sand supplied by David Ball Group plc. This sand has a typical average diameter 𝑑50 = 0.122mm , a specific gravity 𝐺𝑠 = 2.65 and has the minimum and maximum void ratio, 𝑒𝑚𝑖𝑛 = 0.613 and 𝑒𝑚𝑎𝑥 = 1.014, respectively (Corresponding to relative densities vary
between 0.3 and 0.9, see Table 3-2).
Table 3-2. The relative density and the density of soil (Franza, 2017).
Id (%) ρs (kg/m3)
30 1399
50 1461
70 1529
45
3.3.1.3 Tunnel model
The tunnel model consists of an outside diameter of 90mm (Figure 3.8). The entire tunnel model is sealed within a latex membrane of 1mm thickness. This part is filled with water to achieve the tunnel volume loss by extracting fluid from the annulus using the volume control system, described in section 3.3.1.4.
Figure 3.8. The model tunnel 𝟗𝟎𝐦𝐦 diameter and its fitting rings (Franza, 2017). Despite the different inner shape, the tunnel model uses the water extraction technique for simulation of the tunnel volume loss. In this type of simulation, the movement of the soil depends on the balance that is established between the water and sand, because the tunnel membranes are fully-flexible and the structural lining is not modelled. Extraction of fluid from the tunnel is achieved via a small hole through one of the ends of the tunnel model using a remotely-controlled actuator. The deformation is constant along all the longitudinal direction and, as such, the face advancement cannot be simulated.
The tunnel model consists in a hollow inner cylinder with enlarged ends covered by a latex sleeve sealed with O-rings, grease and end plates. The inner cylinder was designed with a downward eccentric shape to reproduce the typical oval-shaped distribution of ground loss (Figure 3.9(f)).
The diameter of 68mm for inner cylinder provides more than 20% potential volume loss. During the test phases, the water, which is initially at high pressures, is gradually extracted from the system for controlling the volume loss. The maximum hydraulic pressure induced in-flight in the model tunnel was about 350kPa. All components of the tunnel model and the strong box (excluding the latex sleeve) are shown in Figure 3.9. These components are made of
46 aluminium. The latex membrane at the edges of the enlarged ends may provide a stiffening effect, which could affect the plane-strain condition at the Perspex. To minimize this disturbance, the enlarged ends of the tunnel cylinder were set slightly inside the recess of the Perspex and the back wall (Figure 3.9(a) and (b)).
Figure 3.9. The model tunnel components and fitting rings (Franza, 2017).
3.3.1.4 Tunnel volume control system
Figure 3.10 shows the volume loss control system. This system has the possibility to simulate the excavation of the tunnel based on the volume losses by gradually extracting the pressurized water from the latex membrane. This mechanism is composed of the following main parts:
- constant-head standpipe - pore pressure transducer (PPT) - solenoid valve
- hydraulic cylinder with attached Linear Variable Differential Transducer (LVDT) - actuator and pipework connecting the system to the tunnel