Politecnico di Milano Scuola di Ingegneria dell’Informazione
Polo territoriale di Como Master of Science in Computer Engineering
Bridge 2.0: a Framework for Elderly
Independence and Ambient Assisted
Living
Supervisor: Prof. Sara Comai
Assistant Supervisor: Eng. Stefano Gorla
Master Graduation Thesis by: Amedeo Stroppolo Student Id. number: 876550
To infinity... and beyond!
Sommario
La continua crescita dell’et`a media globale ha portato i ricercatori ad investigare nuovi metodi e strumenti per permettere alle persone anziane di vivere in sicurezza ed in autonomia nelle proprie case. Il continuo sviluppo delle Smart Homes, unito allo sviluppo di tecnologie sempre pi`u avanzate basate su scienze quali Pervasive System o Internet of Things (IoT), ha permesso la nascita di strumenti per la gestione automatica di elettrodomestici, illuminazione e sicurezza. BRIDGe `e un progetto nato per garantire una forte connessione tra gli anziani che vivono da soli nelle proprie case e tutti coloro che si occupano del loro benessere (e.g. familiari, badanti o medici). L’obiettivo di questa tesi `e quello di sviluppare una nuova versione di BRIDGe che renda intuitiva la gestione dei sensori e degli elettrodomestici intelligenti, ma che mantenga inalterati i punti centrali del progetto: il costo moderato, la modularit`a del sistema e la possibilit`a di personalizzazione del servizio in base alle esigenze degli utenti. Durante lo sviluppo di questo progetto, le fasi pi`u importanti sono state l’analisi dei requisiti e lo studio delle tecnologie gi`a esistenti, seguite dallo sviluppo di una infrastruttura web costituita da una web API per ricevere i dati dalle case e da un base di dati per memorizzarli, l’implementazione di un portale web accessibile che permetta agli utenti di gestire le proprie case e di visualizzare i dati raccolti; lo sviluppo di un servizio di localizzazione a grana grossa che permetta agli utenti autorizzati di monitorare in tempo reale la posizione dell’anziano nella sua casa in modo da intervenire in situazioni anomale.
Abstract
Researchers have been led, by the continuous growth of the average age of the world population, to investigate new methods and tools to allow elderly people to live safely and independently in their homes. The continuous development and evolution of Smart Homes, combined with the emergence of increasingly advanced technologies based on sciences like Pervasive System or Internet of Things (IoT), has enabled the creation of tools for the automatic management of appliances, lighting and security. BRIDGe is a project created to guarantee a strong connection between the elderly, who live alone in their own homes, and all the people who take care of their wellbeing (e.g., family members, carers or doctors). The objective of this thesis is to develop a new version of BRIDGe that realizes an intuitive management of sensors and smart appliances, maintaining intact the main characteristics of the project: the low cost, the possibility of customizing the service on user needs and the modularity of the system, which allows to expand it with new services. During the development of this project, the most important phases were the analysis of requirements and existing technologies, the development of a web API to receive data from the houses and of a database to store them, the implementation of an accessible web portal that allows the users to manage their homes and view data and the development of a course-grain localization service that allows authorized users to monitor the position of the elderly in his house in real time in order to be present in anomalous situations.
Ringraziamenti
Desidero innanzitutto ringraziare la Professoressa Sara Comai, il Professore Fabio Salice, Andrea Masciadri e Stefano Gorla per il supporto, la disponibilit`a e l’aiuto che mi hanno fornito durante il lavoro.
Un ringraziamento particolare alla mia famiglia. A mia madre, che mi ha sempre sostenuto e creduto in me, anche quando non ci credevo pi`u nemmeno io. A mio padre, che ha sacrificato anni della sua vita in fabbrica per permettermi di raggiungere questo obiettivo. Spero di diventare, un giorno, quello che voi siete stati per me. Ai miei fratelli Tiziano e Beatrice, compagni di vita con cui ho trascorso i momenti pi`u belli della mia esistenza, che mi hanno aiutato a superare con leggerezza anche i momenti pi`u difficili.
A tutti i ragazzi che ho conosciuto in questi anni. In particolare a Davide, Stefano e Marco, che mi hanno accompagnato per gran parte di questa avventura, con cui ho condiviso le fatiche ma anche le soddisfazioni di questi cinque anni.
Un ringraziamento anche a Fabrizio, che forse dovrei chiamare Cicio, per tutte le ore di svago e divertimento di questi anni.
A tutti coloro che mi hanno accompagnato in questi anni. Alle mie nonne, agli zii, i cugini e gli amici.
Infine, un ringraziamento a mio nonno Basilio, venuto a mancare tre anni fa, di cui porter`o sempre nel cuore la grande forza di volont`a ed il sostegno, silenzioso e mai ingombrante.
Contents
Sommario v Abstract vii Ringraziamenti ix 1 Introduction 1 1.1 Problem Definition . . . 1 1.2 BRIDGe . . . 2 1.3 Thesis Contribution . . . 2 1.4 Thesis Organization . . . 3 2 Background 5 2.1 Smart Homes . . . 5 2.2 BRIDGe 1.0 . . . 7 2.3 Indoor Localization . . . 9 3 Use-Cases 13 3.1 Actors . . . 13 3.1.1 Customer . . . 13 3.1.2 Elderly Person . . . 14 3.1.3 Family Members . . . 14 3.1.4 Installer . . . 14 3.1.5 Administrator . . . 14 3.2 Roles . . . 14 3.2.1 Owner . . . 15 3.2.2 Installer . . . 153.2.3 Observer . . . 15 3.2.4 Caregiver . . . 16 3.2.5 SuperAdmin . . . 16 3.3 Scenarios . . . 16 4 Database Design 21 4.1 Requirements . . . 21 4.2 Structure . . . 22 4.2.1 ER Diagram . . . 22 4.2.2 Entities . . . 23 4.3 Backup . . . 28
5 System Architecture and Technologies 31 5.1 Project Structure . . . 31 5.2 Technologies . . . 33 5.2.1 CherryPy . . . 33 5.2.2 Django Framework . . . 36 5.2.3 Django ORM . . . 37 5.2.4 Celery . . . 37 5.2.5 Django Pagination . . . 38 6 Localization 41 6.1 Localization Engine: Definition . . . 41
6.2 Localization Engine: Algorithm . . . 42
6.2.1 Parameters . . . 42
6.2.2 Algorithm . . . 48
6.2.3 Multiple Floors Localization . . . 51
6.3 Generalization . . . 51
7 Results 53 7.1 House Layout and Sensor Disposition . . . 53
7.2 Results . . . 55
8 Conclusion & Future Works 61
CONTENTS xiii 9.1 Screenshots . . . 65 9.1.1 Login . . . 67 9.1.2 Registration . . . 67 9.1.3 Owner User . . . 67 9.1.4 Installer User . . . 70 9.1.5 Observer User . . . 74
List of Figures
2.1 Smart Home Example . . . 7
3.1 User Basic Actions . . . 17
3.2 Registered User Basic Actions . . . 17
3.3 Owner Basic Actions . . . 18
3.4 Observer Basic Actions . . . 18
3.5 Installer Basic Actions . . . 19
3.6 Caregiver Basic Actions . . . 20
4.1 Entity Relation Diagram . . . 22
5.1 System Data Flow . . . 32
5.2 System Structure . . . 34
5.3 CherryPy-RDF Response Time Comparison . . . 35
5.4 CherryPy-RDF Number of Faster Responses . . . 35
5.5 MVT Model . . . 36
5.6 ORM Mapping . . . 37
5.7 Celery Architecture . . . 38
6.1 Algorithm Simulation Areas . . . 46
6.2 Localization Algorithm FlowChart . . . 49
7.1 House Floor Plan . . . 54
7.2 House Floor Plan with Sensors and Activation Areas . . . 56
7.3 User Movements in the House . . . 58
9.1 User Login Form . . . 67
9.3 Owner Dashboard . . . 69
9.4 HomeCenter Registration Form . . . 69
9.5 Owner HomeCenter Management . . . 70
9.6 Installer Dashboard . . . 70
9.7 Installer HomeCenter Management . . . 71
9.8 HomeCenter Subareas List . . . 72
9.9 Subarea Definition Form . . . 72
9.10 Sensor Registration Form . . . 73
9.11 Activation Area Definition Form . . . 73
9.12 Installer Battery Status . . . 74
9.13 Observer Dashboard . . . 74
9.14 Sensors Data Visualization . . . 75
9.15 Engines Data Visualization . . . 75
List of Tables
4.1 HomeCenter, Engine Entities . . . 24
4.2 Area, Subarea Entities . . . 25
4.3 Sensor, Activation Area Entities . . . 26
4.4 StreamData, EngineStreamData Entities . . . 27
4.5 DataType, BatteryLevel Entities . . . 27
4.6 HeartBeat Entity . . . 28
4.7 Temperature, Localization Configuration Entities . . . 29
4.8 UserHc, EngineHc Entities . . . 29
6.1 Simulated Alghoritm Parameters . . . 47
6.2 Xweight Results . . . 47
6.3 Yweight Results . . . 48
6.4 Pweight Results . . . 48
7.1 House Sensors Definition . . . 55
7.2 Localization Results on Sensors Simultaneous Activation . . . 56
7.3 Localization Results on User Movements . . . 57
Chapter 1
Introduction
1.1
Problem Definition
The current century is characterized by the continuous increase of the average age of the world’s population. This phenomenon is called “super aging society” or “aging of the elderly population” which means that not only there will be more elderly people, but also that there will be a substantial increase in the number of elderly of an older age. In fact, based on a study of the US census [1], the number of people over age 65 will increase by 101 percent between 2000 and 2030, while the number of family members who can provide support for them will increase by only 25 percent. In Italy, for example, it is estimated that there will be more than one million people over 90 in the year 2024, while, in China, it is estimated that, in 2050, 330 million people will be older than 65, and 100 million will be older than 80, as explained by Marta In´es Berr´ıo Valencia [2]. This phenomenon represents a hard challenge for the world’s social, economic and political resources. In particular, a proper support to the health care system is needed to avoid it collapsing. For this reason, several approaches have been studied and proposed to face the needs of the elderly proactively and to support the already existing health care systems. Ambient Assisted Living (AAL) are systems that allow the elderly to live independently improving their mobility, autonomy and security. These systems manage all the services that can recognize the inhabitants general activities and can inform about emergency situations. In this way, the elderly can be independent and autonomous, knowing, however, that someone that they trust (e.g., family, caregivers) can help them.
1.2
BRIDGe
The Assistive Technology Group (ATG) [3] in Politecnico di Milano worked for several years to develop an AAL system to allow a strong communication between the person that lives independently at home and his social environment, that is the social setting in which the person lives. The social environment is generally represented by the person’s family but it can also include, for example, caregivers or social service organizations. The result of this effort is BRIDGe (Behaviour dRift compensation for autonomous InDependent livinG) [4], a project developed specifically for elderly with physical or cognitive impairments, whose fragility reduces their autonomy. BRIDGe is based on a sensors’ network that supports house controls and user behavior detection thanks to a flexible communication system between the user, the person and the social environment. BRIDGe is designed to satisfy needs of specific users, for this reason it is customizable and offers different services identified by the workgroup through a deep analysis and discussion with both the fragile person and his family. For this reason the system is constantly evolving.
1.3
Thesis Contribution
As explained above, the continuous increase in the average age of the world’s population will represent a hard challenge for the older people assistance. Researchers all over the world are proposing different approaches to support older people allowing them to live independently. BRIDGe represents the ATG [3] response to this phenomenon. My personal contribution with this work is the development of a new BRIDGe version. The new version maintains the core characteristics of the old one: it is based on a sensors’ network and it supports different services based on the user needs, but it manages the interaction with sensors installed in the user’s house at a higher level of abstraction. The system receives data from the sensors and then stores and elaborates them server-side. In this way, the local system installed in the houses is more flexible and needs less maintenance interventions. The project development can be divided in different phases:
• requirements analysis and study of the existing technologies to select the best tools to develop the system;
1.4 Thesis Organization 3
the BRIDGe 2.0 portal;
• development of a database system to store incoming data; • development of a web portal that allows the users to:
– manage their HomeCenters; – view HomeCenters data.
The web portal is designed to be simple and usable, to allow the elderly to manage directly their house or to delegate this task to a trusted person; • development of two user services of the system: the first one is a course-grain
localization service, that shows the position of the user in the house. This is done by the analysis of the signals coming from non intrusive sensors, respecting the privacy of the users and without forcing them to wear bracelets or other wearable devices. The second service measures the average temperature in the house.
1.4
Thesis Organization
Next chapters are organized as follows:
• In Chapter 2, we introduce previous and useful works concerning the topic of this thesis project. We explore the typology and the complexity of the nowadays smart homes and the aspects of the daily life in which they can have an important role. Then, we introduce the BRIDGe project, that is the basis for this work, and, in particular, the indoor human localization.
• In Chapter 3, we describe the different users that can interact with our system and their possible roles in the system.
• In Chapter 4, we describe the requirements for our database and its structure, showing the ER diagram and illustrating all the different entities of the database. • In Chapter 5, we report in detail the structure of BRIDGe 2.0 and all the tools
• In Chapter 6, we define how our localization service works and we describe in detail the algorithm that we use to localize the user in the house.
• In Chapter 7, we propose the results obtained.
• In Chapter 8, we re-analyze the entire work explaining which are its limits and how it could be improved with future features.
Chapter 2
Background
In Chapter 1 we introduced the problem of the continuous increase of the average age of the world’s population. It is our duty to support older or fragile people in their everyday life allowing them to live independently at home preventing, if possible, the development of problems and diseases. In this chapter, we will introduce the Smart Homes and we will focus on how they can help people living independently. The Smart Homes diffusion has led to the creation of a wide number of projects that make use of Smart Homes architecture to support people in all the aspects of their daily life. In particular, we will introduce BRIDGe, a system developed by the Assistive Technology Group of Politecnico di Milano and CRAiS that creates a strong connection between the person that lives independently and his social environment. Then, we will focus on the Indoor Localization, that is an important task in the BRIDGe project.
2.1
Smart Homes
Houses, in the current century, are becoming always more important in people lives. All the daily activities, in fact, can be performed by staying at home, thanks to all the facilities that the modern houses offer.
The term Smart Home refers to an environment equipped with technology that allows monitoring its inhabitants and encourages independence and the maintenance of good health [5]. As Richard Harper states [6], we can define five different levels for categorizing Smart Homes:
• Homes that contain intelligent objects that don’t interact between them-selves;
• Homes that contain intelligent, communicating objects: these homes contain appliances and objects that can interact between them to increase their functionalities;
• Connected homes: these homes have internal and external networks that allow the user to access remotely to appliances and services. It also allows the user to get information about the home state. For example, a user can remotely turn on the heating system, or he can set up the intensity of light in a room using a smartphone application;
• Learning homes: these homes accumulate data from the interaction between user and appliances or sensors; and the stored data are used to anticipate user’s needs and to control technologies accordingly. The user initially has to manually set up routines and appliances while the system learns which are the habits and the preferences of its inhabitant in order to carry out some decisions or ambient changes independently. Purpose of Learning Homes is to reduce the interaction between the user and the system;
• Attentive homes: these homes register the activity and location of people and objects, and the system uses the information to control technology in anticipation of the occupants’ needs.
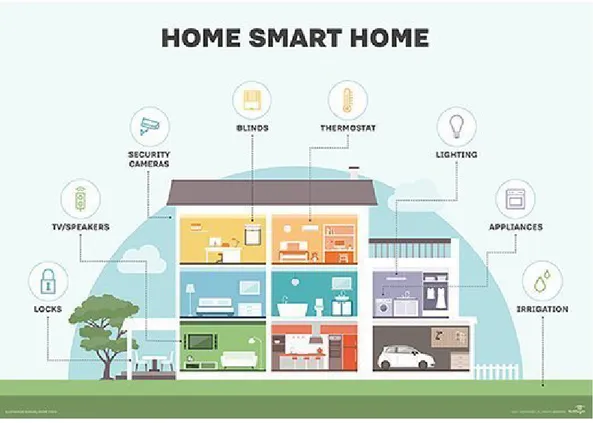
In Figure 2.1, we show an example of a Smart Home equipped with a system that supports the management of appliances, lighting, windows and door controls. Smart homes can be applied to different scenarios, as said by Cook in [7]. The most relevant ones are:
• Appliances management: this is the basic case, in which the Smart Home is just used to manage the appliances and to schedule their activity;
• Automated health monitoring: the smart home can identify the onset of diseases by monitoring user daily routines or movements;
• Energy consumption: Smart Homes can help people to manage energy in a smart way providing load identification or managing automatically energy when the user isn’t at home. Energy consumption is rising at a higher rate than population growth, and households are responsible for over 40% of total energy use in most countries.
2.2 BRIDGe 1.0 7
• Security and Control: Smart Homes can be used to monitor the house security.
Figure 2.1: Smart Home Example
For the scope of this project, our focus is on the Health monitoring scenario. BRIDGe, in fact, is targeted specifically to fragile people whose weakness threatens their autonomy, health, or other important aspects of life.
2.2
BRIDGe 1.0
The Behavioral dRift compensation for autonomous and InDependent liv-inG (BRIDGe) [4] is a project developed by the Assistive Technology Group (ATG) [3] at Politecnico di Milano. The aim of this project is to allow people not completely autonomous to live independently at their homes knowing someone they trust is watching over them. BRIDGe system is based on a wireless sensors network that supports house controls and user behaviour detection. The network can communicate with both the user and his social environment. BRIDGe offers different services that
help the inhabitant to manage the house in the the best way and communicate to the caregivers when there is a potential problem. The most important services are:
• House Control: it allows the user to manage lighting and shutter remotely; • Home Appliance Monitoring: the user can manage the appliances and have
a look at their energy consumption. Moreover the caregiver can get information about user activity in the house;
• Localization: BRIDGe analyzes the user’s position in the house and his actual status, for example if the person is sitting or moving;
• event-and-status-based Information Transmission: these messages are used to inform the caregivers of specific events, such as, for example, when no movements are detected for a predefined period of time.
Moreover, BRIDGe is highly customizable for satisfying different users needs, and is a low-cost platform in order to be accessible to all.
The basic infrastructure of the BRIDGe project is composed of a local and remote subsystem. The local subsystem includes home automation devices, sensors and a local server. It interconnects the smart home’s components, allowing the user to manage the entire house. The remote subsystem, instead, is used for the long-term storage of data coming from the local subsystem that will be analyzed over a long period of time. It is also used to control the house remotely and to provide information to the caregivers about the inhabitant’s status. BRIDGe works at low level managing directly the sensors, the appliances and all the interaction between them. This represents a limit for the system due to the needs of continuous maintenance and upgrades, since the high variety of available devices makes it difficult to develop new services. The main difference between BRIDGe and this project is the complexity of the local subsystem: our project manages the sensors at a higher level and, for this reason, it simplifies the local subsystem using it only to receive the sensors data, that are then stored and elaborated by the user services. In this way, services are independent of the smart homes components, making them applicable to all the houses registered to the system. In the proposed project we maintained BRIDGe focal points, that are:
• Customization and Adaptability: each user expresses different needs, so the system has to take into account personal characteristics;
2.3 Indoor Localization 9
• Privacy: data are only visible to authorized people;
• Usability: the system has to be easy to use and to learn by different people; • Modularity: the system can be integrated with other subsystems.
2.3
Indoor Localization
The Human Localization in indoor environments is a growing technology, boosted by the development of efficient, low cost devices and by commercial applications such as tracking and monitoring. An indoor localization system is a system that can determine the position of something or someone in a physical space such as in a hospital, a gymnasium, a school, etc. continuously and in real time (Dempsey [8]). The localization covers an important role in the modern smart homes because it allows to monitor the status of the inhabitants. In particular, the localization is used to support fragile people that live independently but that need their families to be watching over them, to monitor their status and investigate on long-running changes on their everyday routine. As stated by Yanying Gu et al. [9], an indoor localization system can provide different kinds of location information, based on user needs:
• Absolute Location Information: this information contains the exact position of the user in the house. It generally makes use of a map of the locating area to display the correct absolute position.
• Relative Position Information: this kind of output measures the motion of different parts of a target. For example, it can be used to track whether the door of a car is closed or not, the result is the relative position information of the tracked point on the door with respect to the body of the car.
• Proximity Location Information: this information contains the place where the user is. For example, it is used in hospitals to monitor whether the patient enters a correct room for diagnoses or operations.
During the years, different localization systems have been proposed to estimate the absolute position of the user. As Torres-Solis et al. stated [10], the location of a user is determined by measuring a physical quantity that changes when the user changes his actual position. Hence, a classification based on the type of measured quantity is
proposed. The main categories of this classification are: photonic energy, sonic waves, mechanical energy, magnetic fields, atmospheric pressure and radio frequency waves. This last physical quantity is widely used, thanks to its flexibility and reduced cost.
To produce a more accurate result more than one localization system can be used at the same time. As Veronese et al. stated [11], measurements coming from different systems applied on the same context can be used to detect faults or errors in the system. Faults can be of two different types:
• Human-made: these faults are caused by the humans, e.g. when the user is not wearing the localization device, or the user has damaged the device;
• Natural: these faults are caused by the devices, e.g. when a device is unreach-able, or a sensor is defective or malicious.
Veronese et al. [11] define, in their system, three different components that operate in parallel:
• Indoor Human Tracker: this component estimates the target people’s posi-tions in the indoor environment.
• Anonymous Interaction Detection: every objects with which the user in-teracts in a smart home can be sensorized. In so doing, every time that the user performs an action, an event is recognized and the user can be localized in the house. The detected interaction cannot be related to a specific person because the component can’t know which person is performing that action without other information.
• Presence Detection: this component makes use of presence sensors. While it is cheaper than an indoor human tracker, it is less accurate. In this case the sensors are activated by the movement of a person within their activation area. The indoor human tracker makes use of wearable devices or mobile phones to track the users’ positions. This can represent a limitation if the system users don’t use the mobile phone and don’t want to use wearable devices like bracelets.
When discussing about localization, it is worth considering aspects related to people privacy. All these systems must guarantee the privacy of their users. For this reason, without the user authorization, cameras can’t be used.
2.3 Indoor Localization 11
In our project, we don’t need the exact position of the user in the house. Our purpose is to track user activities for communicating potential warnings to his social environment in case of anomalies, such as a long period of inactivity. Moreover, in most cases users of our system are old people that regret to use bracelets or other devices to monitor their position and that are not used to always carry the mobile phone with them. For this reasons, we adopted a system that provides Proximity Location Information. It is less intrusive than the others and allow us to monitor the activity of the user. In particular, our work is inspired by the Presence Detection system proposed by Veronese et al. [11]. Our project is based on the use of the PIR sensors that detect the motion of a human without the need for a specific interaction. Sensors are activated when the user performs an action, e.g. when he opens a door or he sits in a chair.
Chapter 3
Use-Cases
This section describes the users who interact with the system and their possible roles. It also describes possible use-cases, which means how a specific role can act into the system.
3.1
Actors
The system is composed of the following main actors, also known as stakeholders:
• Customer • Elderly person • Family members • Installer • Administrator
3.1.1
Customer
The customer is the person, or the group of people, that subscribes the service. It can be the house owner or a member of his family. The customer is the reference figure for any payments or communications from the administrator or the installer.
3.1.2
Elderly Person
The elderly person is the house owner and the sensor’s network will be installed in his house. He can directly manage the system or he can delegate this task to a reliable person, like a family member or a caregiver.
3.1.3
Family Members
As the elderly may not be able to correctly operate with the system and to manage it, one or more family member will be required to manage the system. Moreover, all the authorized family members can access to the sensor network’s data and the engines’ data to supervise the elderly condition.
3.1.4
Installer
The installer is an authorized person with professional qualification that will install the sensors in the house of the customer. It is an optional figure because the sensors can be installed by the customer himself, or by another figure.
3.1.5
Administrator
The administrator manages the BRIDGe infrastructure. He can manage engines globally, and define a list of all the authorized installers, so that the customer can select his favourite one from the list.
3.2
Roles
The system is composed of the following main roles: • Owner
• Installer • Observer • Caregiver • SuperAdmin
3.2 Roles 15
3.2.1
Owner
It’s the user that purchases the service. As Owner a user can:
• register his HomeCenter and define all the roles and the users that can interact with the HomeCenter;
• register himself as Installer, Caregiver or Observer. In this way, he can view the data, install new sensors and manage all the engines;
• manage the relationship with the provider, like communications, payments or technical issues.
3.2.2
Installer
It is the user that installs the HomeCenter, in particular:
• he can configure the HomeCenter, defining new areas, subareas or installing new sensors. Moreover, he has to specify, for each sensor that requires it, the activation areas, that are the boundaries in which the sensor operates;
• he can check the status of each sensor’s battery to replace them when needed; • he can’t modify the house owner.
3.2.3
Observer
An Observer can view the data of the HomeCenters in which he is registered. In particular:
• he can view all the sensors’ data of the HomeCenter or he can filter the data by area, subarea or sensor;
• he can view all the engines’ data of the HomeCenter. He can filter a specific engine to view its data;
3.2.4
Caregiver
A Caregiver can manage engines’ rules, in particular:
• he can modify engines’ parameters for each HomeCenter. He can only modify editable parameters, while the read-only ones can be managed by the SuperAdmin only.
3.2.5
SuperAdmin
The SuperAdmin supervises the whole structure. In particular: • he can assign the role of Installer to a specific user;
• he can enable or disable the engines for each HomeCenter relying on the Owner requests;
• he can manage engines read-only parameters that the Caregiver can’t modify.
3.3
Scenarios
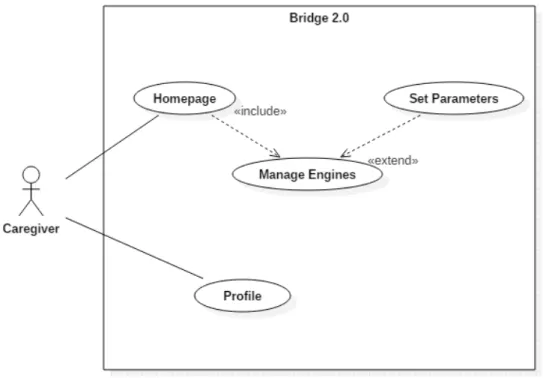
The following section shows the most common scenarios depicted using use-case diagrams. A new user, as shown in Figure 3.1, can register on BRIDGe by following the registration procedure. During the registration phase the user has to insert his email. Once filled the registration form, he will receive an email which allows him to activate his account by clicking on a provided link. When the account has been activated, the user can log in.
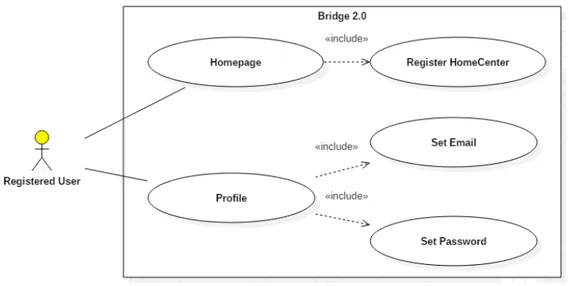
Once a user logs in, independently of his role, he can manage his account by modifying his email or his password. The homepage content is dependent on the user’s roles in the HomeCenters. The basic case, presented in Figure 3.2, is the one in which a user isn’t registered to any HomeCenter. In this case, he can only create his own HomeCenter, becoming the Owner of the house, or wait until an Owner registers him to his HomeCenter.
If the logged user is an Owner of one or more HomeCenters, the system enables more tasks, as shown in Figure 3.3. In fact, he can manage his HomeCenters, checking the battery level of the sensors, and he can manage Installers and Observers for his
3.3 Scenarios 17
Figure 3.1: User Basic Actions
Figure 3.2: Registered User Basic Actions
HomeCenters. The Owner can visualize a list of all the registered Installers and Observers and he can add or remove ones.
Figure 3.3: Owner Basic Actions
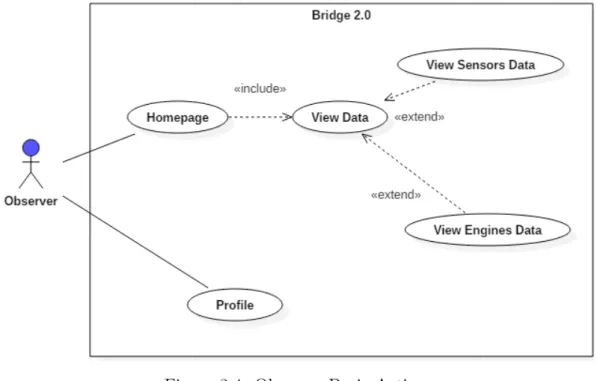
which he is registered. In particular he can view the data from the sensors and from the engines, as shown in Figure 3.4.
Figure 3.4: Observer Basic Actions
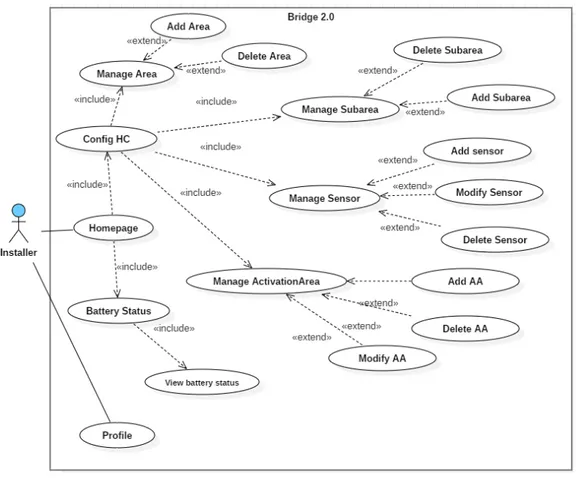
If the logged user is registered as Installer, as shown in Figure 3.5, he can: • check the battery status of the sensors of all the HomeCenters to which he is
3.3 Scenarios 19
• configure the HomeCenter managing all its parts: areas, subareas, sensors and activation areas.
Figure 3.5: Installer Basic Actions
If the logged user is a Caregiver, he can set and then modify all the additional parameters needed for the engines of the HomeCenters in which he is registered, as shown in Figure 3.6.
A user can have more than one role in a HomeCenter. For this reason the basic scenarios that we have presented can be combined to get a more complex experience for advanced users.
Chapter 4
Database Design
This chapter contains the database design details of this project. The database is a fundamental part of the system since the majority of the features and operations are based on data sent by the HomeCenters or directly produced by the Engines (as discussed in Section 5.1).
4.1
Requirements
The database selection is one of the central topic of the development phase. The following are the requirements for database that we need:
• it has to be reliable: data are a central resource in our project and we don’t want to lose pieces of information;
• it has to manage high frequency incoming data: our system can operate on multiple HomeCenters that send data at the same time. Moreover, each Home-Center can send tens of data per seconds based on the number of sensors that have been installed.
• it has to manage continuous operations: long running processes like Engines require multiple and continuous access to the database to store the results of the operations that they perform. (See Section 6);
• it has to manage spatial queries needed by the Localization algorithm, as explained in Section 6.3.
As of today, there are multiple different database management systems available and we have evaluated two of them:
• MySQL [12] • Postgres [13]
Both conform to the requirements have explained above. We chose Postgres because it offers more functionalities than MySQL about spatial features, and for its extensive documentation. Moreover, Postgres is released under a MIT-style license that allows commercial use without having to make the code open source, while MySQL is released under GPL license that doesn’t allow commercial uses without the release of open source code.
Spatial data, queries and operation are enabled on Postgres RDBMS by means of PostGIS extension.
4.2
Structure
4.2.1
ER Diagram
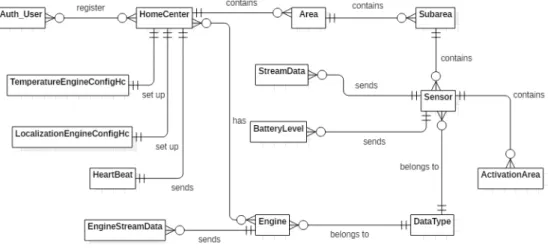
Figure 4.1 shows the Entity-Relationship diagram of the system. The attributes of the
Figure 4.1: Entity Relation Diagram
entities have been omitted because they will be discussed in Section 4.2.2. The main entity of the system is the HomeCenter, it can contain multiple sensors, characterized
4.2 Structure 23
by a type of data which defines how the system will manage the incoming data from that sensor.
Sensors in the HomeCenter are organized in subareas and areas. Each sensor is characterized by one or more activation area, defined as the boundary in which the sensor can be activated.
As stated in Section 4.2.2, a HomeCenter is associated to one or more users, and one user can be associated to one or more HomeCenters. The HomeCenter-User relation takes in account of the role covered by the user for the associated HomeCenter.
4.2.2
Entities
Entities are the recognizable “nouns” of the system for which we need to store any information. By using Django Framework, as we will discuss deeply in Section 5.1, we get the advantage of having a lot of ready to use features that are available out-of-the-box such as user management and session handling. For this reason we distinguish between built-in ready-to-use entities and system entities.
• Django Built-in Entities
For the purpose of our project we used two ready-to-use entities:
– User: this entity is designed to manage all the registered users. Its main attributes are the following:
∗ Username ∗ Email ∗ Password ∗ IS Active
Django framework offers out-of-the-box user management capabilities that include:
∗ user registration, with two-steps activation; ∗ user login/logout.
– Group: this entity manages the categorization of users. We use groups to apply permission to users. A user can belong to any number of groups among the fives ones we defined in Section 3.2:
∗ OBSERVER ∗ INSTALLER ∗ CAREGIVER ∗ SUPERADMIN • System entities
The following entities were identified in the planning phase.
– HomeCenter: this entity, shown in Table 4.1, holds the information about all the registered HomeCenters. A HomeCenter is defined by an auto-generated ID, a Name that is chosen by the house owner and by his Address. We have also defined a field Deleted that is set to True when the user wants to delete the HomeCenter. In this way, we can restore the HomeCenter in case of mistakes and we don’t immediately lose the data about that HomeCenter.
– Engine: this entity holds the information about each engine in the system. When a new engine is added in the system, the staff will register it into this entity to make it available for every HomeCenter. An engine is characterized by his name and the type of data that it will produce as shown in Table 4.1. Engines read and elaborate the data from the sensors producing a new data that is stored in a specific entity.
Table 4.1: HomeCenter, Engine Entities HomeCenter Attribute Field ID AutoField(PK) name CharField address CharField deleted BooleanField Engine Attribute Field name CharField(PK) data type ForeignKey(id)
– Area: every HomeCenter is divided into areas by the installer when he sets it up. An area, as shown in Table 4.2, is characterized by a Name and is connected to the HomeCenter that contains it. The areas’ definition is very flexible and is based on the HomeCenter structure and on the owner’s preference. Usually, areas are used to define the different floors of the house
4.2 Structure 25
but they can also be used, for example, to separate the inside part of the house from the outside part.
– Subarea: every Area contains at least one Subarea, that is usually intended as a room of the house. It is defined, as shown in Table 4.2, by its name, selected by the installer, and its shape, that is defined by a series of points that delimit the room boundary. Every point is expressed in 2D coordinates and it is referenced to an origin that has to be constant within each HomeCenter. Measures, distances and coordinates are expressed in meters. Points that depict the shape of the Subarea are stored into a PolygonField, a PostGIS specific field designed to allow spatial queries.
Table 4.2: Area, Subarea Entities Area Attribute Field ID AutoField(PK) hc ForeignKey(id) name CharField Subarea Attribute Field ID AutoField(PK) area ForeignKey(id) name CharField shape PolygonField
– Sensor: each subarea contains a variable number of sensors. Each sensor, as shown in Table 4.3, is defined by a Name, inserted by the installer. Each sensor in the HomeCenter has an associated physical id that is unique in the context of the HomeCenter but not in the whole system. This id will change when for example the sensor is faulty and it is replaced. We also link each sensor with an id generated and managed by Django to have a unique id for each sensor instance; in this way, when a sensor needs to be replaced we don’t lose the information about it, because we just need to update his physical id. Each sensor refers to a data type object that defines which kind of sensor it is and how the system manages it. We also need to know where the sensor is placed. The location is stored using a PointField, a PostGIS specific field designed for spatial queries.
– ActivationArea: as stated in Section 2.3, user presence can be defined more or less precisely depending on the type of sensor and the type of stimulus detected: a PIR sensor states that a generic movements is been detected within its field of vision, whereas a sensorized switch states that
the action has been performed in a precise location of the house.
For this reason, a “survey area” can be associated to a sensor; for the sake of processing simplicity, survey area is modelled as a set of one or more superposable axes-aligned rectangles. Each one of these rectangles is called Activation Area.
As shown in Table 4.3, each activation area is defined by his name, defined by installer, the sensor to which it is referred, the ne point of the rectangle and the sw point. It also contains three more fields: X,Y and point. These fields refer to the localization engine and they are auto-calculated whensw point and ne point are valorized.
Table 4.3: Sensor, Activation Area Entities
Sensor Attribute Field
ID AutoField(PK) subarea ForeignKey(id) data type ForeignKey(id)
name CharField position PointField physical id CharField ActivationArea Attribute Field ID AutoField(PK) sensor ForeignKey(id) name CharField ne point PointField sw point PointField X FloatField Y FloatField point FloatField
– StreamData: this entity holds the data coming from the sensors in each HomeCenter. Each data, as shown in Table 4.4, is characterized by a timestamp, a value, the HomeCenter from which the data is sent and the physical id of the sensor that sent the data.
– EngineStreamData: this entity holds the data generated by the engines. Each data, as shown in Table 4.4, is defined by his value, the timestamp in which it was generated, the name of the engine that has produced the data and the HomeCenter to which the data is referred to.
– BatteryLevel: this entity holds the information about the batteries of each sensor registered in the system as shown in Table 4.5. The sensors periodically send to the system the information about the current state of their batteries. Monitoring this data, the installer can replace a sensor’s battery when it is running out.
4.2 Structure 27 Table 4.4: StreamData, EngineStreamData Entities
StreamData
Attribute Field
ID AutoField(PK)
timestamp UnixTimeStampField
value CharField
physical sensor CharField homecenter IntegerField EngineStreamData Attribute Field ID AutoField(PK) timestamp UnixTimeStampField value CharField engine ForeignKey(id) hc ForeignKey(id)
– DataType: this entity holds the information about all the possible data type of the sensors registered into the system. This entity is managed by the staff and defines each data type with a name and a description as shown in Table 4.5. Each sensor must refer to a DataType instance.
Table 4.5: DataType, BatteryLevel Entities
DataType Attribute Field id data type CharField(PK) specification CharField BatteryLevel Attribute Field ID AutoField(PK) timestamp UnixTimeStampField level PositiveSmallIntegerField physical sensor CharField
homecenter IntegerField
– HeartBeat: this entity is used to check the status of the HomeCenters. When an HomeCenter is active, it periodically sends an HeartBeat signal containing its own timestamp. The entity stores the time difference between BRIDGe application server and each HomeCenters’ timestamp. Since received data are referred to HomeCenter’s timestamp, the stored time difference is used to time-wise accurately evaluate the data flow. This entity is characterized by the HomeCenter, the time difference and the last seen attribute, i.e. the timestamp of the last update, as shown in Table 4.6.
• Engines Entities: engines may need some additional parameters to perform their operations. For this reason, when a new engine is created we define a new entity containing the configuration of the engine for each HomeCenter. We defined two additional entities:
Table 4.6: HeartBeat Entity HeartBeat
Attribute Field
ID AutoField(PK)
homecenter IntegerField last seen UnixTimeStampField time difference FloatField
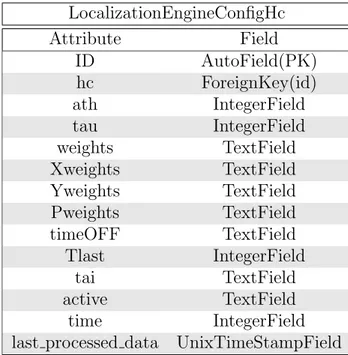
– LocalizationEngineConfigHc: this entity, as shown in Table 4.7, con-tains the additional parameters for the Localization Engine that we will discuss in Section 6.3, and the HomeCenter to which this parameter is referred. It is worth noting that parameters are stored as dictionaries and they are referred to all the activation areas in the HomeCenter.
– TemperatureEngineConfigHc: this entity, as shown in Table 4.7, con-tains the number of items on which to perform the average and the Home-Center to which this parameter is referred. The Temperature Engine get the last n temperature data related to the selected HomeCenter from StreamData and it calculates the average of these data to inform the user about the average temperature in the house.
In the development phase, we defined the attributes to clarify the many-to-many relations between the User and the HomeCenter and between the Engine and the HomeCenter. For the UserHc relation, we store the role of each user in each Home-Center and his state of activation, as shown in Table 4.8. For the EngineHc relation, we store the state of each engine for each HomeCenter, as shown in Table 4.8.
4.3
Backup
Data are the most important resource in our project. To prevent data loss we implemented a backup service that every midnight creates a JSON backup file of our database. The JSON file is then compressed and stored in a specific folder. The service is configured for keeping backups of the last seven days.
4.3 Backup 29
Table 4.7: Temperature, Localization Configuration Entities
TemperatureEngineConfigHc Attribute Field ID AutoField(PK) hc ForeignKey(id) n IntegerField LocalizationEngineConfigHc Attribute Field ID AutoField(PK) hc ForeignKey(id) ath IntegerField tau IntegerField weights TextField Xweights TextField Yweights TextField Pweights TextField timeOFF TextField Tlast IntegerField tai TextField active TextField time IntegerField
last processed data UnixTimeStampField
Table 4.8: UserHc, EngineHc Entities UserHc Attribute Field ID AutoField(PK) user ForeignKey(id) homecenter ForeignKey(id) role ForeignKey(id) active BooleanField EngineHc Attribute Field ID AutoField(PK) engine ForeignKey(id) hc ForeignKey(id) active BooleanField
Chapter 5
System Architecture and
Technologies
This chapter contains an overview of the architecture of the system and of the technologies we used to develop it.
5.1
Project Structure
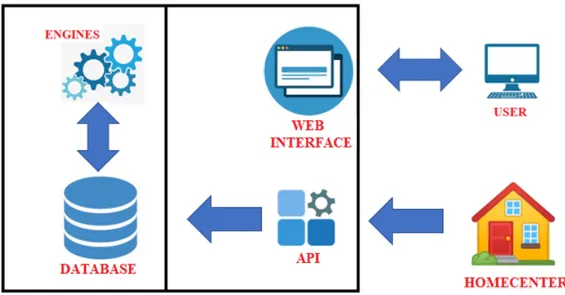
The overall purpose of the system is to receive data from the HomeCenters and to elaborate them for extracting knowledge or fro showing data to the users. For this reason, we implemented a web API that receives data and stores them into the database. Once stored, data are accessible by the authorized users through a website and by the engines that elaborate them to produce new refined data, as shown in Figure 5.1. Engines are the central part of our system and represent the additional services of the system. Each engine is independent and has a different function. At the moment, we have defined two different engines:
• LocalizationEngine: this engine takes as input the data from the position sensors(e.g. PIRs) and processes the activation sequence of the sensors to get the position of the person without invading his privacy. This engine will be deeper analyzed in Chapter 6;
• TemperatureEngine: this engine takes as input the data from the temperature sensors and every hour it calculates the average between the last n temperature data to get the average temperature in the home. The parameter n, as we have
explained in Section 4.2.1, can be set by a Caregiver, that is an authorized user, as described in Section 3.2.4.
Figure 5.1: System Data Flow
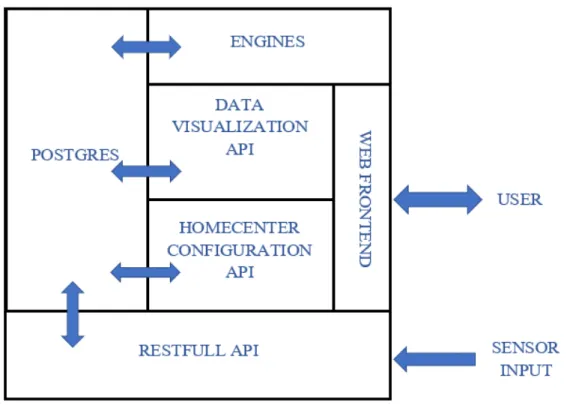
In Figure 5.2 we show a more detailed view of the structure of the system, the most important parts of the system are:
• RESTful API: this API manages incoming data from the HomeCenters. Home-Centers send different data to the system:
– sensors data: these data are the most important ones and are used by the engines to extract knowledge;
– battery status: HomeCenters send periodically data about the status of the battery of each sensor in the home;
– heart beat: HomeCenters periodically send a packet to notify that they are active. The packet contains the internal timestamp of the HomeCenter. In this way, we know which HomeCenters are sending data and the time difference between the internal clock of BRIDGe Application Server and the clock of the HomeCenters. This information is used to accurately evaluate the temporal information of the incoming data.
The API processes incoming data and saves them in the database if and only if they are different from the last data received by the same source, as we will explain in Section 5.2.1;
5.2 Technologies 33
• Database: the database is the central component of the system; it stores raw data coming from the HomeCenters and elaborated data coming from the engines. Database is also accessed by the web interface that manages the interaction between the system and the final users;
• Web Interface: this part of the system manages the interaction between the final users and the system. The user interacts with the web interface front-end that displays different features based on the user role, as explained in Section 3.2. The back-end of the web interface has been divided in two parts:
– Data Visualization: Observers (see Section 3.2.3) can have a look up of the sensors and engines data of the HomeCenters;
– HomeCenter Configuration: this part of the system allows the autho-rized users to manage the HomeCenters:
∗ installing new sensors and organizing them into subareas and areas; ∗ subscribing new users to the HomeCenters, as explained in Section
3.2.1;
∗ viewing the sensors battery status;
∗ managing the engines, activating them and setting their parameters. • Engines: this part of the system contains all the defined engines. Each engine
is independent from the others and has different features, as explained above. Engines can interact with the database to get raw data that are then elaborated and stored in the database.
5.2
Technologies
This section contains all the technologies that have been used to develop our system.
5.2.1
CherryPy
A RESTful API is an application program interface that uses HTTP requests to GET, PUT, POST and DELETE data. To develop the RESTful API, whose task is to manage incoming data, we evaluated different frameworks, in particular:
Figure 5.2: System Structure
• CherryPy [14], that is an object oriented web framework developed in python, that manage multiple database connections using threads that operate in parallel; • Django Rest Framework [15], also called RDF, that supports ORM (see
Section 5.2.3) data sources. It is very useful because we don’t need to manage the database directly. We can use object oriented models that operate at higher level.
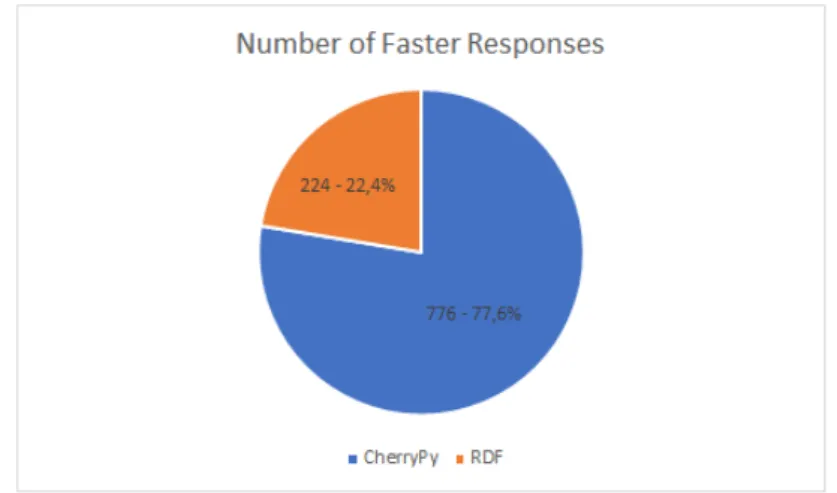
To test them we implemented two simple equivalent APIs and then we have tested their efficiency and insertion speed in the database. The results that we have obtained inserting one thousand data are shown in Figure 5.3 and in Figure 5.4. CherryPy is faster than RDF 778 times on one thousand and his average response time is 33% lower than the RDF one. CherryPy’s results are less variable than the RDF ones as shown by the standard deviation.
The performances are very important in the API because we have a lot of incoming data and we need a fast, reliable API. For this reason we chose CherryPy although RDF can manage operations on the database at a higher level. The main purpose
5.2 Technologies 35
Figure 5.3: CherryPy-RDF Response Time Comparison
Figure 5.4: CherryPy-RDF Number of Faster Responses
of the RESTful API is the insertion of the sensors’ data in the database. The API filters the incoming data and insert them in the database if and only if their values are different from the values of the last stored data coming from the same source. In Listing 5.1 we show the query that we use to manage the incoming sensors’ data. It is a conditional insert in which we insert the incoming data in the database if the last stored data coming from the same sensor and the same HomeCenter has different value. With the conditional insert we avoid to insert repeated data.
Listing 5.1: Conditional Insert Query INSERT INTO b r i d g e a p p s t r e a m d a t a
( timestamp , v a l u e , p h y s i c a l s e n s o r , h o m e c e n t e r ) SELECT %s ,% s ,% s ,% s
WHERE NOT EXISTS (SELECT 0 FROM b r i d g e a p p s t r e a m d a t a WHERE %s = (SELECT v a l u e FROM b r i d g e a p p s t r e a m d a t a WHERE p h y s i c a l s e n s o r = %s AND h o m e c e n t e r = %s ORDER BY i d DESC LIMIT 1) ) ,
( timestamp , v a l u e , i d s e n s o r , homecenter , v a l u e , i d s e n s o r , h o m e c e n t e r ) )
5.2.2
Django Framework
To implement the web interface of the system we used Django Framework. Django is a widely used free and open source Web framework [16]. It is written in Python and uses a slightly modified MVC software architecture pattern, called MVT. MVT is inspired by MVC, in fact it keeps different concerns into multiple connected parts. The different components can be implemented and tested efficiently. In this case the Django framework acts as the controller and also includes another component which is called Templates, as shown in Figure 5.5. By default the framework comes with its own templating language known as Django Template Language. It has a built-in ORM (see Section 5.2.3) that aims at providing abstraction between user classes and underlying database engine. Django has its own set of packages, one of them is called GeoDjango [17]. We use it as an intermediary level for executing spatial queries.
5.2 Technologies 37
5.2.3
Django ORM
In our system we use Postgres as explained in Section 4.1. Postgres is a relational DBMS and it manages data stored as tables; so actions are performed on records and each record can have more fields. In Object-Oriented Programming languages instead, data is usually stored in objects and actions are performed on objects. Objects have attributes and their values represents the data. These two concepts are different and cannot be used directly without an additional processing and transformation from one to the other. An Object Relational Mapper (ORM) is a component which acts as an intermediary layer between the Object-Oriented Programming language and a RDBMS. This is done by defining an Object Relational Mapping which defines the rules on how to translate data between the two paradigms as shown in Figure 5.6. Django has a built-in ORM, as explained in Section 5.2.2, that we used in the web interface back-end to manage the interaction with the database at an higher level of abstraction.
Figure 5.6: ORM Mapping
5.2.4
Celery
Celery [18] is an asynchronous task queue based on distributed message passing. Celery allows us to run the engines tasks in a separate process. We use Celery because we want to delegate the execution of the engines, that are long lasting jobs. We use the asynchronous tasks to elaborate database data and store the results. Celery
Beat [19] is the Celery scheduler, it kicks off tasks at regular intervals, tasks are then executed by available worker nodes in the cluster. Using Celery Beat, we can schedule the execution of the tasks. In particular, currently, we execute every second the Localization Engine task, for each HomeCenter in which the Engine is active, to update the position of the user in the house and we execute every hour the Temperature Engine task to update the average temperature in the house. In our system we defined one node with four workers that can work in parallel to execute all the requested tasks. To use Celery we need to choose a broker that manages the queue of jobs. It manages the messages between workers and scheduler. We used RabbitMQ [20], that is the most popular and used open source message broker. The issue of running asynchronous tasks can be mapped to the Producer/Consumer problem. Producers place jobs in the queue and the Consumers check the head of the queue and take the first job to execute it. In our system, as shown in Figure 5.7, the scheduler represents the producer, RabbitMQ is the queue and the workers are the consumers.
Figure 5.7: Celery Architecture
5.2.5
Django Pagination
We divided the web interface back-end in two parts: the HomeCenter management and the Data visualization part, described in Section 5.1. The Data Visualization
5.2 Technologies 39
section is accessible by the Observers, a type of user fully described in Section 3.2.1, and it shows the data from the sensors and the engines. When the user accesses this section he can choose the HomeCenter he wants to view from the list of all the HomeCenters in which he is an Observer. Each HomeCenter is presented as a card that allows the user to view his sensors’ data or the engines’ data. The user can also filter the data to have a more specific view. In particular, he can filter the sensors’ data by area, obtaining the data of all the sensors contained in the selected, by subarea or by a single sensor and the engines’ data selecting a particular engine from the list of all the available engines. To show the requested data to the user, we use Django Pagination [21], a Django extension to manage data divided into different pages. Using Django Pagination we get a queryset and then we split it into different pages that are shown when the user request them. Django doesn’t load all the requested data. It loads only the requested portion of data when a particular page is accessed. Listing 5.2 shows how the pagination is used. We divide the data into pages of fifty records and we get the page number from the request.
Listing 5.2: Data Pagination
a l l d a t a = StreamData . o b j e c t s . f i l t e r (h o m e c e n t e r = hc ) page = r e q u e s t .GET. g e t ( ‘ p a g e ’ , 1) p a g i n a t o r = P a g i n a t o r ( a l l d a t a , 50) t r y : d a t a = p a g i n a t o r . page ( page ) e x c e p t PageNotAnInteger : d a t a = p a g i n a t o r . page (1) e x c e p t EmptyPage :
Chapter 6
Localization
Localization is an important task in the project because we can use the position information to evaluate the inhabitant status. For example, if the user is moving during the night, then, probably, he is sleepless or ill. An Indoor Localization system is, as defined by Dempsey [8], a system that can determine the position of something or someone in a physical space such as in a hospital, a gymnasium, a school, etc. continuously and in real time. Localization systems can provide different kinds of information, as described in Section 2.3. In our system we don’t need the precise position of the user, for this reason we developed a system that produces, as result, a Proximity Location Information, that contains the place (e.g., room) in which the user is. This is done by analyzing the interaction of the user with the smart objects in the house and the information coming from the presence sensors. We named this localization system Localization over Actions or Movements (LoAM). The system that we developed is non-intrusive; the users, in fact, don’t have to wear bracelets or take mobile phones with them to be tracked. In this chapter, we will analyze the Localization Engine introduced in Section 5.1. We will discuss how it works showing the current localization algorithm and a possible generalization to his actual operation.
6.1
Localization Engine: Definition
In our system, engines are individual independent features based on the elaboration of raw incoming data to generate new information. In particular, the Localization Engine is aimed at localizing the current position of the inhabitant of the HomeCenter
in which the engine is active, and follow him during his movements. This is done by analyzing the activation sequence of the sensors in the home. A sensor is activated when the person passes through the sensor’s activation areas, that are defined as the boundaries in which the sensors can operate. The activation areas are defined by the Installer when the sensors are installed, as explained in Section 3.2.2, and are modelled as rectangles. A sensor can have more then one activation area, this allows the Installer to define more complex boundaries combining different rectangles. Information carried by a sensor data decays over time because a recent data probably represent the current position of the person, while an old one can be the result of and old interaction. For this reason we introduced the concept of weight of an activation area. The weight is set to one when the sensor associated to that activation area is activated and then decays every second if the sensor isn’t activated again. We want our localization engine not to be intrusive, for this reason we use PIRs sensors that can identify movements, and so the presence of a human being, analyzing the amount of infrared radiation impinging upon it. The sensor is activated when the amount of incoming infrared radiation varies. Using PIRs, people privacy is respected but the engine works correctly only when there is just one person in the home. PIRs, in fact, can identify the movements but not the identity of the person that is moving, so we can’t distinguish the movements of a person from the ones of the others. In Section 6.2 we analyze how the Localization Engine works, in particular we will explain the algorithm that allows us to identify the position and the movements of the inhabitant.
6.2
Localization Engine: Algorithm
6.2.1
Parameters
The Localization Engine needs parameters to work. For this reason, as explained in Section 4.2.1, we defined a table named LocalizationEngineConfigHc in our database to manage these parameters. The parameters are based on the HomeCenter configuration and structure, on the Owner preferences, as explained in Section 3.2, and on the algorithm results. For this reason parameters can have different values for each HomeCenter. There are two different types of parameters:
• Editable Parameters: these parameters can be modified by the Caregiver, a type of user defined in Section 3.2.4;
6.2 Localization Engine: Algorithm 43
• Non-editable Parameters: these parameters are set automatically by the algorithm and are updated when it runs. At startup all these parameters are set to zero.
Editable Parameters are:
• ath: this parameter represents the threshold beyond which the weight of an activation area is set to zero. In other words, it defines how many seconds the activation area has to be inactive before his weight is set to zero;
• tau: defines how fast the weight of an activation area tends to zero when the activation area is inactive.
Non-editable Parameters are:
• time: it is set to zero when the algorithm starts and every second it incremented by 1. Since the Localization Engine is launched every second it also represent the number of times the algorithm has been executed. It is the internal clock of our algorithm and other parameters are related to its value;
• Tai: it is a dictionary that contains, for each activation area in the HomeCenter, the last time in which the User was in that activation area;
• active: it is a dictionary that contains the status of each activation area in the HomeCenter. An activation area is active if and only if the last time in which the user was in that area is equal to the actual time, which means that an activation area is active if the value of its Tai is equal to the actual time; • Tlast: it is the last time in which the user was located, which means the last
time in which an activation area has been activated. If at least one activation area is active, as explained above, then its value is set to the time. If no activation area is active, Tlast is not changed;
• timeOFF: it represents how long an inactive activation area remains unused. It is incremented by one each second if the activation area is inactive and it is set to zero when the activation area is activated;
• weights: this parameter contains the weights of each activation area. They are calculated using:
where f is defined as: f = 0, if timeOF F > ath 1, if timeOF F < ath (6.2)
The weight of a particular activation area can be:
– 0: if f is equal to zero the activation area has been inactive for more then ath seconds, where ath is set by the user, as explained above;
– 1: if f is equal to one and tai is equal to Tlast. That means that the activation area is the last activated activation area of the HomeCenter in order of time;
– a value between 1 and 0: the weight decreases exponentially when the activation area is not the last activated area in order of time and it tends to zero depending on the value of tau.(Tau that is set by the user, as explained above.)
• Xweights: this parameter contains the weighted X-component of the barycenter of all the activation areas in the system. It is calculated:
Xweight = X ∗ weight (6.3)
where weight is defined as explained above and X is stored in the ActivationArea table, as explained in Section 4.2.1, and it is defined by:
(Xmin + Xmax) ∗ 0.5 ∗ (Xmax − Xmin
10 + 1) ∗ (
Y max − Y min
10 + 1) (6.4) where (Xmin + Xmax) ∗ 0.5 is the X-component of the barycenter, and (Xmax−Xmin10 + 1) ∗ (Y max−Y min10 + 1) is the area of the rectangle scaled by one hundred. We don’t need the correct value of the area because we use it as an index to simulate the movement of the person.
• Yweights: this parameter contains the weighted Y-component of the barycenter of all the activation areas in the system. It is calculated using:
6.2 Localization Engine: Algorithm 45
where weight is defined as explained above and Y is stored in the ActivationArea table, as explained in Section 4.2.1, and it is defined by:
(Y min + Y max) ∗ 0, 5 ∗ (Y max − Y min
10 + 1) ∗ (
Xmax − Xmin
10 + 1) (6.6) where (Y min + Y max) ∗ 0, 5 is the Y-component of the barycenter of the activation area and (Y max−Y min10 + 1) ∗ (Xmax−Xmin10 + 1) is the area of the rectangle scaled by one hundred;
• Pweights: this parameter contains the weighted scaled area of each activation area. It is calculated using:
Y weight = P ∗ weight (6.7)
where weight is defined as explained above and P is stored in the ActivationArea table, as explained in Section 4.2.2. It is defined by:
(Y max − Y min
10 + 1) ∗ (
Xmax − Xmin
10 + 1) (6.8)
We scaled it by one hundred because we are not interested in the correct value of the area, we only need an index of the dimension of the activation area;
• last processed data: this parameter contains the timestamp of the last pro-cessed data of the algorithm. In this way the algorithm won’t process data that are older than the last processed one.
To better explain the parameters, we simulated one interaction of the algorithm to a system composed by three activation areas, named area A, area B and area C. In Figure 6.1, we show the disposition of the three activation areas, displaying their position on the map, and the position of the user, represented by a red cross sign.
Figure 6.1: Algorithm Simulation Areas
In the example, we have set ath and tau to their default value, that is 10. As Table 6.1 shows, the only active area is area A, that is the area in which the user is located. Tai is set to the actual time in area A and it represents the last time in which the
user was in that area. Tlast is equal to 669 because, currently, one area is active. TimeOFF is equal to 0 in area A because it is active, while it measures how long the
others two areas have been inactive. F, in area A, is equal to 1 because timeOFF is less than ath, while it is 0 in area B and area C. The weights are calculated using the formula explained above:
6.2 Localization Engine: Algorithm 47
weightareaB = e((tai−T last)/tau)∗ f = e((647−669)/10)∗ 0 = 0 weightareaC = e((tai−T last)/tau)∗ f = e((616−669)/10)∗ 0 = 0
Table 6.1: Simulated Alghoritm Parameters Algorithm parameters
Area tai active Tlast timeOFF f weight
Area A 669 True 669 0 1 1
Area B 647 False 669 22 0 0
Area C 616 False 669 53 0 0
In Table 6.2, we show the values of the X and Xweight parameters of the areas. To calculate them we have used the formulas explained above, as example we show how we have calculated the parameters for Area A:
XareaA= (0 + 100) ∗ 0.5 ∗ ( 100 − 0 10 + 1) ∗ ( 90 − 0 10 + 1) = 5500 XweightareaA = 5500 ∗ 1 = 5500
Table 6.2: Xweight Results Xweight
Area Xmin Xmax Ymin Ymax X Xweight
Area A 0 100 0 90 5500 5500
Area B 130 180 0 90 9300 0
Area C 30 150 120 220 12870 0
In Table 6.3, we show the values of the Y and Yweight parameters of the areas. To calculate them we have used the formulas explained above, as example we show how we have calculated the parameters for Area A:
YareaA = (0 + 90) ∗ 0, 5 ∗ (90 − 0
10 + 1) ∗ (
100 − 0
10 + 1) = 4950 Y weightareaA = 4950 ∗ 1 = 4950