ALMA MATER STUDIORUM
UNIVERSITA' DI BOLOGNA
FACOLTA' DI SCIENZE MM.FF.NN
Corso di laurea magistrale in BIOLOGIA MARINA
”Changes in the microbial community
based on seawater pH variations”
Tesi di laurea in Biologia Marina
Relatore
Presentata da:
Prof. Rossella Pistocchi
Walter Dellisanti
Correlatori
Dott. Frédéric Gazeau
Dott. Michele Giani
II sessione
CONTENTS
ABSTRACT
11. INTRODUCTION
2
2. MATERIALS AND METHODS
52.1 EXPERIMENTAL SETUP AND SAMPLING 5
2.2 CARBONATE CHEMISTRY 5
2.2.1 DISSOLVED INORGANIC CARBON (DIC, CT) MEASUREMENTS 5
2.2.2 TOTAL ALKALINITY (AT) MEASUREMENTS 6
2.3 NUTRIENTS 6
2.4 CARBON AND NITROGEN PARTICULATE ANALYSIS 7
2.5 NET COMMUNITY PRODUCTION, COMMUNITY
RESPIRATION AND GROSS PRIMARY PRODUCTION 7
2.6 STATISTICAL ANALYSIS 8
3. RESULTS
93.1 CARBONATE CHEMISTRY 9
3.2 TEMPERATURE AND SALINITY 11
3.3 FLUORESCENCE OF Chl a, NUTRIENTS AND
OXYGEN CONCENTRATION 12
3.4 PARTICULATE ORGANIC CARBON 14
3.5 COMMUNITY METABOLISM 15 3.5.1 NCP, CR AND GPP RATES 15 3.5.2 CUMULATIVE RATES 16
4. DISCUSSIONS
185. REFERENCES
246. AKNOWLEDGEMENTS
33ABSTRACT
Ocean acidification is an effect of the rise in atmospheric CO2, which causes a
reduction in the pH of the ocean and generates a number of changes in seawater chemistry and consequently potentially impacts seawater life.
The effect of ocean acidification on metabolic processes (such as net community production and community respiration and on particulate organic carbon (POC) concentrations was investigated in summer 2012 at Cap de la Revellata in Corsica (Calvi, France). Coastal surface water was enclosed in 9 mesocosms and subjected to 6 pCO2 levels (3 replicated controls and 6 perturbations) for approximately one
month. No trend was found in response to increasing pCO2 in any of the
biological and particulate analyses. Community respiration was relatively stable throughout the experiment in all mesocosms, and net community production was most of the time close to zero. Similarly, POC concentrations were not affected by acidification during the whole experimental period. Such as the global ocean, the Mediterranean Sea has an oligotrophic nature. Based on present results, it seems likely that seawater acidification will not have significant effects on photosynthetic rates, microbial metabolism and carbon transport.
1. INTRODUCTION
The ocean is a significant sink for anthropogenic carbon dioxide (CO2) and has
an important role in regulation of the CO2 atmospheric concentration by physical,
chemical and biological processes. The concentration of CO2 in the atmosphere
has increased from 172-300 parts per million by volume (ppmv) in the pre-industrial era (Luthi et al., 2008), to 387 ppmv in 2009. The rate of increase was 1.0% yr-1 in the 1990s and reached 3.4% yr-1 between 2000 and 2008 (Le Quéré et
al., 2009). Future levels of atmospheric CO2 may reach 1020 ppmv in 2100
(IPCC, 2007).
The atmospheric CO2 is dissolved in seawater, reacts and changes its
chemical proprieties (Zeebe & Wolf-Gladrow, 2001). It is convolved in a complex reaction of balance between dissolved CO2, bicarbonate and carbonate ions.
Ocean acidification refers to a reduction in the pH of the ocean over an extended period, caused mainly by the uptake of anthropogenic CO2 from the atmosphere.
Mean surface ocean pH expressed on the total hydrogen ion scale (pHT) has
decreased from approximately 8.2 to 8.1 between pre-industrial period and the 1990s and may decrease by 0.3 – 0.4 unit (Caldeira & Wickett, 2003), reaching 7.8 in 2100 (Gattuso & Lavigne, 2009).
These changes in marine chemistry could lead to changes in carbon production and consumption (Riebesell & Tortell, 2011), and, therefore, to changes in oxygen production and consumption. Net community production (NCP) is defined as the balance between gross primary production (GPP) and community respiration (CR). NCP thus describes the net metabolism of the ecosystem. A positive NCP indicates that more organic carbon is produced than respired, so-called net autotrophy, while negative NCP indicates that respiration exceeds primary production, conducting to net heterotrophy.
The balance between photosynthetic carbon production and consumption of organic carbon in the ocean’s surface layer is important to understand the ocean’s role in the global cycle, so-called “microbial loop” (Azam et al., 1983; Cho & Azam, 1988; Azam & Malfatti, 2007). Marine phytoplankton plays an important role in the carbon cycle, being responsible for about half of the global primary production (Field et al., 1998). A large portion of organic carbon produced by photosynthesis is remineralized by respiration (del Giorgio & Duarte,
fraction of primary production in pelagic systems (Cole et al., 1988; Ducklow & Carlson, 1992). Mineral nutrients (e.g. N, P) can be a limiting factor of growth or organic carbon production by phytoplankton and bacteria.
Primary production is based on CO2 as the main substrate, and since the
CO2-binding enzyme RuBisCO has a low affinity for its substrate (Badger et al.,
1998), an increase in seawater pCO2 was hypothesized to stimulate phytoplankton
PP (Riebesell et al., 2000; Schippers et al., 2004; Rost et al., 2008). The effect of seawater carbonate chemistry on photosynthesis thereby depends strongly on the presence and characteristics of cellular CO2-concentrating mechanisms (CCMs;
Rost et al., 2003; Giordano et al., 2005). Phytoplankton species that are able to enhance their CO2 supply by CCMs may exhibit no or minimal sensitivity to CO2
enrichment (Raven & Johnston, 1991; Rost et al., 2003; Giordano et al., 2005, Reinfelder, 2011).
The effects of increasing pCO2 on production and respiration of pelagic
plankton have been studied on single-species in laboratory cultures and on semi-natural communities in field mesocosms. Primary production measured by 14C
fixation or production of particulate organic carbon (POC) at elevated pCO2 is
enhanced (Hein & Sand-Jensen, 1997; Riebesell et al., 2000; Zondervan et al., 2001; Schippers et al., 2004; Leonardos & Geider, 2005; Egge et al., 2009; Borchard et al., 2011, Engel, 2002, Engel et al., 2012), decreased (Sciandra et al., 2003), or shows no significant difference compared to the control (Tortell et al., 2002; Delille et al., 2005; Langer et al., 2006). Measurement of primary production based on 14C fixation or POC production are relatively numerous but
few studies have examined the metabolic balance (i.e. NCP, CR, and GPP) of planktonic communities based on changes of dissolved oxygen (DO) concentration at different pCO2 levels. The oxygen-based NCP measurement has
shown a significant decrease in NCP of Emiliania huxleyi at elevated pCO2 in a
N-limited chemostat culture (Sciandra et al., 2003), and insignificant changes in NCP of semi-natural plankton community at different pCO2 levels in mesocosm
experiments (Delille et al., 2005; Egge et al., 2009, Tanaka et al., 2012).
The objective of the present study was to investigate the effect of ocean acidification on the balance between GPP and CR (i.e. NCP) and on the particulate organic carbon production of a plankton community in the Mediterranean Sea. In summer 2012, a multidisciplinary experiment was conducted for about one month using free-floating mesocosms deployed at Cap de
la Revellata in Corsica (Calvi, France), as part of the MedSeA (Mediterranean Sea Acidification in a changing climate) project. A series of chemical, biogeochemical, biological, and physiological parameters were measured during this experiment. We have analyzed NCP, CR, and GPP based on changing concentrations of dissolved oxygen in incubation bottles, and POC concentrations together with other related chemical and biological parameters.
2. MATERIALS AND METHODS
2.1. EXPERIMENTAL SETUP AND SAMPLING
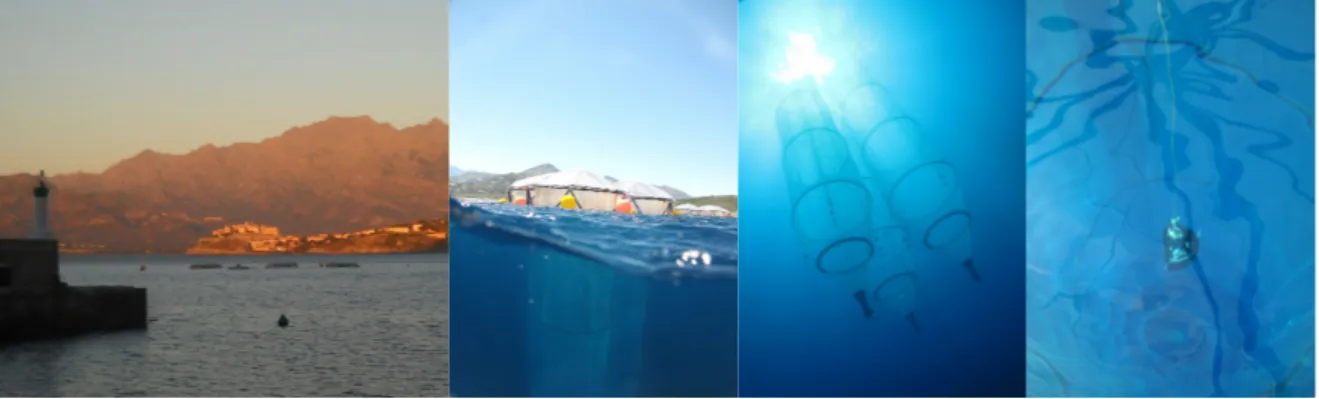
Nine mesocosms (52 m3, 15 m deep) were deployed and moored in the bay on
June 20th (Figure 1). Three mesocosms served as controls (pCO
2 ~ 450 µatm), and
in the six others various volumes of CO2-saturated seawater were added in order
to reach and the following levels: 550, 650, 750, 850, 1000, 1250 µatm. The addition of CO2-saturated water has been performed gradually over 4 days.
Figure 1. The bay of Calvi, mesoscosms and depth-integrated water sampler.
During the experimental period (June 24th – July 15th), depth-integrated
water sampling and CTD profiles (0 - 10 m) were performed daily in each mesocosm using, respectively, three Hydrobios integrated water samplers (volume: 5 L) and a Sea Bird Electronics (SBE) 19plusV2 technology with additional sensors for fluorimetry, pH and dissolved oxygen. Samples for the measurement of community metabolism were collected before sunrise (4:00am - 5:30am) every second day, whereas those dedicated to carbonate chemistry, nutrients and particulate matter measurements were collected in the morning (8:30am – 10:30am) on a daily basis. In total, 10 samplings have been performed for community metabolism (June 24th – July 14th), while 21 samplings have been
performed for carbonate chemistry, particulate matter and nutrients that ended on July 16th.
2.2. CARBONATE CHEMISTRY
2.2.1. DISSOLVED INORGANIC CARBON (DIC, CT) MEASUREMENTS
CT was measured daily by S. Alliouane and F. Gazeau (Laboratoire
France) on the AIRICA (Automated Infra Red Inorganic Carbon Analyser) and were performed, at 25°C, on 1200 μL samples directly poisoned after sampling with HgCl2. For calibration, 1100, 1200 and 1300 μL samples of the batch 117
(Certified Reference Material from A. Dickson. S = 33.503, CT = 2009.99 μmol
kg-1, Total alkalinity (A
T) = 2239.18 μmol kg-1) were measured.
2.2.2. TOTAL ALKALINITY (AT) MEASUREMENTS
AT was measured in the experimental samples using a Metrohm Titrando titrator
following the procedure described in Dickson et al., 2007 (SOP 3b). This parameter was measured daily from 24th June to 27th June and every second day
from 27th June to 16th July because of its low variability. A
T measurements were
performed on triplicate 50 mL samples at 25°C. Samples have been filtered onto GF/F and poisoned directly after filtration with HgCl2. The electrode from the
Metrohm Titrando titrator was calibrated every second day on the total scale using TRIS buffer solutions with a salinity of 35.0 (provided by A. Dickson).
The carbonate chemistry was calculated with the R package “seacarb”, using CT and AT as well as temperature and salinity (based on integrated CTD
profiles performed daily). In order to take into account the standard deviation of the measured parameters during the calculation of the carbonate chemistry parameters, a Monte-Carlo procedure was applied.
2.3. NUTRIENTS
The nutrients were measured daily by L. Michel (Stareso Research Station, Calvi, France) and S. Gobert (Laboratory of Oceanology, University of Liège, Liège, Belgium). Samples were directly frozen at -28 °C (for nitrites + nitrates, ammonium and phosphates) or kept at 4 °C (for silicates). No filtration was performed. Nutrient concentrations were determined spectrophotometrically, using a SKALAR continuous flow automated analyzer, following the methods of Strickland & Parson (1972) and Grasshoff et al. (1999), modified for oligotrophic seawater. Calibrations were performed before each analysis session. Analytical accuracy of data, checked using MOOS-2 certified reference material and internal blanks of nutrient exhausted seawater is typically between 0.02 and 0.05 μM.
2.4. CARBON AND NITROGEN PARTICULATE ANALYSIS
Two subsamples of about 2 L each were filtered on 25 mm glass fiber filters (Whatman GF/F) precombusted at 450 °C for 4 h. The filters were stored at -20 °C. The filters were folded and inserted in a tin capsula and analysed in CHNS-O. The filter for particulate organic carbon (POC) analysis was previously treated with the addition of HCl 1 N to remove the carbonate and then dried at 60 °C for about 1 h (Lorrain et al., 2003).The chemical elements were measured using an elemental analyser CHNO-S Costech mod. ECS 4010 by a high temperature oxidation at 980 °C, according to the method developed by Pella and Colombo (1973) and Sharp (1974). The sample and the capsule react with oxygen reaching temperatures of 1700-1800 °C. The combustion products pass through an oxidation column filled with Cr2O3 and a reduction column filled with copper wires in order to transform
the carbon into CO2, the hydrogen into H2O and the nitrogen into molecular N2.
The water is absorbed on an anhydrous magnesium perchlorate trap.
The carrier gas, helium (He), brings the CO2 and N2 to a gas
chromatographic separation column and to a TCD detector (Thermal Conductivity Detector). The TCD generates a signal, which is proportional to the amount of element in the sample. Known amounts of standard acetanilide (C8H9NO – Carlo
Erba; Assay ≥ 99.5 %) were used to calibrate the instrument. The C and N sample concentrations are in µg C L-1 and µg N L-1 (ratio between the C or N amount
resulting from the analysis and the filtered sea water volume after substracting the filter blanks).
2.5. NET COMMUNITY PRODUCTION, COMMUNITY
RESPIRATION AND GROSS COMMUNITY PRODUCTION
After collection, water samples from each mesocosm were brought back to the shore and distributed into 15 biological oxygen demand (BOD) bottles (60 mL) by overflowing by 2-3 times the bottle volume. Five bottles were immediately fixed (T0) with Winkler reagents, as described by Knap et al. (1996). The other 10
bottles were dedicated to the determination of net community production (NCP) and to community respiration (CR). Prior to filling, BOD bottles were washed with 5% HCl and rinsed thoroughly with Milli-Q water.
For each mesocosm, BOD bottles (x5) for NCP were incubated in situ at 5 m depth for 24 h at a mooring site located close to the mesocosms. BOD bottles used for the determination of CR (x5 for each mesocosm) were incubated in a laboratory incubator for 30 h, in which temperature was adjusted to the mean water temperature in the top 10 m on the day prior to sampling (21 - 24°C). Upon completion of the incubation, the bottles were immediately fixed with Winkler reagents.
DO concentrations were determined with an automated Winkler titration method using a potentiometric end-point detection (Titrando888, Metrohm). Reagents and standardizations were similar to those described by Knap et al. (1996). Rates of NCP and CR were determined by linear regression of DO against time (slope ± standard error: µmol O2 L-1 d-1). Gross primary production (GPP)
was calculated as the difference between NCP and CR. The combined uncertainty of GPP (SEGPP) was calculated using the standard error of NCP (SENCP) and CR
(SECR).
SEGPP = (SENCP) 2+
(SECR)
2
The cumulative values of NCP, GPP and CR were calculated from the sum of every second day rates, in all mesocosms, during the whole experimental period. Every single values was multiplied by two, because of every second day sampling, but only the last values (14th July) was multiplied by four, because of a no-sampling day (12th July).
2.6. STATISTICAL ANALYSIS
In order to identify, for the various parameters, differences between the pCO2
treatments, absolute deviations (AD(xi)) were calculated by subtracting from each observation (i.e. each mesocosm, Xi) the arithmetic mean of all observations ( ) at a specific time-point (t).
Mean deviations (MD) were calculated for each mesocosm according to:
With N being the number of observations and expressed as a relative value (%), according to Engel et al. (2012). Significance of the relationships between the mean deviations and average pCO2 levels were tested using a Student
3. RESULTS
3.1. CARBONATE CHEMISTRY
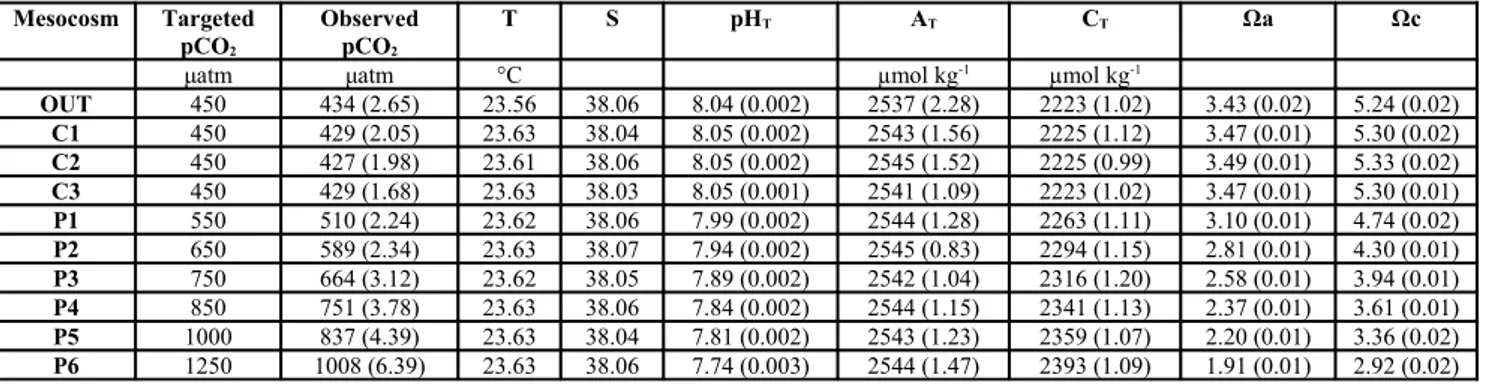
All the parameters of the carbonate chemistry are presented in Table 1 (average ± SD during the course of the experiment) and in Figure 2.
Table 1. Parameters of carbonate chemistry, temperature and salinity. Average and standard deviation (between brackets is reported).
Mesocosm Targeted pCO2
Observed pCO2
T S pHT AT CT Ωa Ωc
μatm μatm °C µmol kg-1 µmol kg-1
OUT 450 434 (2.65) 23.56 38.06 8.04 (0.002) 2537 (2.28) 2223 (1.02) 3.43 (0.02) 5.24 (0.02) C1 450 429 (2.05) 23.63 38.04 8.05 (0.002) 2543 (1.56) 2225 (1.12) 3.47 (0.01) 5.30 (0.02) C2 450 427 (1.98) 23.61 38.06 8.05 (0.002) 2545 (1.52) 2225 (0.99) 3.49 (0.01) 5.33 (0.02) C3 450 429 (1.68) 23.63 38.03 8.05 (0.001) 2541 (1.09) 2223 (1.02) 3.47 (0.01) 5.30 (0.01) P1 550 510 (2.24) 23.62 38.06 7.99 (0.002) 2544 (1.28) 2263 (1.11) 3.10 (0.01) 4.74 (0.02) P2 650 589 (2.34) 23.63 38.07 7.94 (0.002) 2545 (0.83) 2294 (1.15) 2.81 (0.01) 4.30 (0.01) P3 750 664 (3.12) 23.62 38.05 7.89 (0.002) 2542 (1.04) 2316 (1.20) 2.58 (0.01) 3.94 (0.01) P4 850 751 (3.78) 23.63 38.06 7.84 (0.002) 2544 (1.15) 2341 (1.13) 2.37 (0.01) 3.61 (0.01) P5 1000 837 (4.39) 23.63 38.04 7.81 (0.002) 2543 (1.23) 2359 (1.07) 2.20 (0.01) 3.36 (0.02) P6 1250 1008 (6.39) 23.63 38.06 7.74 (0.003) 2544 (1.47) 2393 (1.09) 1.91 (0.01) 2.92 (0.02)
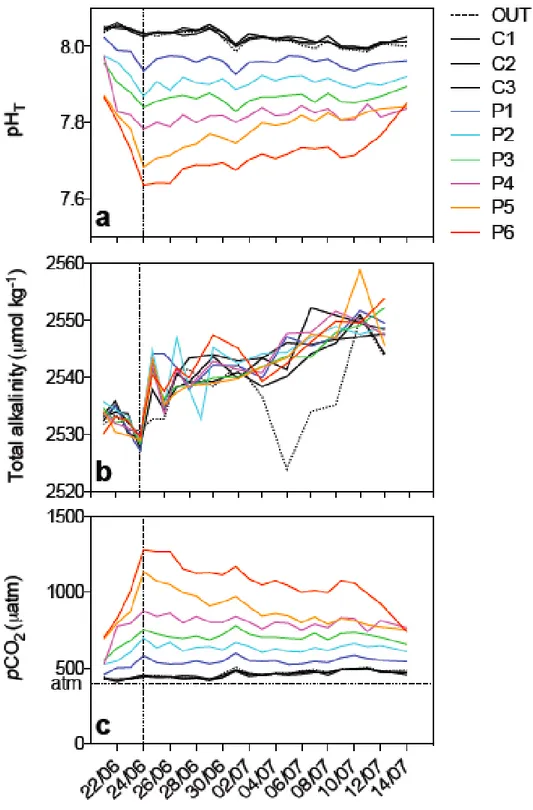
The starting pCO2 values of perturbation mesoscosms (data not shown)
were very close to the targeted values (see 2.1 section). pH and pCO2 conditions
in the control mesocosms were similar to those of the outside environment, following the same variations, throughout the whole experimental period (Figure 1). AT was lower in the outside environment from July 4th to July 12th due to
atmospheric events that mixed the water column. AT increased gradually in all
mesocoms, during the experimental period as a consequence of the water body isolation and subsequent evaporation.
Reached the targeted values, the pCO2 decreased gradually in all
“perturbed” mesocosms but more importantly in the high-CO2 mesocosms (P4, P5 and P6), during the experimental period as a consequence of CO2 exchange
between the water column and the atmosphere. Similarly, pHT levels increased
gradually in all “perturbed” mesocosms during the experimental period. CTD-pH profiles in the water column (data not shown) revealed that this parameter was perfectly vertically homogeneous during the whole experimental period.
Figure 2. Trends of integrated pHT, total alkalinity and pCO2 values in all mesocosms (3
controls and 6 “low-pH” levels) as well as in the bay of Calvi (OUT) during the experimental period.
3.2. TEMPERATURE AND SALINITY
Mean temperature and salinity (± SD) are presented in Table 1. The variations in temperature were mainly related to weather conditions. Cyclical atmospheric events both enhanced mixing and convection processes, that homogenize the hydrological properties, and promoted calm and smooth conditions enhancing stratification (data not shown). Shifts between these two states were experienced, with three mixing events (June 22nd – 26th, July 3rd – 4th; July 11th
– 16th) resetting stratified conditions. Water column integrated values showed
that the heat content continuously increased until the last mixing event for all mesocosms and closely followed the outside dynamics (Figure 3.a).
Figure 3. Water column integrated temperature (a) and salinity (b) evolutions during the course of the experiment in all nine mesocosms and in the bay of Calvi.
The variations in salinity in the mesocosms were less clearly related to outside conditions as the water masses were isolated from the surrounding environment. Salinity remained homogeneous in the water column in all
mesocosms (data not shown) and water-column integrated values are shown in Figure 3.b. While the variations in salinity outside the mesocosms were depending on circulation changes in the bay of Calvi (OUT), salinity increased during the course of the experiment in all mesocosms, with an accentuation at the end of the experiment. This can be explained by the presence of the cover topping mesocosms that artificially reduce sensible heat fluxes variations by decreasing temperature gradient and wind stress at air-sea interface. It has to be stressed that the dispersion in between mesocosms significantly increased at the end of the experiment. This can be due to external effects of dilution with respect to the wind burst of the last week.
3.3. FLUORESCENCE OF Chl a, NUTRIENTS AND
OXYGEN CONCENTRATION
The water column integrated fluorescence signals in all nine mesocosms are shown in Figure 4.a.
Very low chlorophyll a concentrations were observed with a decrease from 0.1 to 0.05 μg L-1 at the beginning of the experiment, and a peak up to 0.1
μg L-1 during the second mixing event (July 3rd – 4th) that followed a long
stratification period. The deviations of chlorophyll a concentrations from the mean showed a not statistically significant relationship with pCO2 (F-test, P >
0.05). These low values of fluorescence Chla can be explained by the presence
of very low concentrations of nutrients, usually below the detection limits, at the exception of Silicates (NO3 ≤ 0.1 µmol L-1; NH4+ < 0.5 µmol L-1; PO4 <
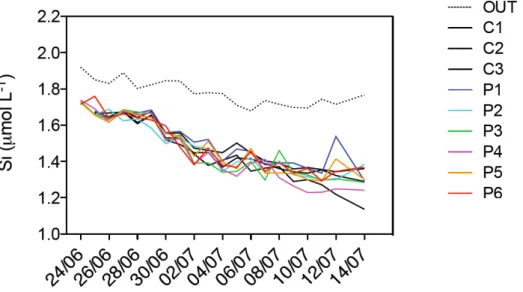
0.07 µmol L-1; Si < 2 µmol L-1). Silicate concentrations showed a decline in all
mesocosms from the beginning to the end of the experiment (Figure 5). The deviations from the mean showed a not statistically significant relationship with pCO2 effect (F-test, P > 0.05).
Figure 5. Integrated silicate concentrations during the course of the experiment in all nine mesocosms and in the bay of Calvi.
The oxygen saturation (expressed as percentage of saturation) is shown in Figure 3.b. It was relatively stable in the first half of the experiment (until 30th
June) in all mesocosms with values below to 105 % of saturation. From the 1st
July the oxygen saturation decreased gradually reaching values below to 100 % of saturation in all mesocosms. Similar conditions were observed to the outside environment. CTD-oxygen saturation profiles in the water column (data not shown) revealed that this parameter was perfectly vertically homogeneous during the whole experimental period.
3.4. PARTICULATE ORGANIC CARBON
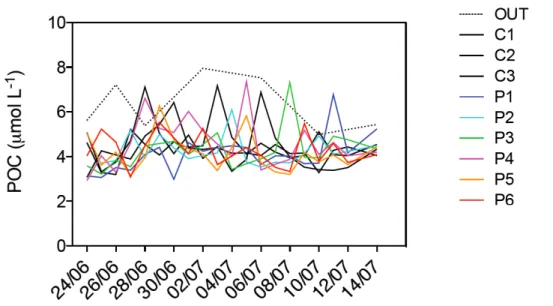
POC values did not show a clear trend, ranging between ~3.5 µmol L-1 and ~4.5
µmol L-1 (Figure 6), with lower values at the beginning of the experiment and
higher values on June 29th and 30th. POC concentrations outside the mesocosms
(OUT) were generally higher than inside the mesocosms, ranging between ~5 µmol L-1 and ~8 µmol L-1. The deviations of POC concentrations from the mean
showed a not statistically significant relationship with pCO2 (F-test, P > 0.05).
Figure 6. Integrated particulate organic carbon (POC) concentrations during the course of the experiment in all nine mesocosms and in the bay of Calvi.
3.5. COMMUNITY METABOLISM
3.5.1. NCP, CR AND GPP RATES
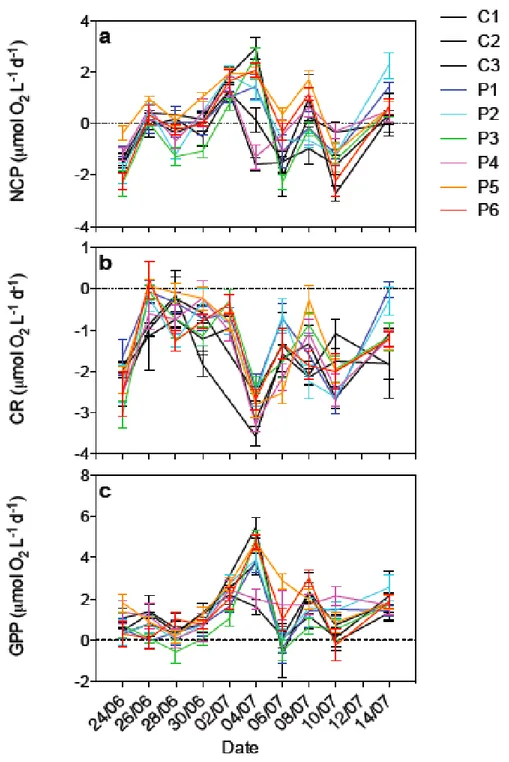
NCP rates in all nine mesocosms are shown on Figure 7 and were all the time relatively close to 0, ranging between -2.7 ± 0.3 µmol O2 L-1 d-1 and 2.9 ± 0.4
µmol O2 L-1 d-1.
Figure 7. Metabolic rates during the whole experiment: (a) net community production (NCP), (b) community respiration (CR), and (c) gross primary production (GPP). All rates are expressed in µmol O2 L-1 d-1 (± SE).
At the start of the experiment, the water column was heterotrophic (NCP < 0) in all mesocosms. NCP rates generally increased until July 4th when
almost all mesocosms were net autotrophic at the exception of P4 and C3, and then oscillated around the metabolic equilibrium (NCP = 0), showing no real trend. CR rates varied between -3.6 ± 0.2 µmol O2 L-1 d-1 and +0.2 ± 0.4 µmol O2
L-1 d-1. On several occasions, CR rates were not significantly different from 0. CR
was quite variable during the experiment with a first phase showing very low rates (~ 0 to ~ -1 µmol O2 L-1 d-1), a peak for all mesocosms on July 4th and variations at
intermediate levels until the end of the experiment, except for P1 and P2 which exhibited very low CR rates on the last incubation day. GPP varied between -0.7 ± 1.1 µmol O2 L-1 d-1 and 5.5 ± 0.5 µmol O2 L-1 d-1. On seven occasions, negative
rates have been calculated, however these rates were not significantly different from 0. GPP globally increased during the first half of the experiment to reach a peak in all mesocosms, except for P4 and C3. GPP oscillated thereafter between 1 and 3 µmol O2 L-1 d-1 until the end of the experiment.
3.5.2. CUMULATIVE RATES
Cumulative rates for all mesocosms are shown in Figure 8. The cumulative NCP was negative for C2 (- 8.0 µmol O2 L-1), C3 (- 9.6 µmol O2 L-1) and P3 (- 8.25
µmol O2 L-1). The highest cumulative NCP was measured for P5 (15.42 µmol O2
L-1). Cumulative CR ranged between -40.3 µmol O
2 L-1and -21 µmol O2 L-1. The
highest cumulative GPP was measured in P5 (42 µmol O2 L-1) and the lowest in
P3 (20.9 µmol O2 L-1). For all these processes, no significant relationship could be
Figure 8. Cumulative values of all metabolic process during the experimentak period: (a) net community production (NCP), (b) community respiration (CR), and (c) gross primary production (GPP).
4. DISCUSSIONS
Dissolved CO2, rather than the much more abundant bicarbonate ion, is the
substrate used during the “carbon fixation” step of photosynthesis, perfomed through the enzymatic activity of the RubisCO (ribulose-1, 5-bisphosphate carboxylase oxygenase). This enzyme has low affinity for CO2, though is higher
than O2, achieving half saturation of carbon fixation at CO2 concentrations above
those present in seawater (Badger et al., 1998). Because CO2 diffuses readily
through biological membranes and leaks out of the cell it is expected that an increase in the CO2 concentration of surface seawater will reduce CO2 leakage,
lowering the cost of concentrating CO2 (normally against a concentration
gradient). This can facilitate photosynthesis, leading to an increase in primary production. Stimulating effects of elevated CO2 on photosynthesis and carbon
fixation have indeed been observed in a variety of phytoplankton taxa, such as diatoms (Burkhardt et al., 1999; Gervais & Riebesell, 2001; Wu et al., 2010), coccolithophores (Barcelos e Ramos et al., 2010; De Bodt et al., 2010; Muller et
al., 2010; Rickaby et al., 2010), cyanobacteria (Levitan et al., 2007; Fu et al.,
2008; Kranz et al., 2009) and dinoflagellates (Burkhardt et al., 2009; Rost et al., 2006).
The extent to which phytoplankton may respond to increased CO2 /
decreased pH depends also on the physiological mechanisms of inorganic carbon uptake and intracellular assimilation, such as cellular CO2-concentrating
mechanisms (CCMs; Rost et al., 2003; Giordano et al., 2005). Species with effective CCMs are less sensitive to increased CO2 levels than those with less
efficient CCMs (Burkhardt et al., 2001; Rost et al., 2003). Because of energetic costs of CCMs, light and nutrients may affect how CO2 regulates photosynthesis
in marine phytoplankton and, as a result, the species composition, timing, and duration of phytoplankton blooms. The interactions of CO2, nutrients, and light
may also affect the geochemical cycles of elements in the sea because the C, N, and P contents and PIC:POC ratios of biogenic particles are modulated by CO2
-driven changes in cell physiology and phytoplankton species composition (Reinfelder, 2011).
Ocean acidification has direct or indirect effects both on autotrophic and heterotrophic organisms, influencing their processes, such as respectively primary
and secondary production. Changes in pCO2 can lead to significant changes in the
community structure of free-living bacteria, which were tightly correlated to phytoplankton dynamics (Allgaier et al., 2008). During the Bergen mesocosm experiments (PeECE project), the apparent increase in DOC production did not stimulate bacterial secondary production due to N and P limitation as reported by Tanaka et al. (2008). As a matter of fact, TEP (transparent exopolymeric particles) production, DOC exudation and ensuing enhanced sedimentation must be high to stimulate secondary production. The steady increase in dissolved organic material (DOC, DON, DOP) was not significantly different between mesocosms with different pCO2 values (Schulz et al., 2008). The free-living and
attached bacteria activities were negatively correlated. This condition explains that increasing concentrations of DOC throughout the bloom do not necessarily stimulate bacteria secondary production. As indicated by Tanaka and collaborators, after the peak of the phytoplankton bloom the released labile DOC may have been rich in carbon such as glucose whereas P and N were depleted.
This suggests that there is a slight but rather indirect effect of changes in
pCO2 on bacterial activities and community structure that is mainly related to
phytoplankton carbon consumption, DOC exudation, as well as TEP formation and subsequent sedimentation. During the Svalbard experiment (EPOCA project), DOC production was significantly higher in CO2 enriched mesocosms suggesting
that CO2 had a direct influence on DOC production. DOC concentrations inside
the mesocosms increased more in high-CO2 mesocosms (Engel et al., 2012),
stimulating the activities of heterotrophic microorganism.
In contrast, in another mesocosm experiment, no significant effects of ocean acidification were found on the concentrations of chromophoric DOM (cDOM) and DOC (Engel et al., 2004; Grossart et al., 2006; Schulz et al., 2008). In on-board experiments under increased pCO2, the production of TEP increased
as a function of CO2 uptake (Engel, 2002). In a mesocosm experiment, TEP
production was significantly higher in the high pCO2 levels (~710 μatm) than in
lower pCO2 treatments (Engel et al., 2004). This indicates a possible direct effect
of pCO2 on polysaccharide exudation. The increasing DIC levels should not
increase the particulate organic carbon (POC) concentrations, because of an increased TEP production, which stimulated particle aggregation and accelerated sedimentation as previously observed by Logan et al. (1995) and Engel (2000).
bacterial production by attracting these cells to the microbial hot spots (Simon et
al., 2002). Therefore, increased TEP aggregation could result in higher bacterial
abundance and production (Weinbauer et al., 2011).
It has been recognized that heterotrophic bacteria can be strong competitors of phytoplankton for inorganic nutrients (Thingstad & Rassoulzadegan, 1995), and bacterial processes appear to be P-limited in the oligotrophic waters of the Mediterranean Sea. Highly significant positive relationships have been shown betweenprimary and bacterial productions in both western and eastern basins of Mediterranean Sea, indicating that primary production is a source of DOC for bacterial production in both areas, although the nature of therelationships is significantly different between the two basins.
Almost all published scientific papers were elaborated on single organisms and less than 5% of the studies have been performed on real communities or ecosystems (Gattuso & Hansson, 2011). Extrapolating knowledge from individual species studies and associating it to ecosystem is difficult because of the absence of competition or trophic interactions during most of the experiments. Several experiments have been conducted on benthic systems in natural high CO2 environments (Hall-Spencer et al. 2008) or through
oceanographic transects along CO2 gradients (Charalampopoulou et al., 2011)
although these types of studies are limited by the numerous co-varying environmental factors with pCO2 (Riebesell et al., 2012). Mesocosms appear as
the only scientific tool that allow maintaining a natural community under almost natural and self-sustaining conditions and testing the effects of a perturbation on its dynamics and functionning.
In the past few years, several mesocosm studies focusing on the effects of ocean acidification have been conducted. Three have been performed in the frame of the PeECE project (Bergen, Norway, Pelagic Ecosystem CO2 Enrichment studies,
2001 - 2005). Most of the results have been published in a special issue of the Biogeosciences journal (http://www.biogeosciences.net/special_issue38.html). The results obtained during the European Project on Ocean Acidification (EPOCA) project in Svalbard (Kongsfjorden, Norway) in 2010 are currently under revision in a special issue of the Biogeosciences journal (http://www.biogeosciences-discuss.net/special_issue94.html).
In Bergen and in Svalbard, respectively Egge et al. (2009) and Engel et
technique) at high pCO2 levels. During the Bergen experiment, Riebesell et al.
(2007) showed an evident enhanced DIC drawdown at high pCO2 due to the
increased production of organic matter. During the Svalbard experiment, Silyakova et al. (2012) showed net autotrophy in the mesocosms under high CO2
treatment, while mesocosms with intermediate and low CO2 levels were net
heterotrophic. In Bergen, using the same technique than in the present experiment (i.e. O2 dynamics), Delille et al. (2005) showed no changes in NCP related to
pCO2 conditions. In a subsequent Bergen experiment, Egge et al. (2009) showed
that NCP, CR and GPP were not dependant on pCO2 levels. Recently, in Svalbard,
and in contrast to the results of Silyakova et al. (2012), Tanaka et al. (2012) showed insignificant responses of NCP with increasing pCO2 during the whole
experimental period.
In the present experiment, no effect of increasing pCO2 was observed on
any of the measured metabolic rates. CR was relatively stable throughout the experiment in all mesocosms, and NCP was most of the time close to zero. As a result, the cumulative GPP did not vary with increasing pCO2 level during the
experiment. Furthermore, POC concentrations were not affected by acidification during the total period of the experiment. Unfortunately, DOC data were not available yet. These results suggest that elevated pCO2 does not influenced NCP
and the amount of POC produced by the summer planktonic community in the Mediterranean Sea.
The absence of any effects of high pCO2 / low pH in our study could be
explained by the environmental settings (chemical and biological). Indeed, chlorophyll and nutrients are necessary to sustain photosynthesis. Phytoplankton must acquire, from surface seawater, inorganic carbon and nutrients, including nitrogen, phosphorus and trace metals, such as iron for the formation of organic matter using energy from sunlight. Nitrogen and phosphorus are used to make proteins, nucleic acids and other fundamental compounds. Diatoms need also silicates in order to produce their tests. In certain circumstances, these nutrients can be limiting factor of the growth and production of organic matter. The consumption of silicates during the experiment suggests that phytoplankton was slowly growing, albeit with no accumulation of organic matter. The water used to fill the mesocosms had very low concentrations of NO3, PO4, and chlorophyll,
suggesting very oligotrophic conditions. This experiment was the first one to be conducted in these types of environment. The starting concentrations of nutrients
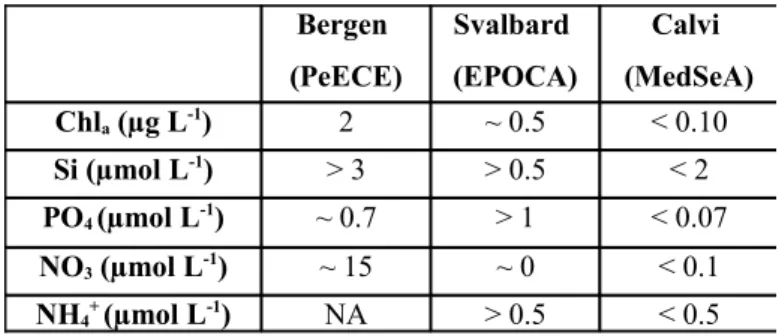
and Chla during the present experiment are summarized in Table 2 and compared
to those during the previous mesocosm experiments. Note that in the PeECE and EPOCA studies, the mesocosms were even further enriched with nutrients to produce artificial phytoplankton blooms.
Table 2. Summary of nutrients and Chl a concentrations at the starting conditions in 3 different mesocosm experiments (Riebesell et al., 2008, for PeECE; Schulz et al., 2012, for EPOCA; present work, for MedSeA).
Another explanation would be that phytoplanktonic species present in the mesocosms had very efficient CCMs, which may have limited the theoretical stimulating effects of pCO2 on photosynthesis. Unfortunately, at the time of
finalizing this thesis, results on the diversity of the planktonic community were not available.
It has to be stressed that ocean acidification will not the only perturbation potentially impacting the ocean The Mediterranean Sea is a largely enclosed sea, with high temperature and salinity, showing consistent surface warming rates of 0.026 - 0.033 °C year-1 driven by regional phenomena (Bensoussan et al., 2009).
On the Catalan coast (Spain), Coma et al. (2009) showed enhanced stratification with a ca. 40% higher since 1974. This increase in temperature can lead to impacts on the Mediterranean Sea role in the global carbon cycle, through changes in solubility (CO2 solubility decreases with increasing temperature) and
biological carbon pumps. Indeed, most of nutrient supply to the surface ocean comes from the mixing and upwelling of cold, nutrient - rich water from below. Warming of surface waters increases stratification, inhibits mixing and reduces the upward nutrient supply and therefore decreases productivity (Doney, 2006).
The effect of global change on photosynthesis has focused on the importance of thermal stratification for light supply and nutrient availability with any effects from direct temperature influence. Indeed, temperature increase
Bergen (PeECE) Svalbard (EPOCA) Calvi (MedSeA) Chla (µg L-1) 2 ~ 0.5 < 0.10 Si (µmol L-1) > 3 > 0.5 < 2 PO4 (µmol L-1) ~ 0.7 > 1 < 0.07 NO3 (µmol L-1) ~ 15 ~ 0 < 0.1 NH4+ (µmol L-1) NA > 0.5 < 0.5
of light-limited phytoplankton appears to be less responsive to temperature than heterotrophic processes. This parameter is suspected to affect the magnitude, timing and composition of phytoplanktonic blooms. However, considering the oligotrophic nature of Mediterranean Sea, seawater warming, as we have seen for acidification, will most likely not have significant effects on photosynthetic rates, and we expect that the increase of the water column stratification will even increase these nutrient-limiting conditions and decrease primary production rates, as suggested by Behrenfeld et al. (2006) for the world ocean. Nevertheless, it seems clear that seawater warming will induce a shift in dominant species toward small-sized cells, an effect that has been observed also in several ocean acidification studies (Legendre & Rivkin, 2002; Riebesell et al., 2009). All in all, this will certainly have impacts on the capacity of the surface water ecosystems to provide organic matter for higher trophic levels and the deep-sea, as well as its capacity to pump atmospheric CO2, therefore minimizing the role of the ocean as
5. REFERENCES
Ait-Ameur, N. & Goyet, C. (2006). Distribution and transport of natural and anthropogenic CO2 in the Gulf of Cadiz. Deep-Sea Research Part II 53, 1329–
1343.
Allgaier, M., Riebesell U., Vogt, M., Thyrhaug, R. & Grossart, H.P. (2008). Coupling of heterotrophic bacteria to phytoplankton bloom development at different levels: a mesocosm study. Biogeosciences, 5, 1007 - 22
Azam, F., & Malfatti, F. (2007). Microbial structuring of marine ecosystems.
Nature reviews. Microbiology, 5 (10), 782–91
Azam, F., Fenche, T., Field, J.G., Gra, J.S., & Thingstad, F. (1983). The Ecological Role of Water-Column Microbes in the Sea. Marine Ecology Progress
Series, 10, 257–63
Badger, M.R., Andrews, T.J., Whitney, S.M., Ludwig M., Yellowlees D.C., Leggat, W. & Price, D.G. (1998). The diversity and coevolution of Rubisco, plastids, pyrenoids, and chloroplast-based CO2–concentrating mechanisms in
algae. Canadian Journal of Botany, 76 (6), 1052 -71
Barcelos e Ramos, J., Muller, M.N. & Riebesell U. (2010). Short-term response of the coccolithophore Emiliana huxleyi to an abrupt change in seawater carbon dioxide concentrations. Biogeosciences, 7, 177 – 86
Behrenfeld, M.J., O’Malley, R.T., Siegel, D.A., McClain, C.R., Sarmiento, J.L., Feldman, G.C., Milligan, A.J., Falkowski, P.G., Letelier, R.M. & Boss, E.S. (2006). Climate-driven trends in contemporary ocean productivity. Nature 444, 752–755.
Bellerby, R.G.J., Schulz, K.G., Riebesell, U., Neill, C., Nondal, G., Heegaard, E., Johannessen, T. & Brown, K. R. (2008). Marine ecosystem community carbon and nutrient uptake stoichiometry under varying ocean acidification during the PeECE III experiment. Biogeosciences,5, 1517–1527
Bensoussan, N., Romano, J.C., Harmelin, J.G., Crisci, C., Pascual, J., Garrabou, J., (2009). Warming trends, regional fingerprints and future trajectories of NW Mediterranean coastal waters. In: RAC/SPA (Ed.), Proceedings of the 1st
Mediterranean Symposium on the Conservation of the Coralligenous and ther Calcareous Bio-concretions, Tabarka, Tunisia, pp. 166–167.
Borchard, C., Borges, A.V., Handel, N. & Engel, A. (2011). Biogeochemical response of Emiliania huxleyi (PML B92/11) to elevated CO2 and temperature
under phosphorous limitation: a chemostat study. Journal of Experimental Marine
Biology and Ecology, 410, 61–71
Burkhardt, S., Zondervan, I. & Riebesell U. (1999). Effect of CO2 concentration
on the C:N:P ratio in marine phytoplankton: a species comparison. Limnology and
Oceanography, 44, 683-90
Burkhardt, S., Amoroso, G., Riebesell, U. & Sultemeyer, D. (2001). CO2 and
HCO3- uptake in marine diatoms acclimated to different CO2 concentrations.
Limonlogy and Oceanography, 46,1378-91
Caldeira, K. & Wikett, M.E. (2003). Anthropogenic carbon and ocean pH.
Nature, 425, 365
Charalampopoulou, A., Poulton, A.J., Tyrrell, T., & Lucas, M.I. (2011). Irradiance and pH affect coccolithophore community composition on a transect between the North Sea and the Arctic Ocean, Marine Ecology Progresses Series,
431, 25–43
Cho, B.C. & Azam, F. (1988). Major role of bacteria in biogeo- chemical fluxes in the ocean's interior. Nature, 332, 441-443
Cole, J.J., Findlay, S. & Pace, M.L. (1988). Bacterial production in fresh and saltwater ecosystems: a cross-system overview, Marine Ecological Progresses
Series, 43, 1–10
Coma, R., Ribes, M., Serrano, E., Jimenez, E., Salat, J. & Pascual, J. (2009). Global warming-enhanced stratification and mass mortality events in the Mediterranean. Proceedings of the National Academy of Sciences of the United
De Bodt, C., Van Oostende, N., Harlay, J., Sabbe, K. & Chou, L. (2010). Individual and interacting effects of pCO2 and temperature on Hemiliana huxleyi
calcification: study of the calcite production, the coccolith morphology and the coccosphere size. Biogeosciences, 7, 1401 – 12
del Giorgio, P.A. & Duarte, C.M. (2002). Respiration in the open ocean. Nature,
420, 379–384.
Delille, B., Harlay, J., Zondervan, I., Jacquet S., Chou, L., Wollast, R., Bellerby R.G.J., Frankignoulle M., Borges, A.V., Riebesell, U. & Gattuso, J.P. (2005). Response of primary production and calcification to changes of pCO2 during
experimental blooms of the coccolithophorid Emiliana huxleyi. Global
Biogeochemical Cycles, 19, GB2023.
Dickson,A.G., Savine, C.L., & Christian, J.R. (2007) Eds. Guide to best practices for ocean CO2 measurements. PICES Special Publication, 3, 1-191
Doney, S.C. (2006). Oceanography – plankton in a warmer world. Nature 444, 695–696.
Ducklow, H.W. & Carlson, C.A. (1992). Oceanic bacterial production. Advances
in Microbial Ecology, 12, 113– 181
Egge, J.K., Thingstad, T.F., Engel, A., Bellerby, R.G.J. & Riebesell, U. (2009). Primary production during nutrient-induced blooms at elevated CO2
concentrations. Biogeosciences, 6, 877-85
Engel, A. (2000). The role of transparent exopolymer particles (TEP) in the increase in apparent particles stickiness (α) during the decline of a diatom bloom.
Journal of Plankton Research, 22, 485 – 497
Engel, A. (2002). Direct relationship between CO2 uptake and transparent
exopolymer particles production in natural phytoplankton. Journal of Plankton
Research, 24, 49-53
Engel, A., Thoms, S., Riebesell, U., Rochelle-Newall, E. & Zondervan, I. (2004). Polysaccharide aggregation as a potential sink of marine dissolved organic carbon. Nature, 428, 929 - 32
Engel, A., Borchard, C., Piontek, J., Schulz, K., Riebesell, U. & Bellerby R. (2012). CO2 increases 14C-primary production in an Artic plankton community.
Biogeosciences Discussions, 9, 10285-10330, doi:10.5194/bgd-9-10285-2012
Field, C.B., Behrenfeld, M.J., Randerson, J.T., & Falkowski, P. (1998). Primary production of the biosphere: integrating terrestrial and oceanic components,
Science, 281, 237–240
Fu, F.X., Mulholland, M.R., Garcia, N.S. et al. (2008a). Interactions between changing pCO2, N2 fixation, and Fe limitation in the marine unicellular
cyanobacterium Crocosphera. Limnology and Oceanography, 53, 2472 - 84
Gattuso, J.P. & Lavigne H. (2009). Technical note approaches and software tools to investigate the impact of ocean acidification. Biogeosciences, 6, 2121-2133 Gattuso, J.P. & Hansson, L. (2011). Ocean acidification: background and history. In: Gattuso, J.P. & Hansson, L. (Eds). Ocean Acidification, Oxford University
Press
Gervais, F. & Riebesell, U. (2001). Effect of phosphorus limitation on elemental composition and stable carbon isotope fractionation in a marine diatom growing under different CO2 concentrations. Limnology and Oceanography, 46, 497 - 504
Giordano, M., Beardall, J. & Raven, J.A. (2005). CO2 concentrating mechanisms
in algae: mechanisms, environmental modulation, and evolution. Annual Review
of Ecology and Sistematics, 29, 503-41
Grasshoff, K., Kremling, K. & Ehrhardt, M. (1999). Methods of Seawater
Analysis. Wiley-VCH, 3 edition, 632
Grossart, H.P., Allgaier, M., Passow, U. & Riebesell, U. (2006) Testing the effect of CO2 concentration on the dynamics of marine heterotrophic bacterioplankton.
Limnology and Oceanography, 51, 1– 11
Hein, M. & Sand-Jensen, K. (1997). CO2 increase oceanic primary production.
Hendriks, I.E., Duarte, C.M. & Alvarez, M. (2010). Vulnerability of marine biodiversity to ocean acidification: a meta-analysis. Estuarine, Coastal and Shelf
Science, 86, 157–164
IPCC(2007). Climate Change 2007: The Physical Science Basis. Contribution of
Working group I to the Fourth Assessment Report of the Intergovernmental Panel on Climate Change (eds Solomon, S., Qin, D., Manning, M., Chen, Z., Marquis,
M., Averyt, K.B., Tignor, M. & Miller, H.I.). Cambridge University Press
Knap,A.H., Michaels, A.E., Close, A., Ducklow, H.W. & Dickson, A.G. (1996). Protocols for the Joing Global Ocean Flux Study (JGOFS) core measurements.
JGOFS Report, 19.
Kranz, S.A., Sultemeyer, D., Ritcher, K.U. & Rost, B. (2009). Carbon acquisition by Trichodesmium: the effect of pCO2 and diurnal changes. Limnology and
Oceanography, 54, 548 - 59
Kroeker, K.J., Micheli, F., Gambi, M.C. & Martz, T.R. (2011). Divergent ecosystem responses within a benthic marine community to ocean acidification,
Proceeding of the National Academy of Sciences, 108,14515–14520
Langer,G., Geisen, M., Baumann, K., Klas, J., Riebesell, U., Thoms, S. & Young, J.R. (2006). Species-specific response of calcifying algae to changing seawater carbonate chemistry. Geochemistry, Geophysics, Geosystems, 7, Q09006
Leonardos,N. & Geider, R.J. (2005). Elevated atmospheric CO2 increases organic
carbon fixation by Emiliana huxleyi (Haptophyta) under nutrient-limited, high-light conditions. Journal of Phycology, 41, 1196-203
Levitan, O., Rosenberg, G., Stlik, I. et al. (2007). Elevated CO2 enhances nitrogen
fixation and growth in the marine cyanobacterium Trichodesmium. Global
Change Biology, 13, 531- 8
Le Quéré, C., Raupach, M.R., Canadell, J.G. et al.(2009). Trends in the sources and sinks of carbon dioxide. Nature Geoscience, 2, 831-836
Liu, J.W., Weinbauer, M.G., Maier, C., Dai, M. H. & Gattuso, J.P. (2010). Effect of ocean acidification on microbial diversity and on microbe-driven biogeochemistry and ecosystem functioning,Aquatic Microbial Ecology, 61, 291– 305
Logan, B.E., Passow, U., Alldredge, A.L., Grossart, H.P. & Simon, M. (1995). Rapid formation and sedimentation of large aggregates is predictable from coagulation rates (half-lives) of transparent exopolymer particles (TEP).
Deep-Sea Research II, 42, 203–214
Lohbeck, K.T., Riebesell, U. & Reusch, T.B.H. (2012). Adaptive evolution of a key phytoplankton species to ocean acidification. Nature Geoscience, 5 (5) 346– 351.
Lorrain, A., Savoye, N., Chauvaud, L.,Paulet, Y .M. & Naulet, N. (2003). Decarbonation and preservation method for the analysis of organic C and N contents and stable isotope ratio of low-carbonated suspended particulate material.
Analytica Chimica Acta, 491, 125-133
Luthi,D., Le Floch, M., Bereiter, B., Blunier, T., Barnola, J.M., Siegenthaler, U., Raynaud, D., Jouzel, J., Fischer, H., Kawamura, K. & Stocker, T. F. (2008). High-resolution carbon dioxide concentration record 650,000-800,000 years before present. Nature, 453, 379-382
Muller, M.N., Schulz, K.G. & Riebesell, U. (2010). Effects on long-term high CO2 exposure on two species of coccolithophores. Biogeosciences, 7, 1109 - 16
Pella E. & Colombo B. (1973). Study of carbon, hydrogen and nitrogen determination by combustion-gas chromatography. Mikrochimoca Acta, 5, 697-719
Raven, J.A. & Johnston, A.M. (1991). Mechanisms of inorganic-carbon acquisition in marine phytoplankton and their implications for the use of other resources. Limnology and Oceanography, 36, 1701-14
Reinfelder, J.R. (2011). Carbon Concentrating Mechanisms in Eukaryotic Marine Phytoplankton. Annual Review of Marine Science, 3 (1), 291–315.
Riebesell, U., Zondervan, I., Rost, B., Tortell, P.D., Zeebe, R.E. & Morel, F.M.M. (2000). Reduced calcification of marine plankton in response to increased atmospheric CO2. Nature, 407 (20), 364–367.
Riebesell,U., Schulz, K.G., Bellerby, R.G. J., Fritsche, P., Meyerhofer, M., Neill, C., Nondal, G., Oschlies, A., Wohlers, J. & Zollner, E. (2007). Enhanced biological carbon consumption in ahigh CO2 ocean. Nature, 450, 545–548
Riebesell, U., Bellerby, R.G.J., Grossart, H.P. & Thingstad, F. (2008). Mesocosm CO2 perturbation studies: from organism to community level. Biogeosciences, 5,
4, 1157–1164.
Riebesell, U., Körtzinger, A. & Oschlies, A. (2009). Sensitivities of marine carbon fluxes to ocean change. Proceedings of the National Academy of Sciences of the
United States of America, 106, 49, 20602–9
Riebesell, U. & Tortell, D.P. (2011). Effects of ocean acidification on pelagic organisms and ecosystems. In: Gattuso, J. P. & Hansson L. (eds) Ocean
Acidification. Oxford University Press.
Riebesell, U., Czerny, J., von Brockel, K., Boxhammer, T., Budenbender, J., Deckelnick, M., Fischer, M., Hoffmann, D., Krug, S.A., Lentz, U., Ludwig, U., Muche, R. & Schulz, K.G. (2012). Technical Note: A mobile sea-going mesocosm system – new opportunities for ocean change research. Biogeosciences, 9, 12985 – 13017, doi:10.5194/bgd-9-12985-2012
Rost,B., Riebesell, U., Burkhardt, S. & Sultemeyer, D. (2003). Carbon acquisition of bloom- forming marine phytoplankton. Limnology and Oceanography, 47, 120-128
Rost, B., Richter, K.U., Riebesell U. & Hansen, P.J. (2006). Inorganic carbon acquisition in red-tide dinoflagellates. Plant cell and environment, 29, 810 - 22 Rost,B., Zondervan, I. & Wolf-Gladrow, D. (2008). Sensitivity of phytoplankton to future changes in ocean carbonate chemistry: current knowledge, contradictions and research directions. Marine Ecology Progress Series, 373, 227-237
Sciandra, A., Harlay, J., Lefèvre, D., Lemee, R., Rimmelin, P., Denis, M., Gattuso, J.P. (2003). Response of coccolithophorid Emiliana huxleyi to elevated partial pressure of CO2 under nitrogen limitation. Marine Ecology Progress
Series, 261, 111-22
Schippers, P., Luriling, M. & Scheffer, M. (2004). Increase of atmospheric CO2
promotes phytoplankton productivity. Ecology Letters, 7, 446–451
Schulz, K.G., Riebesell, U., Bellerby, R.G.J. et al. (2008). Build-up and decline of organic matter during PeECE III. Biogeosciences, 5, 707 - 18
Schulz, K.G., Bellerby, R.G.J., Brussaard, C.P.D. et al. (2012). Temporal biomass dynamics of an Arctic plankton bloom in response to increasing levels of atmospheric carbon dioxide. Biogeosciences, 9, 12543–12592
Sharp, J.H. (1974). Improved analysis for “particulate” organic carbon and nitrogen from seawater. Limnology and Oceanography, 19, 6, 984-989
Silyakova, A., Bellerby, R.G.J., Czerny, J., Schilz, K.G., Nondal, G., Tanaka, T., Engel, A., De Lange, T. & Riebesell, U. (2012). Net community production and stoichiometry of nutrient consumption in a pelagic ecosystm of a northern high latitude fjord: mesocosm CO2 perturbation study. Biogeosciences Discuss, 9,
11705-3, doi:10.5194/bgd-9-11705-2012
Simon, M., Grossart, H.P,. Ploug, H. & Schweitzer, B. (2002). Microbial ecology of detrital aggregates in aquatic ecosystems. Aquatic. Microbiology Ecology, 28. 175-211.
Strickland,J.D. & Parsons, T.R. (1972). A pratical handbook of seawater analysis.
Bulletin of the Fisheries Research Board of Canada, 167
Tanaka, T., Thingstad, T.F., Lovdal, T. et al. (2008). Availability of phosphate for phytoplankton and bacteria and of glucose for bacteria at different pCO2 levels in
Tanaka, T., Alliouane, S., Bellerby, R.G.J., Czerny, J., de Kluljver, A., Riebesell, U., Schulz, K.G., Silyakova, A. & Gattuso, J.P. (2012). Metabolic balance of a plankton community in a pelagic water of a northern high latitude fjord in respose to increased pCO2. Biogeosciences Discussions, 9, 11013-39,
doi:10.5194/bgd-9-11013-2012
Thingstad, T.F. & Rassoulzadegan, F. (1995). Nutrient limitations, microbial food webs, and biological c-pumps: suggested interactions in a P-limited Mediterranean. Marine Ecology Progress Series 117, 299–306
Tortell, P.D., DiTullio, G.R., Sigman, D.M. & Morel, F.M.M. (2002). CO2 effects
on taxonomic composition and nutrient utilization in an Equatorial Pacific phytoplankton assemblage. Marine Ecology Progresses Series, 236, 37-43
Touratier, F. & Goyet, C. (2011). Impact of the Eastern Mediterranean Transient on the distribution of anthropogenic CO2 and first estimate of acidification for the
Mediterranean Sea. Deep Sea Research Part I 58, 1–15
Weinbauer, M.G., Mari, X. & Gattuso, J.P. (2011). Effects of ocean acidification on the diversity and activity of heterotrophic marine microrganisms. In: Gattuso, J.P. & Hansson, L. (Eds). Ocean Acidification, Oxford University Press
Winkler, L.W. (1888). Die Bestimmung des im Wasser gelosten Sauerstoffes.
Chemische Berichte, 21, 2843-2855
Wu, Y., Gao, K. & Riebesell U. (2010). CO2-induced seawater acidification
affects physiological performance of the marine diatom Phaeodactylum
tricornutum. Biogeosciences, 7, 2915 - 23
Zeebe, R.E. & Wolf-Gladrow, D.A. (2001). CO2 in seawater: equilibrium,
kinetics, isotopes. Elsevier, Amsterdam.
Zondervan, I., Zeebe, R.E., Rost, B. & Riebesell, U. (2001). Decreasing marine biogenic calcification: A negative feedback on rising atmospheric pCO2, Global
6.
AKNOWLEDGEMENTS
This work is a contribution to the “Mediterranean Sea Acidification in a changing climate” (MedSeA) project. We want to thank the University of Bologna for participation on this project, in particular prof. Rossella Pistocchi for revisions. We thank the entire Laboratoire Océanologique de Villefranche Sur Mer – Marine Microbial Ecology and Biogeochemistry staff, in particular dr. Frédéric Gazeau for the experimental organization and helpful revisions on this work. A special thank is for the Station de Recherches Sous–Marines et Océanographiques of Stareso, Calvi (France) for availability of scientific station and laboratories. We want also thank the Istituto Nazionale di Oceanografia e di Geofisica Sperimentale di Trieste– Oceanografia fisica, chimica e biologica, in particular dr. Paola del Negro, dr. Michele Giani and dr. Cinzia Comici for the access to laboratories and assistance during the analysis.
Finally, we thank all participants to Stareso experiment, the LOV team, the “Winkler party” staff (particularly dr. Martina Sailerová), dr. Francesca Iuculano and mrs. Raquel Gutierrez (IMEDEA) for the beautiful funny analysis nights, dr. Mauro Celussi and dr. Cinzia Fabbro (OGS) for helpful suggestions, the Greek group (HCMR), dr. Louisa Giannoudi, dr. Aggeliki Kostantinopoulou, dr. Anastasia Tsiola for Winkler technique, samplings and entertainment, english researchers (PML), dr. Lisa Al-Moosawi, dr. Andy Rees (the fisherman!), dr. Denise Cummings, and Stareso students. Last but not least thanks to the colleagues of Marine Biology and Environmental Sciences courses in Ravenna.