Alma Mater Studiorum - Università di Bologna
SCUOLA DI SCIENZE
Dipartimento di Chimica Industriale“Toso Montanari”
Corso di Laurea Magistrale in
Chimica Industriale
Classe LM-71 - Scienze e Tecnologie della Chimica Industriale
Crystallization and morphology of the PLLA phase
within random poly (L-lactide-ran-ε-caprolactone)
Tesi di laurea sperimentale
CANDIDATO
Simone FaillaRELATORE
Chiar.mo Prof. Daniele CarettiCORRELATORE
Prof. Alejandro J. Müller
Dott. Matteo Rizzuto
Sessione ll
___________________________________________________________________________________________________________
Anno Accademico 2013-2014
2
ABSTRACT
This work has mainly focused on the poly (L-lactide) (PLLA) which is a material for multiple applications with performances comparable to those of petrochemical polymers (PP, PS, PET, etc. ...), readily recyclable and also compostable. However, PLLA has certain shortcomings that limit its applications. It is a brittle, hard polymer with a very low elongation at break, hydrophobic, exhibits low crystallization kinetics and takes a long time to degrade. The properties of PLLA may be modified by copolymerization (random, block, and graft) of L-lactide monomers with other co-monomers. In this thesis it has been studied the crystallization and morphology of random copolymers poly (L-lactide-ran-ε-caprolactone) with different compositions of the two monomers since the physical, mechanical, optical and chemical properties of a material depend on this behavior. Thermal analyses were performed by differential scanning calorimetry (DSC) and thermogravimetry (TGA) to observe behaviors due to the different compositions of the copolymers. The crystallization kinetics and morphology of poly (L-lactide-ran-ε-caprolactone) was investigated by polarized light optical microscopy (PLOM) and differential scanning calorimetry (DSC). Their thermal behavior was observed with crystallization from melt. It was observed that with increasing amounts of PCL in the copolymer, there is a decrease of the thermal degradation. Studies on the crystallization kinetics have shown that small quantities of PCL in the copolymer increases the overall crystallization kinetics and the crystal growth rate which decreases with higer quantities of PCL.
Keywords: random copolymers, overall crystallization rate, crystal growth rate, isothermal crystallization kinetics, poly (L-lactide).
4
CONTENTS
ABBREVIATIONS USED IN THE THESIS ... 5
1. INTRODUCTION ... 6
1.1 Crystallization of polymers ... 7
1.2 Crystallization kinetic ... 9
1.2.1 Avrami theory ... 11
1.2.2 Lauritzen Hoffman theory ... 13
1.3 Ring-Opening Polymerization (ROP) ... 15
1.4 Poly (lactic acid) ... 16
1.5 Poly(ε-caprolactone) PCL ... 19
2. OBJECTIVE OF THE THESIS ... 21
3. RESULTS AND DISCUSSION ... 22
3.1 Copolymers synthesis ... 22
3.2 Standard or non-isothermal DSC ... 24
3.3 TGA analysis ... 30
3.4 Spherulitic growth ... 34
3.5 Overall isothermal crystallization kinetics ... 43
4. CONCLUSIONS ... 55
5. EXPERIMENTAL SECTION ... 56
5.1 Process for the synthesis of random copolymers poly (lactide-ran-ε-caprolactone) ... 56
5.2 Gel permeation chromatography (GPC) ... 57
5.3 Hydrogen-1 nuclear magnetic resonance (1H-NMR) ... 58
5.4 TGA analysis ... 58
5.5 Polarized Light optical microscopy (PLOM) ... 59
5.6 Differential scanning calorimetry (DSC) ... 60
5
ABBREVIATIONS USED IN THE THESIS
LA = racemic lactideLLA = L-lactide isomer
CL = ε-caprolactone
PLA = poly (lactide)
PLLA = poly (L-lactide)
PDLA = poly (D-lactide)
PCL = poly (ε-caprolactone)
%molPLA / %molPCL = Copolymer poly (lactide-ran-ε-caprolactone)
%molPLLA / %molPCL = Copolymer poly (L-lactide-ran-ε-caprolactone)
PLOM = Polarized Light Optical Microscope
DSC = Differential Scanning Calorimetry
TGA = Thermal Gravimetric Analysis
GPC = Gel Permeation Chromatography
1
H-NMR = Hydrogen-1 Nuclear Magnetic Resonance
Tm = melting temperature
Tm0 = equilibrium melting temperature
Tc = crystallization temperature
6
1. INTRODUCTION
It's important to remember that in recent years, the research of new polymeric materials has suffered significant boost as a result of the need to provide solutions to the serious problems of environmental impact caused by improper use of the plastics material that it was made in past. This has brought to a reevaluation of the polymers, having both natural and synthetic origin, and in particular of aliphatic polyester, which, among others present two particularly important properties: biodegradability and biocompatibility. Biopolymers are classified according to the "European Bioplastics Association" as biodegradable polymers approved compostable according to EN 13432 that come from both renewable and non-renewable sources. Additionally polymers from renewable sources can be either biodegradable or not biodegradable [1].
This work has mainly focused on the poly (L-lactide) (PLLA) which is a material with multiple applications with performances comparable to those of petrochemical polymers (PP, PS, PET, etc. ...) and is readily recyclable with several techniques (mechanical, chemical) and also compostable. Thanks to these characteristics is considered a good candidate for the partial replacement of some thermoplastic products. It has, however, critical points, which can create limitations in its use in technological and commercial applications. Indeeed he has poor heat resistance, poor mechanical properties at room temperature (brittleness), low elongation at break and low crystallization kinetics which is reflected in the slowing of the molding cycle and high fragility. [2,3] The problem can be overcome by adopting strategies such as to identify new ways for the synthesis, but also to chemically and/or physically modify polymers already available on the market (copolymerization and reactive blending).
The technique used in this thesis, trying to improve the properties of PLLA, was the synthesis via ring-opening polymerization (ROP) of the L-lactide monomer and ε-caprolactone monomer, in the presence of catalyst tin Octoate [Sn(Oct)2] in order to
synthesize random copolymers.
The strategy of the copolymerization has significant advantages, since it is normally difficult that a homopolymer can satisfy a wide range of requirements; for example, not always a homopolymer characterized by good mechanical properties is easily workable, or show good resistance to chemical and physical agents. In addition, every directed
7 effort towards the improvement of a specific property, in the process of synthesis or processing, can effect the optimization of other characteristics, with consequent limitations in the use of the same product. In this context, the copolymerization is particularly efficient since it allows to not significantly alter the already good properties of the starting homopolymer, and at the same time to improve those not satisfactory. A further advantage of this approach is the ability to produce a range of materials which properties are also completely different from those of starting homopolymers; finally, since the properties of the copolymers vary with the composition, they can be easily and quickly modified to meet the demands imposed by the type of use.
The final aim of this thesis is to perform the thermal analysis on random copolymers containing different percentages of ε-caprolactone monomer and observe how the morphological structure varies and the ability to crystallize of these products since the physical, mechanical, optical and chemical properties of a material depend on this behavior. The thermal analyses were performed by differential scanning calorimetry (DSC) and thermogravimetric (TGA) to observe behaviors due to the different compositions of the copolymers. Polarized light optical microscopy (PLOM) was used to observe the morphology of the crystalline areas and to calculate the spherulitic growth rate of them (secondary nucleation). The overall crystallization kinetics (nucleation + growth) was finally studied by isothermal DSC.
1.1 Crystallization of polymers
Polymers constitute a class of special materials regard their ability to crystallize. The requirements of constitutional and configurational regularity, that must be satisfied to allow the macromolecules to organize into a crystalline structure, are partially present in the polymer chains. The need to tie together a very high number of repeating units it's very improbable because it’s practically impossible to obtaining macromolecules absolutely devoid of constitutional and configurational defects. Electron microscopy and the pattern of low angle X-ray show that the fundamental crystalline units of the polymeric materials are the lamellae whose thickness is of the order of a few hundred Angstroms. In such crystals, the macromolecule, which is much longer than the thickness of the lamellae, is folded back on itself several times and forms a crystal in which a heart of high crystallinity is confined between two disordered regions which are present in the
8 folds of the chains and contain the greater part of the constitutional and configurational defects. The lamellae are the building blocks from which more complex structures are obtained by cooling from the molten state crystallizable polymers: the spherulites. These are polycrystalline structures of optically anisotropic spherical symmetry, which exhibit the phenomenon of birefringence. They show the characteristic Maltese cross when viewed with a polarized light optical microscope. Inside the spherulites there is a more or less complex arrangement of lamellar crystals, separated by disordered regions, in which the conformations are similar to those assumed by the chains in the amorphous state, and connected between them by several chains (entaglements) that possess repeat units in at least two adjacent lamellae [4].
The crystallization is a process in which an ordered structure is produced from a disordered phase, generally a molten or solution, while the fusion can be considered a process essentially opposite [5].The crystallization process occurs in a temperature range characteristic of each polymer. It can extend from about 30°C above the glass transition temperature (Tg) at about 10°C below the melting point (Tm) [6]. These values were determined because over Tm, the macromolecular structure has a high mobility that facilitates the movement of the chains losing the ordered structure. At temperatures below the Tg the high viscosity does not allow the movement of macromolecules and thus to achieve an ordered structure.
The development of the crystalline phase requires two consecutive processes: the formation of nuclei (primary crystallization) in the amorphous phase and their growth (secondary crystallization) in which there is the formation of stable nuclei on the surface of the growing crystal and their subsequent development. The rate of crystallization increases when achieve certain values of supercooling (ΔT = Tm0 - Tc). Nucleation can be divided into homogeneous nucleation and heterogeneous one, the former being the sporadic formation of critical nuclei from the pure phase, the latter occurring at the surface of impurities within the system [7]. Taking into consideration the time scale in which the nucleation process occurs, this can be classified as:
Instantaneous when there are many spherulites of small size due to the formation of many nuclei in the same instant. It is obtained to high supercooling where the nucleation rate is greater than the growth rate of the crystals.
9 Sporadic when the growth rate is higher than the nucleation rate. In this case a
few large spherulites can be observed using low values of supercooling. [8]
1.2 Crystallization kinetic
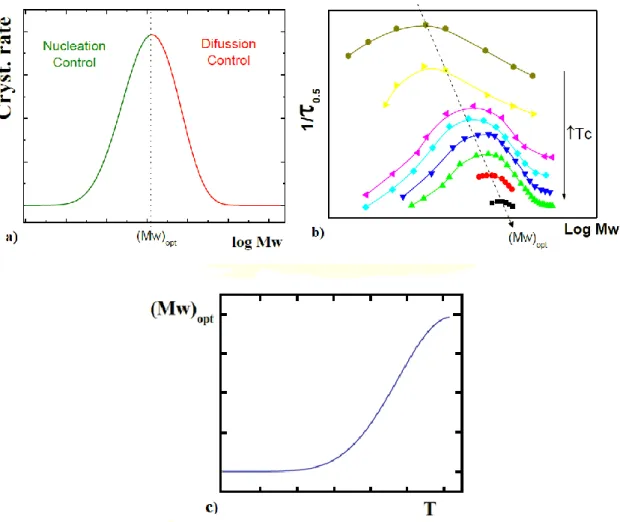
The trend of the nucleation rate (I) and crystalline growth (G) with the temperature, which is generally of a bell-shaped is shown in Figure 1.1, delimited at low temperature from the glass transition temperature (below that the molecules are immobilized) and high temperature from the fusion.
Figure 1.1 Temperature dependence of the nucleus formation rate and the crystallite growth rate on cooling from the melt. [9]
The trend of the crystallization growth rate depends only on the temperature of crystallization, instead of the nucleation rate which depends on various conditions such as the cooling rate from the molten state.
The overall crystallization rate is given by the sum of the two rate (I) and (G) as can been seen in Figure 1.2. At temperatures near to the melting, crystallization rate is very low and the process is controlled by the nucleation, which is hindered at high temperatures. Lowering the temperature, the crystallization rate increases gradually and returns to
10 decrease when the crystallization is controlled by diffusion, which is hindered at low temperature.
Figure 1.2 Crystallization rate vs. crystallization temperature
The nucleation rate and the crystal growth rate are also influenced by the molecular weight, presenting opposing trends. The nucleation rate increases with the molecular weight because the nuclei being to achieve a stable dimension need some length of chain. Opposite case occurs with the crystal growth rate because high values of molecular weights slow down the diffusional processes.
The overall crystallization rate as a function of the molecular weight, shows a bell-shaped trend. From the image in Figure 1.3 it is possible to see that there is an optimal mass (Mw)opt permitting to obtain a maximum speed of crystallization by setting a
11
Figure 1.3 a) Overall crystallization rate vs the mass logarithm at T = const. b) The overall crystallization rate (1/τ0.5) vs. the mass logarithm for different temperatures. c) Trend of the optimal
molecular weight (Mw)opt with temperature[10]
The optimum molecular weight increases with temperature. Chain diffusion and chain nucleation are both a function of chain lenght. Plotting, in Figure 1.3c, the (Mw)opt versus
the temperature, is possible to observe this characteristic trend [10].
1.2.1 Avrami theory
The kinetics crystallization analysis of the polymer may be accomplished using various techniques and various models. The usual procedure in the study of the crystallization rate is to quickly cool the polymer sample from the molten state to the measurement temperature and thus measure the development of crystallinity at constant temperature (isothermal crystallization). The Avrami model was used to see how different is the trend of the overall crystallization rate under isothermal conditions of the copolymers within
12 this thesis. According to Avrami, the progress of the isothermal crystallization can be expressed by the equation [6]:
Equation (1) Where Vc is the crystalline volume fraction, k is the constant rate of the overall crystallization, t0 is the induction time, n is the Avrami index that assumes different
values depending on the type of geometry of crystal growth and the type of nucleation The growth leads to a contribution of 1, 2, 3 (ng), depending on whether one, two or
three-dimensional growth occurs; nucleation brings a contribution of 0 or 1 (nn)
depending on whether instantaneous or sporadic is. The sum of these two contributions gives the number of Avrami index n. To calculate Vc, can be used the following equation:
Equation (2)
Since Wc is the mass fraction of crystalline, ρc the material 100% crystalline density and ρa the material 100% amorphous density. While Wc is calculated from:
Equation (3)
Where ΔH(t) corresponds to the enthalpy of crystallization as a function of the
crystallization time and ΔHTOT is the maximum crystallization enthalpy of the material.
Applying the logarithmic properties on both sides of the equation (1), the following equation can be obtained:
Equation (4) Plotting as a function of the values of k and n can be obtained. A very important value in the Avrami’s theory is the time required by the material to reach the value of 50% of crystallization and can be indicated as or
. It is possible to calculate it through this equation: [6]
13
1.2.2 Lauritzen Hoffman theory
This theory allows to calculate the overall crystallization rate (1/τ1/2 (50%)) or the crystal
growth rate (G) to a crystallization temperature (Tc). Is possible to obtain the following general formula: [11, 12]
Equation (6)
The value of A can be replaced with or (G) according to the type of kinetics that we want to study, Kg is the nucleation constant, Tc is the crystallization temperature, ΔT is the supercooling (Tm0
-Tc) where Tm0 is the equilibrium melting temperature and corresponds to the melting temperature of an infinite stack of extended chain crystals without defects, f is a correction factor that is:
Equation (7) U* is the activation energy for transportation of segments to the crystallization site, R is the gas constant, T∞ is the hypothetical temperature where all motion are locked and A0
is a rate constant ((1 / τ50%) or (G)0 [11-12].
The crystal growth rate (G) is governed by two important processes that are a function of the rate (i) at which the nuclei are formed and the rate (g) at which the nuclei spread on the surface of the crystal. Depending on which of the two rate is higher, we can be in three types of different crystallization regimes ; I, II, III.
The regime I is when the nucleation rate (i) is very small compared to the rate of (g) (i << g). The whole substrate is completed and covered by a new monolayer. Following this mechanism monolayers are added one by one.
The regime II is when the nucleation rate (i) is high and spreads slowly or at the same rate (g) (i ≈ g). In this regime nucleation takes place more before the completion of a layer. This regime has medium temperatures crystallization.
The regime III is when the nucleation rate (i) is higher than the speed (g) (i >> g). It has an increase in the formation of the nuclei during the formation of new layers. This regime is obtained at low temperatures of crystallization.
14 Figure 1.4 shows the three regimes.
Figure 1.4 Schematic drawings of how polymer crystal growth takes place in three regimes: (a) regime I; (b) regime II; and (c) regime III [13].
Plots of as a function consist of lines with relatively abrupt changes in the slope coefficients shown in Figure 1.5. The regions of linear behavior are denoted regimes. [13]
15 The nucleation constant Kg depends on the regime of crystallization and is given by the following formula:
Equation (8) Where b is the layer thickness, σs is the lateral surface free energy, σe is the folding
surface free energy, ΔH is the heat of fusion per unit volume, and k is the Boltzmann constant. The value of n is depended on the regime of crystallization, and it is theoretically given as 4, 2, and 4 for regime I, II, and III, respectively [12]. σs can be
obtained from the equation :
Equation (9) Where a0 is the chain length and b0 is the width of the chain. Another parameter that can
be determined with the theory of Lauritzen-Hoffman is q, which is the work required to make a bend and is obtained by the following expression:
Equation (10)
1.3 Ring-Opening Polymerization (ROP)
Polymer with the general structure of macromolecular chain can be prepared from cyclic monomers via ring-opening polymerization (ROP). Additionally, ring-opening polymerization can be used to prepare polymer, which cannot easily be prepared by other methods, e.g. poly(phospazene)s. The driving force for ring-opening polymerization of cyclic monomers is the relief of bond-angle strain and/or steric repulsions between atoms crowded into the center of the ring. Therefore, as for other types of polymerization, the entalpy change for ring-opening polymerization is negative. Relief of bond-angle strain is most important for 3 and 4 membered rings, whereas for 8 to 11 memberead rings it is the relief of steric crowding that matters. These enthalpic effects are much smaller for five, six, and seven membered rings (especially six-membered) and such monomers are more difficult to polymerize. Ring-opening polymerization requires an initiator and in most cases proceeds by chain mechanism which most commonly involved sequential additions of monomer to cationic or anionic active centres. However, there are more
16 specialized ring-opening polymerizations which operate by non-ionic mechanism, e.g. via radical or coordination mechanism. In addition, some ring-opening polymerizations have complex mechanism in which the ring opens to give a monomer that undergoes polycondensation. Hence the precise mechanism of ring-opening polymerization depends greatly upon the initiator, monomer and polymerization condition. For this reason, it is not possible to treat generally the ring-opening polymerization of all cyclic monomers [14].
1.4 Poly (lactic acid)
Poly (lactic acid) (PLA) is one of the most promising biodegradable and biocompatible polymers obtained from renewable resources. The process is accomplished starting from starch, that is converted into glucose by enzymatic hydrolysis. Subsequently microorganisms break down the sugar into lactic acid through a fermentation process [15]. The synthesis of PLA from lactic acid can follow two ways: indirect through the lactide, which produces the "polylactide", and one that provides direct polymerization via polycondensation, which gives the "poly-lactic acid". The first way requires that it obtained a pre-polymer of low molecular weight by condensation of lactic acid in aqueous solution. The pre-polymer is then depolymerized to form the lactide (cyclic dimer of lactic acid), which polymerizes by ring-opening polymerization (ROP). The second case involves the direct conversion of lactic acid in the PLA. This occurs through polycondensation, is an equilibrium reaction and is difficult to remove completely the water which can limit the molecular weight due to hydrolysis of the ester bonds. Figure 1.6 shows the two methods [16].
17 HO OH O Condensation -H2O HO O O O O OH O n Depolymerization Prepolimer 5000 g/mol O O O O HO O O O O OH O n Ring-opening polymerization
Lactic acid High molecular weight PLA
Lactide Polycondensation
Figure 1.6 PLA production via prepolymer and lactide.
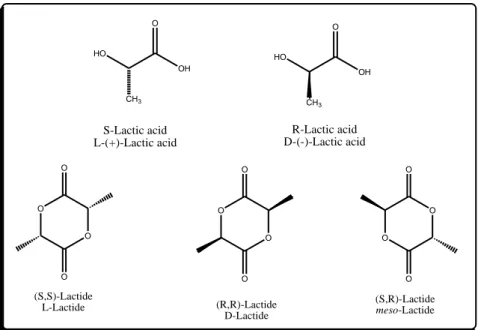
There are two optically active isomers of lactic acid, L-and D- isomer. The lactide molecule contains two stereogenic atoms and in the case three possible stereoisomers are possible. Figure 1.7 shows all isomers.
HO OH O CH3 HO OH O CH3 O O O O O O O O O O O O S-Lactic acid L-(+)-Lactic acid R-Lactic acid D-(-)-Lactic acid (S,S)-Lactide L-Lactide (R,R)-Lactide D-Lactide (S,R)-Lactide meso-Lactide .
18 Processing, crystallization, and degradation behavior of PLA all depend on the ratio between the isomer L and D. Their existence is due to the carbon bonded to four different substituents (chiral carbon). Both isomers give rise to four morphologically different polymers: PLLA and PDLA which are stereoregular polymers, the racemic PDLLA that due to the random distribution of the isomers in the macromolecular chains is an amorphous polymer, and in the end the PLA-meso that is obtained from DL-lactide. In the work of Stanford et. al. [17] thestereocontrolled ROP of L- rac- and meso-lactide can result ina wide range of polymer structures (Figure 1.8).
Figure 1.8 Synthesis of different kind of PLAs by ROP [18]
Isotactic PLLA homopolymer, deriving from L-lactide, is a semi-crystalline material with the highest melting point, while PLA copolymers with higher D-isomer content exhibit lower melting points and dramatically decreasing crystallization behavior, until they finally become amorphous at D-contents higher than 12–15% [19].
PLA has a glass transition temperature relatively low (approximately 60°C) and a melting temperature of about 160-180°C. Because of the low softening temperature, the PLA, unlike PET, is not suitable to contain liquids (or other) hot. The low softening
19 temperature of this polymer also creates problems for the storage of products and in the manufacturing of applications for the automotive sector [1]. One of the major technological obstacles to the diffusion of the PLA in the packaging industry is the high fragility accompanied by a low flexibility.
The most common approaches to increase the toughness of the PLA reported in literature are the copolymerization with monomers such as ε-caprolactone and ethylene oxide or its blending [20] with other polymers such as PCL, PEG, EVA [21,22].
1.5 Poly(ε-caprolactone) PCL
Biodegradable polymers can be classified into different categories, depending on their origin (natural or synthetic) or chemical structure. In this work, we have used the PCL, a biodegradable polyester, member of a family where members characteristic are "PLA, PCL, PGA (Poly-glycolic acid), PHA (poly-hidroxyalcanoates), PHB (poly-hydroxy-butirate), PHV (poly-hidroxivalerate), PDO poly (dioxanone), PEA (polyestereamide)". These materials are of great interest in the field of biomaterials, due to the fact that the ester group can be hydrolytically degraded.
These biodegradable polyesters are used in the medical field as sutures [23] or for the packaging [24].
The PCL is obtained by ring-opening polymerization of ε-caprolactone. Although the raw material used for its preparation does not come from renewable sources, but from a petroleum derivative, the PCL is a fully biodegradable material, because of the ester bond, present in its structure, likely to be hydrolyzed [25].
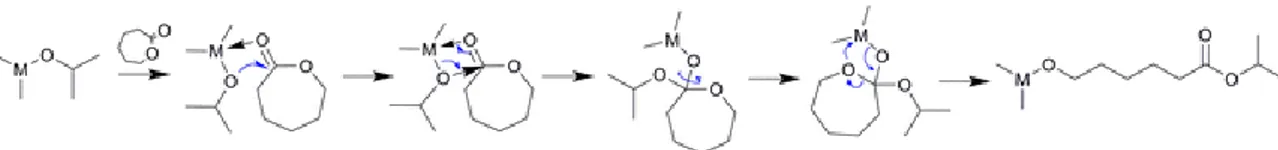
The polymerization starts normally from nucleophilic species such as alcohol and in the presence or absence of catalysts. The catalysts most used are organometallic compounds like tin or zinc derivatives, which react in situ with the alcohol, giving rise to alkoxides which are the species responsible for the polymerization of the monomer according to a mechanism of coordination-insertion (see Figure 1.9) [26].
20
Figure 1.9 Mechanism of the initiation step for coordination–insertion ROP, adapted from Khanna et al. [27] and Stridsberg et al. [28]
The polymer has a regular structure and is semi-crystalline. The PCL crystallizes at around 50% in the form of spherulites [26].
As regards its physical characteristics, the PCL has a density of 1.145 g/cm3, is a material of good property for a process thermoplastic with a glass transition temperature (Tg) of - 60°C, a melting point (Tm) of about 60°C, which varies according to its crystallinity and a decomposition temperature higher than 350°C. It dissolves in a large number of common solvents such as benzene, toluene, chloroform, methyl chloride, tetrahydrofurane or dichloromethane [26].
One of its major applications as biomaterial (both as homopolymer or copolymer) is like a matrix for controlled drug release systems [29], forming part of surgical devices such as bioresorbable sutures and also in the field of packaging or biodegradable containers. Unfortunately, its use in the latter field is more limited because it has a low elasticity and a low softening point [30]. Tokiwa and Suzuki have analyzed the hydrolysis of PCL and its degradation by mushroom, showing that the PCL can also be degraded enzymatically [31].
21
2. OBJECTIVE OF THE THESIS
The physical, mechanical, optical properties of PLA depend on the morphology of the solid state, the crystallinity degree of the material and the molecular weight. PLA may have an amorphous or semi-crystalline structure that depends on the stereochemistry and on the thermal history [32]. The L-isomer, poly (L-lactide) (PLLA) is a biodegradable thermoplastic polyester and can be produced from renewable sources [33]. However, PLLA has certain shortcomings that limit its applications. It is a brittle, hard polymer with a very low elongation at break, hydrophobic and takes a long time to degrade. The properties of PLLA may be modified by copolymerization (random, block, and graft) of L-lactide monomers with other co-monomers. [19]
The copolymers synthesized for this thesis are interesting because they are theoretically biodegradable. The biodegradation rate is different because the degradation, hydrolytic and enzymatic response, depends on the material density. The amorphous areas are more easily degraded as compared to the crystalline area, then the average time of degradation depends on the crystallinity degree and on the copolymer composition.
The objective of this thesis is to evaluate the variation of the morphology, nucleation and crystallization of PLA-ran-PCL random copolymers when the comonomer content of ε-caprolactone is changed.
We performed differential scanning calorimetry (DSC) and thermogravimetric (TGA) measurements in order to observe the different behavior due to the different compositions of the copolymers. Polarized light optical microscopy (PLOM) was used to observe the morphology of the crystalline areas and calculate the spherulites growth rate (secondary nucleation). The overall crystallization kinetics (nucleation + growth) was investigated by isothermal DSC.
22
3. RESULTS AND DISCUSSION
3.1 Copolymers synthesis
Copolymers PL(L)A/PCL were synthesized via the ring-opening polymerization (ROP) of lactide (LA) and ε-caprolactone (CL) in the presence of tin octanoate (Sn(Oct)2).
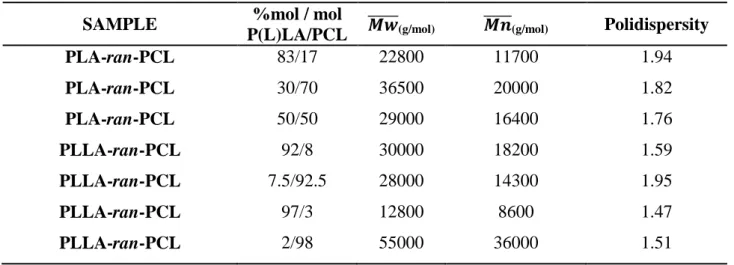
Various composition and reaction conditions were employed for obtaining different composition of the copolymers. Table 3.1 shows the compositions and the molecular weight of obtained copolymers.
Table 3.1 Molecular weight of the synthesized copolymers
SAMPLE %mol / mol
P(L)LA/PCL (g/mol) (g/mol) Polidispersity PLA-ran-PCL 83/17 22800 11700 1.94 PLA-ran-PCL 30/70 36500 20000 1.82 PLA-ran-PCL 50/50 29000 16400 1.76 PLLA-ran-PCL 92/8 30000 18200 1.59 PLLA-ran-PCL 7.5/92.5 28000 14300 1.95 PLLA-ran-PCL 97/3 12800 8600 1.47 PLLA-ran-PCL 2/98 55000 36000 1.51
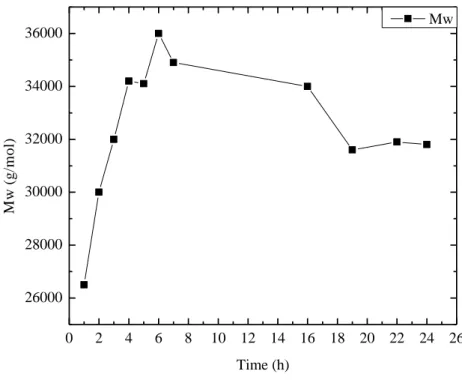
During the synthesis of the samples, an analysis was performed to evaluate the variation of the molecular weight as a function of time. Figure 3.1 shows the effect of polymerization time on the weight average molecular weight of the sample 50/50.
23 0 2 4 6 8 10 12 14 16 18 20 22 24 26 26000 28000 30000 32000 34000 36000 M w ( g /m o l) Time (h) Mw
Figure 3.1 Effect of polymerization time on the weight average molecular weight of sample 50/50
The graph shows that the weight average molecular weight increases at first and then decreases with the increase of polymerization which optimal value is about seven hours. The weight average molecular weight increases at the initial stage of polymerization because there is a high concentration of monomer to decreases with the increase of polymerization time, probably because there is not a correct homogenization due to the large increase of viscosity during the polymerization process. It was noted that the magnetic stirring, after some reaction time, is not enough to stir the reaction environment due to high viscosity of the product being formed. Moreover, being the polymerization a transesterification reaction, and then a reversible one, it is possible to correlate the variation of molecular weight with the reaction time to the fact that after some hours the reaction achieving equilibrium. Therefore the speed of the direct reaction (polymerization), and the reverse (depolymerization), are equal and aren't seeing further increases in the molecular weight. The molecular weight reaches a maximum and doesn't grow. Now the position of equilibrium depends on temperature, and then increasing it, moves the reaction.
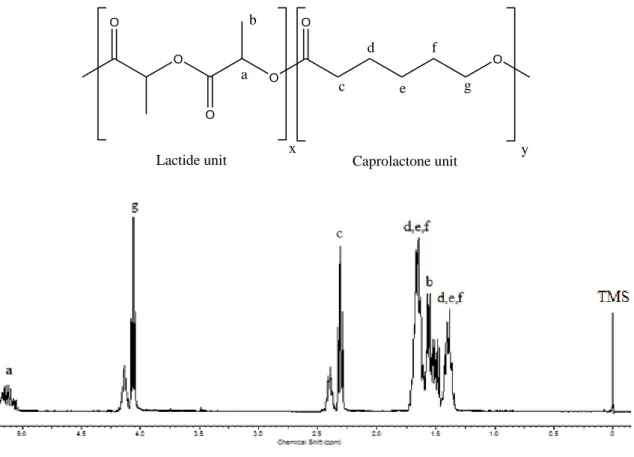
The final composition of the copolymers were determined by characterization using proton nuclear magnetic resonance (1H-NMR). As can be seen in Figure 3.2, the
24 multiplet from 5.05 to 5.25 ppm is assigned to methine proton (a) of polymerized lactide. The multiplet from 4.08 to 4.18 ppm is due to proton (g) of polymerized caprolactone that linked to a lactide molecule, while the triplet at 4.05 ppm indicates that the CL proton (g) linked to another CL unit. The multiplet between 2.35 to 2.48 ppm is due to proton (c) of polymerized caprolactone that linked to a lactide unit, while the triplet at 2.31 ppm indicates that the CL proton (c) is linked to another CL unit. For the rest of the spectrum, multiplets at 1.66 ppm and 1.40 ppm are related to the caprolactone protons (d), (e), (f), and the multiplet at 1.56 ppm, to the lactide methyl protons (b)
O O O O O O a b x y c d e f g
Lactide unit Caprolactone unit
Figure 3.2 1H-NMR spectrum of the poly(lactide-ran-ε-caprolactone) 50/50
The final copolymer composition were determined from the ratios of the methine proton integrations and the methylene proton integrations for caprolactone units at the chemical shifts of 5.15 and 4.10 ppm respectively
3.2 Standard or non-isothermal DSC
The copolymers of poly (lactide-ran-ε-caprolactone) are comprised of the following repeating units: racemic mixture of L-lactide and D-lactide, PLA, and ε-caprolactone
25 (PCL). Some considerations can be made about the behavior of homopolymers derived from these monomers, poly (ε-caprolactone) (PCL) and racemic poly(lactide) (PLA). Regarding their crystallization, the following was observed:
After bringing the PCL to the melting temperature and subsequently cooling the polymer, some degree of crystallization was obtained [34].
After bringing the PLA to the melting temperature and subsequently cooling the polymer, it was observed that the presence of the two optical isomers interfere with the crystallization in proportion to the quantity of each isomer relevant to the other [19]. The quantity of the optical isomer D or L is of critical importance as it directly affects the crystallization of the polymer.
It is known that in general, statistical copolymers are usually not able to crystallize. For this reason we have performed standard measurements using differential scanning calorimetry DSC) for the random copolymers poly(lactide-ran-ε-caprolactone), and for the copolymer containing the isomer L, poly(L-lactide-ran-ε-caprolactone) to determine how the thermal properties change when compared to homopolymers of P(L)LA and PCL.
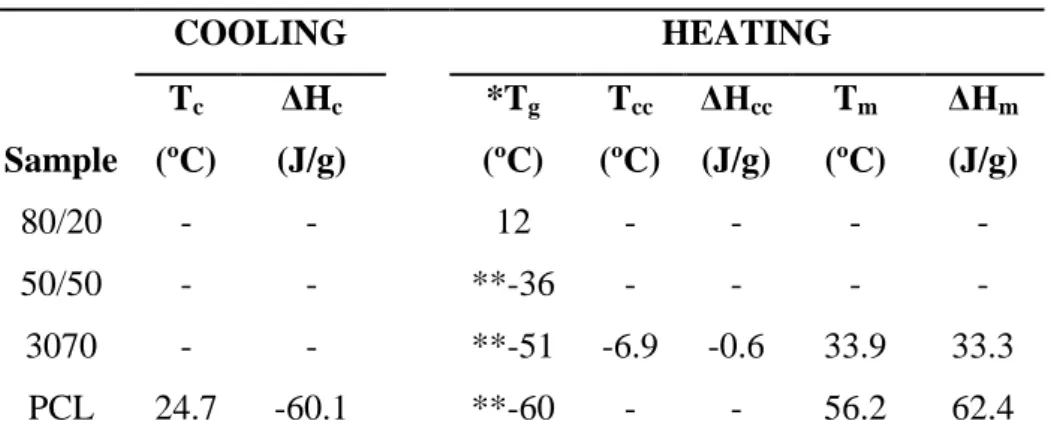
DSC cooling and second heating scans have been made, see Figure 3.3 Table 3.2 reports the values for the glass transition temperature (Tg), the peak crystallization temperature (Tc), the peak temperature of cold crystallization (Tcc), the enthalpy of crystallization (ΔHc), the enthalpy of cold crystallization (ΔHcc), the peak melting temperature (Tm) and the enthalpy of fusion (ΔHm).
26 -20 -10 0 10 20 30 40 50 60 70 80 90 E N D O T(°C) PLA/PCL 50/50 30/70 80/20 PCL Mw= 45000 g/mol Mw= 36500 g/mol Mw= 29000 g/mol Mw= 22800 g/mol 1 m W a) -20 -10 0 10 20 30 40 50 60 70 80 90 E N D O T(°C) PLA/PCL PCL 50/50 30/70 80/20 Mw= 45000 g/mol Mw= 36500 g/mol Mw= 29000 g/mol Mw= 22800 g/mol 1 m W b)
Figure 3.3 a) DSC Cooling scans at 20°C/min and b) Subsequent heating scans at 20°C/min of the PLA-ran-PCL copolymers and homopolymer PCL.
Table 3.2 DSC data obtained from Figure 3.3 Copolymers PLA-ran-PCL
COOLING HEATING Sample Tc (ºC) ΔHc (J/g) *Tg (ºC) Tcc (ºC) ΔHcc (J/g) Tm (ºC) ΔHm (J/g) 80/20 - - 12 - - - - 50/50 - - **-36 - - - - 3070 - - **-51 -6.9 -0.6 33.9 33.3 PCL 24.7 -60.1 **-60 - - 56.2 62.4
*For reasons of size of the graphics and the presence of many scans, it is not possible to observe the values of Tg
**Data analyzed by a different DSC. Range of work of -80°C to 90°C. The data are not present in the graphs.
As previously stated data confirm that PCL is a polymer which crystallizes during cooling from the molten state. When PLA contains a racemic mixture of L and D chains
27 in an equimolar amount it is an amorphous polymer unable to crystallize. Therefore, in the random copolymers, only PCL will be able to crystallize at compositions when it constitutes the major component (30/70). It is possible to see in Figure 3.3a), that by increasing the amounts of PLA the crystallization of PCL cannot be achieved.
Observing heating scans, it can be noted that the endothermic peak of melting cannot be obtained when the amount of PLA increases. This is due to the fact that PCL crystallization does not occur and it is not possible to obtain any fusion because the material is amorphous. We only observed a melting peak in the copolymer 30/70. This result is unexpected since the PCL phase does not crystallize upon cooling but it shows melting upon heating. Since the objective of this work is not to observe the ability to crystallize the PCL, we have not investigated further this behavior.
Regarding random copolymers PLLA-ran-PCL, Figure 3.4a) shows that in the presence of copolymers, when the amount of PCL is very large, although the copolymer is random, PCL can crystallize. This is probably due to the presence of a large quantity of PCL relative to PLA, therefore, no large interruptions are present in the chain sequences of PCL repeating units. 0 25 50 75 100 125 150 175 200 E N D O T(°C) PLLA/PCL PCL PLLA 2/98 97/3 7.5/92.5 92/8 2 m W Mw=45000 g/mol Mw=55000 g/mol Mw= 28000 g/mol Mw=280800 g/mol Mw=12800 g/mol Mw=30000 g/mol a) 0 25 50 75 100 125 150 175 200 E N D O T(°C) PLLA/PCL PCL PLLA 2/98 97/3 7.5/92.5 92/8 2 m W Mw=45000 g/mol Mw=55000 g/mol Mw= 28000 g/mol Mw=280800 g/mol Mw=12800 g/mol Mw=30000 g/mol b)
Figure 3.4 a) Cooling scanning 20°C/min b)Scanning of the second heating at 20°C/min of the copolymers of PLLA-ran-PCL and homopolymers PCL and PLLA
28 On the other hand, a PLLA homopolymer can crystallize since it is composed of only L chains. Nevertheless, it is a slow crystallizing polymer and therefore, it barely crystallizes upon cooling at 20°C/min from the melt when high molecular weight materials are used, as in Figure 3.4a). It can crystallize during the heating scan, undergoing cold crystallization, as shown in Figure 3.4b.
Table 3.3 DSC data obtained from Figure 3.4 Copolymers PLA-ran-PCL
COOLING HEATING Sample Tc (ºC) ΔHc (J/g) *Tg (ºC) Tcc (ºC) ΔHcc (J/g) Tm1 (ºC) Tm2 (ºC) ΔHm (J/g) PCL 24.7 -60.1 **-60 - - 56.2 - 62.4.3 2/98 26.1 -64.2 **-61 - - 51.8 - 68.5 7.5/92.5 24.8 -64 **-64 - - 50.1 52.3 68.7 92/8 - - 40 101.6 -30.9 141.9 156.2 30.3 97/3 90.2 -2.9 44 95.3 -27.5 145 159.2 43 PLLA - - 61 115.2 -43.3 180.7 - 42.7
*For reasons of size of the graphics and the presence of many scans, it is not possible to observe the values of Tg
**Data analyzed by a different DSC. Range of work of -80°C to 200°C. The data are not present in the graphs.
Figure 3.4b) shows the second heating scans. When a large amount of PCL is present in the copolymer, the PCL crystals formed during the previous cooling (Figure 3.4a)) melt and Table 3.3 shows that the melting point decreases as the amount of PLLA increases in the copolymer as expected for a random copolymer.
When the PLLA is present in large amounts, the PCL component cannot crystallize and the PLLA component exhibits cold crystallization (exothermic peak) during the heating scan. This phenomenon is due to the absence of previous PLLA crystallization due to a slow crystallization rate during previous cooling. In addition, cooling PLLA through its Tg usually causes the formation of nuclei that can later be employed during heating for cold crystallization purposes. The crystals formed by cold crystallization during the scan also exhibit clear melting peaks (Figure 3.4b)). The peak temperature of cold crystallization decreases in the copolymer as compared to neat PLLA for 3% PCL to a
29 value of 95.3°C and then increases to 101.6°C with 8% PCL. This can be interpreted as a nucleating effect of the PCL component, that is maximum at 3%. Such effect may be caused by impurities transfer, since PCL can not crystallize at these compositions. As expected for a random copolymer, when PCL is incorporated in the chains, the crystallizable units of PLLA are interrupted leading to shorter crystallizable segments of PLLA that form thinner lamellar crystals that melt at lower temperatures.
For all the samples, the Tg was obtained and the data has been included in Tables 3.2 and 3.3. From the values of Tg it's possible obtain some qualitative information about the miscibility of polymer multi-component systems, such as for our copolymers, and we can also obtain confirmation that random copolymers were synthesized. This is because systems that are completely immiscible or block copolymers show two Tgs, corresponding to those of the pure components, while in this case, a single glass transition temperature, whose value is intermediate between that of the components and is a function of their composition, has been obtained. The experimental data obtained by DSC analysis has been compared with the theoretical results obtained from the Fox equation [35]: Equation (1)
Where w1 and w2 are the weight fractions of the two components and Tg1 and Tg2 the Tg values of the neat homopolymers. Figure 3.5 shows, for all the copolymers, the variation of the Tg value related to the percentage of PCL.
30 0 10 20 30 40 50 60 70 80 90 100 -80 -60 -40 -20 0 20 40 60 T g ( °C ) PCL (%) Exp Linear Theo
Figure 3.5 Glass transition temperature as a function of the amount of PCL
It is possible to compare the data of two classes of copolymers (PLA-ran-PCL and PLLA-ran-PCL) because the D-isomer and the L are physically and chemically identical [19].
In Figure 3.5 the blue line is the linear variation of Tg with the amount of PCL; the black and red lines indicate the theoretical and experimental data. We can observe a negative deviation from theoretical data which may be a consequence of less rigidity in the new amorphous phase [4]. The qualitative trend of the experimental data is similar to that predicted by the Fox equation.
3.3 TGA analysis
In order to evaluate the mass loss trend related to the temperature variation of the homopolymers and copolymers, thermogravimetric experiments have been performed. In Figure 3.6 the graphs displays the thermograms of the copolymers containing the racemic PLA and PCL homopolymer.
31 0 100 200 300 400 500 600 -10 0 10 20 30 40 50 60 70 80 90 100 110 W e ig h t (% ) Temperature (°C) PCL 30/70 50/50 80/20 PLA/PCL a) 0 50 100 150 200 250 300 350 400 90 91 92 93 94 95 96 97 98 99 100 W e ig h t (% ) Temperature (°C) PCL 30/70 50/50 80/20 PLA/PCL b)
Figure 3.6 Thermogravimetric analysis of the copolymers poly (lactide-ran-ε-caprolactone) and homopolymer of poly (ε-caprolactone)
In Figure 3.6b) the 10% weight loss can be observed in greater detail. The results are shown in Table 3.4
Table 3.4 Data analysis TGA poly(lactide-ran-ε-caprolactone)
Sample Tpeak (°C) T10% (°C) (g/mol)
0/100 433 384 45000
30/70 363 282 36500
50/50 343 262 29000
80/20 270 235 22800
As observed from the graphs in Figure 3.6, it is evident that the copolymers tend to degrade at lower temperatures than the homopolymer PCL. Comparing the results of the copolymers, analyzing their composition, it was observed that with increasing amounts of PCL in the copolymer, there is a decrease of degradation during the rise in
32 temperature. This trend can be seen by observing both the losses of 10% by mass, and the peak decomposition temperature. Was also noticed the influence due to the molecular weight of the samples. Decrease in molecular weight results in a more rapid decomposition, probably due to the fact that the amounts of terminal hydroxyl and carboxyl groups also increases, and in those chain ends is where degradation begins. Indeed the mechanism of thermal degradation of PLA and PCL consists of random chain scissions with reactions of depolymerization [19][36].
In Figure 3.7 are displayed the thermograms of the copolymers containing L-isomer and homopolymers PLLA and PCL, the results have been reported in Table 3.5.
0 100 200 300 400 500 600 700 0 10 20 30 40 50 60 70 80 90 100 110 W e ig h t (% ) Temperature (°C) PCL PLLA 2/98 7,5/92,5 92/8 97/3 PLLA/PCL 0 50 100 150 200 250 300 350 400 90 91 92 93 94 95 96 97 98 99 100 101 W e ig h t (% ) Temperature (°C) PCL PLLA 2/98 7,5/92,5 92/8 97/3 PLLA/PCL
Figure 3.7 Thermogravimetric analysis of the copolymers poly (L-lactide-ran-ε-caprolactone) and homopolymers of poly (ε-caprolactone) and poly (L-lactide)
33
Table 3.5 Data analysis TGA poly (L-lactide-ran-ε-caprolactone)
Sample T10% (°C) T (°C) peak (g/mol)
PCL 433 384 45000 PLLA 341 300 280800 2/98 319 282 55000 7.5/92.5 326 275 28000 92/8 265 239 30000 97/3 253 220 12800
Also it is possible to observe that the degradation trend of the copolymers decreases when the amount of PCL increase.
In the following Figure 3.8 we examine the variation of the thermostability of all the copolymers with respect to the content of PCL.
0 10 20 30 40 50 60 70 80 90 100 200 220 240 260 280 300 320 340 360 380 400 T l o ss 1 0 % w e ig h t (° C ) PCL (%) PLLA-ran-PCL PLA-ran-PCL
Figura 3.8 Temperature trend of the loss of 10% by weight in function of the amount of PCL
Studies undertaken by Sivalingam et al. [37] give us a possible explanation for this observation. The thermal stability of PCL and PLA in their studies, based on the peak decomposition temperature is in the order PCL>PLA. The activation energies for random
34 chain scission and specific chain scission for the homopolymers were determined and they also follow the same trend. The stability of the polyesters may thus depend on the number of carbon atoms in the monomer. The thermal stability of the copolymers of was also investigated. The presence of PLA in the copolymer increases the degradation rate of PCL. A possible explanation for this observation is that the acid released during the degradation of PLA influences the degradation of PCL. These results were accepted since this is consistent with an earlier study [38] showing that PCL degrades at higher rate in the presence of acid releasing polymers as PVC and PVAC.
3.4 Spherulitic growth
A Polarized Light Optical Microscope (PLOM) was used to observe the morphological structure of the copolymers. The morphological structure observed is the spherulitic. A spherulite is from an optical point of view a birefringent object with two unique refractive indices: the radial (nr) and the tangential (nt).
Most spherulites observed in this work were negative, nr < nt. The direction of the
maximum birefringence can be determined by inserting a lambda plate parallel to the main direction of the local birefringence. This ascertains the presence of negative spherulites because the colors are yellow for the first and third quadrant and blue for the second and fourth. Negative spherulite can, in this manner be distinguished from positive spherulite which show an opposite refractive indices where nr > nt. For a positive
spherulite, the first and third quadrants are blue, and the second and forth ones are yellow. If the color differences between the four quadrants cannot be clearly discerned, the spherulite is a mixed one. Both types of spherulite show a Maltese cross pattern with a maximum in the intensity of the transmitted light for parts of the spherulites at an angle of 45° to the polarizer/analyzer pair. [13]
The following samples were analyzed: the copolymers PLLA-ran-PCL with the content of 3% PCL, the copolymers PLLA-ran-PCL with the content of 8% of PCL and the homopolymer PLLA. These samples were selected for analysis in order to compare the variation of the morphology and the crystals growth rate in the copolymers with small amounts of PCL. All samples show a birefringent spherulitic structure with the characteristic Maltese cross [13].
35 The following images illustrate the regions of the anisotropic sample order.
The copolymer containing 8% of PCL has been studied, using a temperature range between 105 and 135°C. Figure 3.9 shows some micrographs of the morphological structure of this sample.
Figure 3.9 Morphology of the sample PLLA/PCL 92/8 by PLOM
The pictures illustrate that a temperature of 135°C a structure that is not perfectly round is generated. Additionally, the Maltese cross has been distorted in the sample. This is probably due to the low nucleation probability of the material at very high temperatures which limits the number of lamellae that can grow simultaneously. The structure looses its tridimensional character (i.e., spherulitic character) and is now more two dimensional (i.e., it forms axialites or two dimensional aggregates of lamellae that can be stack on one another copying the facets characteristics of single crystals).
The crystalline morphology of the copolymer with 3% of PCL shows a situation similar to the previous one. The analysis was conducted in a temperature range between 115 and 135°C.
36
Figure 3.10 Morphology of the sample PLLA/PCL 97/3 by PLOM
Figure 3.10 shows the Maltese cross forms at temperatures between 120 and 127°C. At the temperature of 115°C we can observe the phenomenon of "banding" due to the twisting [39] of the lamellae which form the spherulite in the radial direction. At 130°C the presence of hexagonal structures can be observed. In a few studies reported by Abe et al. [12] they observed that this effect occurs because the crystal grows in two orthogonal directions on a single layer. This structure is organized in such a way as to have a stacking of crystals where it is only possible to view the upper layer and is therefore defined as aggregate crystals of two-dimension.
37
Figure 3.11 Morphology of PLLA homopolymer by PLOM
Comparing the images presented, it can be observed that there is only little difference between the copolymer with 3% of PCL and PLLA homopolymer. In both cases the spherulites have a defined outline and the distinct presence of the Maltese cross unlike the copolymer containing 8% of PCL.
After observing the samples crystal morphology, the next step was to study the kinetics of crystallization in order to determine the spherulitic growth rate (G).
To measure G, using isothermal crystallization, a Polarized Light Optical Microscope (PLOM) was used. For the overall kinetics of the process (which includes both nucleation and growth), the analysis was performed using DSC, which will be discussed in the next section.
To measure the growth rate of spherulites, micrographs were taken at regular time intervals to determine the variation of the radius over time. The result of plotting spherulite radius versus time is a straight line with a slope equal to the growth rate (G) of the spherulites. To obtain a more accurate result of G, several spherulites were analyzed
38 using each temperature to obtain multiple values of G and create an average of all the obtained slopes. Figure 3.12 shows a sequence of images where the spherulitic growth as a function of time can clearly be observed. The radii values are given in Table 1 below.
Figure 3.12 Display of the spherulitic growth of the copolymer PLLA-ran-PCL 97/3 at 120°C
Table 3.6 Results obtained from the spherulitic growth of the copolymer PLLA-ran-PCL 97/3 at a temperature of 120°C Photo 1 2 3 4 5 6 Time(min) 4.5 4.75 5 5.25 5.5 5.75 Radius(μm) 77.4 81.2 86.8 90.9 94.8 98.1
1
2
3
4
5
6
50μ
m
50μ
m
50μ
m
50μ
m
50μ
m
50μ
m
39 Plotting these values as radius vs time, a linear trend was shown. Figure 3.13 shows an example of measurements of six different spherulites at the crystallization temperature of 120°C. 1 2 3 4 5 6 7 8 9 10 11 12 13 14 15 16 20 40 60 80 100 120 140 160 180 200 220 r ( m) t(min)
Figura 3.13 Measurement of radius vs time of six different spherulites
The average value of the slope, obtained by the lines, was used to obtain the value of G = 16 μm/min with a standard deviation of σ = 0.8056. This procedure was carried out with the PLLA spherulites formed by the two copolymers (3% and 8% of PCL), and with the homopolymer of PLLA at different temperatures of isothermal crystallization from the melt. With the data obtained it was possible to compare the trend of the crystal growth rate with respect to the temperatures of isothermal crystallization. Figure 3.14 reports the experimental data obtained from the described analysis.
40 100 105 110 115 120 125 130 135 140 145 150 155 0 2 4 6 8 10 12 14 16 18 G [ m /m in ] Temp. [ºC] 97/3 92/8 PLLA Fitting
Figure 3.14 Spherulitic growth rate vs isothermal crystallization temperature of samples analyzed by PLOM
From Figure 3.14, it is possible to observe that all samples have a bell-shaped trend due to the dependence of the spherulites growth rate (G) from the temperature. The temperature range in which to observe this behavior is bounded by two values: the Tg and the Tm.
Moving to temperatures close to the Tg (the left side of the bell shaped curve) diffusion of macromolecules is difficult and spherulite growth tends to be slower. For this reason, G is governed by the diffusion of macromolecules, which tends toward zero when we are at values equal to or below the Tg.
On the right side of the bell shaped curve, we are bounded by Tm, because close to this temperature, the copolymer nucleation on the surface of the crystals already present is difficult, because the macromolecules have a high mobility. In this zone, the dominant term is the secondary nucleation (crystal growth) [40].
41 In Figure 3.14 a dependence of G from the molecular weight of the copolymers and the homopolymer can be observed; the lower the molecular weight the higher the value of G
[11]. Since the objective is to see how the spherulites growth rate changes as a result of the amount of PCL, and since the homopolymer of PLLA that was used, posses a molecular weight much higher than the copolymers, for subsequent analysis we have taken the data from a previous work [41] in which two PLLA homopolymers have a molecular weight comparable to the copolymers analyzed (8600 g/mol and 17300 g/mol). The trend of the samples was observed by setting an equal temperature to all (Tiso=130°C) and found that 3% of PCL in the PLLA causes a small increase in the
spherulites growth rate followed by an important decrease when the amount of PCL increase to 8%. From the graph in Figure 3.15 it is possible to observe this trend.
-1 0 1 2 3 4 5 6 7 8 9 3 4 5 6 7 8 9 10 11 12 13 14 G [ m /m in ] PCL% G 8%PCL Mn=18200 g/mol 3%PCL Mn=8600 g/mol PLLA Mn=8600 g/mol Mn=234000 g/mol PLLA Mn=17300 g/mol PLLA
Figure 3.15 Trend of G compared to the amount of PCL. Constant temperature T=130°C
After obtaining experimental values of G for each sample, the Lauritzen-Hoffman model (L-H), which provides expressions for the linear growth rate as a function of supercooling degree, was employed (see figure 3.16a)).
42 4,0x10⁻⁵ 6,0x10⁻⁵ 8,0x10⁻⁵ 1,0x10⁻⁴ -6,0 -5,5 -5,0 -4,5 -4,0 -3,5 -3,0 -2,5 L n G + U * /( R. (T c -T ) 1/(Tc.T.f) 97/3 92/8 PLLA Fitting a) 40 60 80 100 120 140 160 180 200 -2 0 2 4 6 8 10 12 14 16 G [ m ic r/ m in ] Temp. [ºC] 97/3 Exp 92/8 Exp PLLA Exp Fit L-H b)
Figure 3.16 Trend of the theory of L-H with PLOM
According to the L-H theory, from the slope of the line it is possible to obtain the values of (a term proportional to the energy barrier for spherulite growth), while the
intercept with the ordinate gives us the value of G0 (pre-exponential term). In figure
3.16b) the bell-shaped trends of the experimental data can be observed as well as the theoretical values represented by the red lines.
Observing the lines we can say that we are in a single crystallization regime since there is no change of their slope, and noting the spherulitic morphology during crystallization, we can say that we are in a regime II. In this regime, the rate G is governed by the secondary nucleation rate, and by the lateral growth rate since the two are similar [42].
Table 3.7 Data obtained using the model L-H with PLOM data
PLLA/PCL
(II) (K2) σ(erg/cm
2
) σe(erg/cm2) q(erg) G0(cm/sec) R2
92/8 3.55E+04 8.08 32.29 1.19E-13 1.38E-01 0.9953
97/3 2.59E+05 8.08 214.37 8.97E-14 7.91E-13 0.9839
43 As can be seen in Figure 3.16, the number of data points for PLLA is insufficient. We can observe an unexpected trend in terms of copolymer composition that may be due to errors in the fitting since not all samples have the same number of data points. Normally one needs at least seven data points per curve. In the case of PLLA we have only four very close data points which of course fit a straight line in the L-H plot, but is difficult to extrapolate such behavior over a large temperature range. More data are needed to be able to confirm the trends shown in Table 3.7. Nevertheless, the fact that both copolymers crystallize faster than PLLA is probably related to the plasticizing effect of PCL co-units within the copolymer that depress the Tg values.
We used the “LH Model fit” Origin® plugin, that was designed in a previous work to analyze crystallization kinetic data (G or 1/τ), performing the linear fit according to the LH Theory model. This “LH Model Fit” is available for free distribution upon request [43].
3.5 Overall isothermal crystallization kinetics
To study the isotherm crystallization, analysis at different temperatures from the melt have been performed using the DSC instrument.
Figure 3.17 shows the DSC scans as a function of time collected during isothermal crystallization at various Tc from a melt state (Tc = constant, t = 30 min). Starting temperatures of ~ 30°C higher than the Tg were selected, in a range of about 40°C. At low temperatures the crystallization rate is slow, with a broad exothermic peak. Figure 3.17c) shows that the copolymer 92/8 does not have enough time (t = 30 min) to finish the crystallization until temperatures of about 80-86°C are reached. In addiction for all samples, for intermediate temperatures an increase of the crystallization rate can be observed.
44 0 5 10 15 20 25 30 E N D O Time (min) 88°C 90°C 92°C 94°C 96°C 98°C 100°C 102°C 104°C 106°C 108°C 110°C 112°C 114°C 116°C 118°C 120°C 122°C 124°C 126°C 128°C 130°C 2 m W a) 0 5 10 15 20 25 30 E N D O Time(min) 68°C 70°C 72°C 74°C 76°C 78°C 80°C 82°C 84°C 86°C 88°C 90°C 92°C 94°C 96°C 98°C 100°C 102°C 104°C 106°C 108°C 110°C 2 m W b) 0 5 10 15 20 25 30 E N D O Time (min) 70°C 72°C 74°C 76°C 78°C 80°C 82°C 84°C 86°C 88°C 90°C 92°C 94°C 96°C 98°C 100°C 102°C 104°C 106°C 108°C 110°C 1 m W c)
45 For all scans the half-crystallization time, , has been calculated, this is the time
needed for 50% relative conversion to the semi-crystalline state. The inverse of the half-crystallization time is proportional to the overall half-crystallization rate.
60 70 80 90 100 110 120 130 0,1 0,2 0,3 0,4 0,5 0,6 0,7 1/ 1/2 [ 1 /m in ] Temp. [ºC] 97/3 PLLA 92/8 Fitting
Figure 3.18 Inverse of half-time of crystallization vs. isothermal crystallization temperature. Samples analyzed by DSC
Figure 3.18 shows the trend of the crystallization rate with crystallization temperature which includes the process of nucleation and growth. The sample of PLLA analyzed has a high molecular weight (Mn=280800 g/mol) and its experimental values are intermediate with respect to the two copolymers. Studies undertaken by Okui et al. [11] illustrate how the trend of the crystallization rate varies as a function of the molecular weight at a constant temperature, thus obtaining a bell-shape curve. Therefore it is possible that the molecular weight of PLLA being too high causing a decrease of the crystallization rate (see figure 3.19). Since the interest of this work is to observe the influence of the PCL in the copolymer, data have been taken from a previous work [41] in which a PLLA homopolymer has a molecular weight comparable to the copolymers analyzed (8600 g / mol) to see how this behavior is related to the amount of PCL. From the graph in figure 3.19b) it is possible to observe this trend by setting a temperature
46 equal for all (108°C). From the results it was observed that 3% of PCL causes an increase of the crystallization rate followed by a decrease when there is 8% of PCL.
0 75000 150000 225000 300000 0,4 0,6 0,8 1,0 1,2 1,4 1,6 1,8 2,0 (1/ )[ 1 /m in ] Mn(g/mol) Mn Fitting a) Mn=8600 g/mol Mn=17300 g/mol Mn=41500 g/mol Mn=280800 g/mol -1 0 1 2 3 4 5 6 7 8 9 0,22 0,24 0,26 0,28 0,30 0,32 0,34 0,36 0,38 0,40 ( 1/ 1/2 ) [1 /m in ] PCL% % PCL PLLA Mn=8600 g/mol 3%PCL Mn=8600 g/mol 8%PCL Mn=18200 Kg/mol b)
Figure 3.19 a)Crystallization rate, expressed as 1/τ1/2 as a function of the number average molecular
weight (Mn) of PLLA samples with different molecular weight; Tc= 110°C. b) 1/τ1/2 as a function of
PCL content at a fixed isothermal crystallization temperature of 108°C
It would seem that small amounts of PCL (3%) lowers the Tg and causes a plasticization effect which increases the mobility of PLLA chains, hence they crystallize faster. When there is a quantity of 8% of PCL, the crystallization rate of the copolymer decreases, probably because a higher amount of PCL is interfering with PLLA crystallization by interrupting the linear sequences that are capable of crystallization (in spite of the plasticization effect of PCL), as in any random copolymer. In fact, higher amounts of PCL would lead to the absence of PLLA crystallization. The trends observed are similar and consistent with those previously obtained for spherulitic growth rate measurements. For the analysis of data obtained by DSC under isothermal conditions, we used the Avrami equation to obtain the values of n and k. All the calculations needed to perform the "Avrami fits" and comparisons between the experimental data and the predictions of the theory were performed with an Origin® application software. This Origin plugin was designed to analyze the DSC isotherms, establish the baseline, calculate the integral of it,
47 perform the linear fit according to the Avrami equation, calculate fitting errors and perform graphical comparisons between the experimental data and the predictions [43].
Figure 3.20 shows an example of graphs obtained by applying the theory of Avrami on isothermal curves for each sample. Figure 3.20a) is the linear equation of Avrami, where the slope of the line is n and the intercept on the ordinate is k. In all the samples a conversion degree between 3% and 20% to the semi-crystalline state was used in order to obtain the best values from the theory of Avrami [44]. Figure 3.20b) shows the relationship between the semi-logarithmic amorphous fraction and the material (1-Vc) as a function of time (log (t-t0)). Figure 3.20c) shows the graphs for the theoretical and
experimental isothermal crystallization process. In the last graph, Figure 3.20d), we can see the change of the enthalpy of crystallization as a function of crystallization time; from this curve we can obtain the value of τ1/2.
48 -2 -1 0 1 -4 -2 0 L o g (-ln (1 -V c )) Log(t-t0) a) -2 0 0,0 0,2 0,4 0,6 0,8 1,0 (1-Vc)T (1-Vc)E (1 V c )/ -( t) Log(t-t0) b) 0 4 8 12 16 20 24 28 -1,0 -0,8 -0,6 -0,4 -0,2 0,0 50% Exp 50% Theo Fit Exp H e a t F lo w , E n d o U p ( n o rm ) Time (min) c) 0 4 8 12 16 20 24 28 0,0 0,2 0,4 0,6 0,8 1,0 Fit Exp Normalized HC H C Time (min) d)
Figure 3.20 a) Avrami plot. b) Unconverted relative volumetric fraction as a function of time for the isothermal crystallization of the PLLA at 104°C. Comparison between the experimental data and Avrami fit. c) Comparison between experimental DSC isothermal and Avrami prediction for PLLA
isothermally crystallized at 10°C. d) change of the enthalpy of crystallization as a function of crystallization time
The data obtained with the model of Avrami are reported in Table 3.8. It is possible to see that the values of Avrami index n, are between 2.15 to 2.46 for PLLA, while for copolymers 97/3 and 92/8 we obtained the respective values between 2.07 to 3.1 and from 2.06 to 2.61. The n values correspond to the morphologies previously observed by PLOM. Indeed two-or three-dimensional growth superstructural aggregates were observed with an instantaneous nucleation (n=2-3) [45].

![Figure 1.4 Schematic drawings of how polymer crystal growth takes place in three regimes: (a) regime I; (b) regime II; and (c) regime III [13]](https://thumb-eu.123doks.com/thumbv2/123dokorg/7457609.101469/15.892.128.733.159.500/figure-schematic-drawings-polymer-crystal-regimes-regime-regime.webp)
![Figure 1.8 Synthesis of different kind of PLAs by ROP [18]](https://thumb-eu.123doks.com/thumbv2/123dokorg/7457609.101469/19.892.135.726.386.855/figure-synthesis-of-different-kind-of-plas-rop.webp)