Paolo Cerretelli • Bruno Grassi ' Lei Xi Federico Schena • Claudio Marconi Michael Meyer • Guido Ferretti
The role of pulmonary COa flow in the control
of the phase I ventilatory response to exercise in humans
Accepted: 10 February 1995
Abstract To gain an insight into the origin of the phase I ventilatory response to exercise (ph I) in humans, pulmonary ventilation (12E) and end-tidal partial pres- sures of oxygen and carbon dioxide (PETO2 and PETCO2, respectively) were measured breath-by- breath in six male subjects during constant-intensity exercise on the cycle ergometer at 50, 100 and 150 W, with eupnoeic normocapnia (N) or hyperpnoeic hy- pocapnia (H) established prior to the exercise test. Cardiac output (Qo) was also determined beat-by-beat by impedance cardiography on eight subjects during moderate exercise (50 W), and the CO2 flow to the lungs (~)cC~CO2 where C~CO2 is concentration of CO2 in mixed veneous blood) was estimated with a time resolution of one breathing cycle. In N, the initial abrupt increase of 12 E during ph I (A I?E approx- imately 18 1" min -1 above rest) was followed by a tran- sient fall. When P~TCO2 started to increase (and PETO2 decreased) ~?E increased again (phase II ventila- tory response, ph II). In H, during ph I A I?E was similar to that of N By contrast, during ph I1 A I/E kept gradually decreasing and started to increase only when PETCO2 had returned to approximately 40 m m H g (5.3 kPa). Thus, as a result of the prevailing initial conditions (N or H) a temporal shift of the time-course of I/E during ph II became apparent. No correlation was found between CO2 flow to the lungs and IrE during ph I. These results are interpreted as suggesting that an increased CO2 flow to the lungs does not
P. Cerretelli (12~) - B. Grassi - L. Xi " F. Schena - G. Ferretti Department of Physiology, CMU, Universit6 de Gen~ve, 9 Avenue de Champel, CH-121I Genev~ 4, Switzerland P. Cerretelli • B. Grassi • C. Marconi
Section of Physiology, Istituto di Tecnologie Biomediche Avanzate, Consiglio Nazionale delle Ricerche, Milar~ Italy
M. Meyer
Abteilung Physiologic, Max-Planck-Institut fiir Experimentelle Medizin, G6ttingen, Federal Republic of Germany
constitute an important factor for the initial hyperven- tilatory response to exercise. They are rather compat- ible with a neural origin of ph I, and would support the "neurohumoral" theory of ventilatory control during exercise.
Key words Exercise. Ventilation- Respiratory control
Introduction
Zuntz and Geppert (1886) have first described the sud- den increase in pulmonary ventilation (12E) at the onset of constant-load exercise, later identified as the so- called fast component (Dejours 1963), or phase I (ph I) of the ventilatory response to exercise (Wasserman et al. 1986). Krogh and Lindhard (1913) have confirmed the existence of ph I, and referred it to a central com- mand, an irradiation of impulses from the motor cortex to the respiratory centres. Alternatively, ph I has been attributed to an accumulation of metabolites in the active muscles, i.e. to a muscle chemoreftex, or to other reflex mechanisms from the exercising limbs. Indeed, the source of the afferent peripheral drive has long been a matter for debate, until McCloskey and Mitchell (1972) have shown in the cat that the instantaneous ventilatory response elicited by ventral root stimula- tion could be abolished by the anaesthetic blockade of groups III and IV all, rents, but not of groups I and II, thereby ruling out the stimulation of articular receptors and muscle spindles as the reflex input. The origin o f p h I has also been associated with the chemoreceptive function of hypothetical tissue receptors, a postulate, however, that lacks supporting experimental evidence (Wasserman et al. 1986).
Over the last two decades the neural peripheral ori- gin ofph I has been questioned. Wasserman et al. (1974, 1986) have hypothesized that exercise hyperpnoea could result from an increased flow of CO2 to the lungs,
defined as the product of cardiac output ((~ct times CO2 concentration in mixed venous blood Qo'C~CO2), through the activation of hypothetical CO2 receptors located either in the lungs and/or in the right heart. The ph I has also been associated with mechanical inputs from the heart to the respiratory centres (Jones et al. 1982). The latter hypothesis, however, has been chal- lenged by recent experimental evidence on animals (Huszczuk et al. 1990) and humans (Marconi et al. 1991) carrying artificial hearts set at constant Qc. The CO2 flow hypothesis has been tested by several authors. A close qualitative and quantitative relation- ship between 12 E and ()o during ph I has been found by Cummin et al. (1986), whereas according to other authors the increase in 12 E has been more marked and abrupt than the increase in (~c (Miyamoto et al. 1982; Adams et al. 1987; Morikawa et al. 1989). In none of these studies, however, have attempts been made to calculate and/or vary CO2 flow to the lungs.
On the other hand, the central command theory of Krogh and Lindhard (1913) has undergone a recent resurgence. According to Eldridge et al. (1985) hy- pothalamic signals have been shown to be primarily responsible for the proportional drive of locomotion and respiration during exercise.
The aim of the present investigation was to test the theories underlying the CO2-mediated compared to the neural origin of the ph I response to constant-intensity exercise in humans. This was attempted by measuring: 1. The time courses of I?E and of end tidal partial pressures of oxygen and carbon dioxide (PET 02 and Pra'COe) during the rest-to-work transition of graded intensities, starting both in normocapnia and in hypocapnia.
2. The time courses of Q~ and COz flow to the lungs at the onset of exercise, and their possible link to ph I. This approach was made possible by monitoring l?z and gas exchange as well as 0o breath-by-breath (BbB) and beat-by-beat (bbb) respectively.
Methods
Subjects
A total of 11 healthy untrained male subjects
mean age 34.6 (SD 6.3) years, mean height 176 (SD 6) cm; mean body mass 75.7 (SD 11.8 kg)
volunteered for the study. They were informed about the protocols and the laboratory techniques and gave their consent to participate in the study, but were not informed as to the aim of the investigation, which was approved by the Ethics Committees of the institutions involved.
Measurements
A computerized metabolic cart (SensorMedics MMC 4400tc) was used for BbB assessment of 12E, (in BTPS), PExO2 and PExCOz,
respectively and gas exchange [02 uptake (1202) in STPD, and CO2 output (I?CO2) in STPD]. The 12~ was calculated by integration of the flow tracings recorded at the mouth of the subject by a low- resistance turbine flowmeter. Volume calibration was performed prior to each measurement, by means of a 3-1 syringe, at three different flow rates usually observed at rest and during exercise. The 1202 and 12CO2 were obtained from the time courses of partial pressure of 02 and COz (PO2 and PCO2) at the mouth throughout the respiratory cycle, and from established mass balance equations. Differences in response time of flow meter and gas analysers were corrected for in the computation of gas exchange parameters. The method used in the present study to determine BbB gas exchange does not allow for the correction of changes, during successive breaths, of pulmonary gas stores.
The Q~ was determined on a bbb basis by impedance cardiogra- phy. A prototype of an impedance cardiograph designed at the Department of Biomedical Engineering at the University of Stut- tgart (Germany) was used. A constant current of 4 m A r m s at a frequency of 100 kHz was applied to the chest by two disposable self-adhesive electrodes. Two separate electrodes were used to measure the changes of voltage resulting from variations of impe- dance within the chest volume under consideration. The four-spot electrode array was placed according to the scheme of Kubicek et al. (1966). Baseline thoracic impedance (Zo), change of impedance
(dZ/dt) and maximum of impedance derivative (dZ/dtm,x) were
automatically derived together with left ventricular ejection time
(L VE T), heart rate (FIR) and the electrocardiogram. Stroke volume (SV) was calculated according to the equation of Kubicek et al.
(1966):
SV = r (I/Zo) 2 (dZ/dtmax)LVET (1)
where l is the distance between the inner electrodes and r the resistivity of blood at 100 kHz.
Experimental procedure and calculations
The respiratory variables were obtained on 6 of the 11 subjects during constant intensity exercise at 50, 100, 150 W carried out on an electrically braked cycle ergometer (Bosch ERG 551). A particu- lar effort was made to eliminate all sources of noise from the room and to make the subject feel as comfortable as possible. The subject sat on the cycle ergometer either breathing room air for 5 min (normocapnic mode, N) or hyperventilating (I?E about three times the resting level, mainly as a consequence of an increase in tidal volume VT) for the first 4 min and resuming spontaneous I)E over the 5th min (hypocapnic mode, H). The level of hyperventilation was chosen to induce P~CO2 values of about 20--25 mmHg (2.7-3.3 kPa). Each subject practiced the chosen hyperventilatory pattern during the training experiments. No subject experienced any symptoms during and after the hyperventilatory procedure. The subject was then asked by voice to carry out the required exercise without warning, to avoid a ventilatory anticipation of exercise onset. Exercise was started from a standardized position of the legs allowing the fastest start, i.e. with the left pedal arm in a frontal horizontal plane. The required intensity was attained within 3 s. A pedalling rate of 60 (SD 2) rpm was chosen. The I2E, 1202, 12COz, gas exchange ratio (R), PnTOz and PE~CO2 were recorded BbB over the whole experimental period. Both in N and in H, four repetitions were performed at each exercise intensity. In three cases the exercise duration was 1 rain, but in the last trial the exercise was carried out for 5 rain.
The ph I is usually defined as the period between the start of exercise and the beginning of changes in mixed venous blood and alveolar gas Oz and CO2 partial pressures (PAO2 and PACOz) (Whipp 1987; Whipp and Ward 1980). The duration of ph I was thus calculated as the time elapsing from exercise onset to the instant when an abrupt change in the slope of the PETCO2 and PETO2
versus time curves became evident. The amplitude of ph I was • obtained as the difference between the peak 17 E within ph I and the average 12E immediately preceding the start exercise (after hyperven- tilation in H). The time to reach the peak I?E response after exercise onset was also calculated.
On a separate occasion, Qo was determined on 8 subjects (5 of whom were different from those participating in the gas exchange analysis series) during 50-W exercise periods in the N mode. The same experimental procedure as for the determination of the respir- atory variables was applied. On 2 subjects, the 0~ measurements at 50-W were repeated in H. The Qc was not measured at exercise intensities higher than 50 W, to avoid artefacts from moving elec- trodes at higher exercise intensities (see Discussion).
The CO2 flow to the lungs was calculated throughout the first 60 s of exercise as follows:
C O 2 flOW = (~e'C/~CO2 (2)
where, by rearranging Fick's equation:
C O 2 f l o w = C a C O 2 "~- V C O 2 / Q ¢ (3)
where CaCO2 is the concentration of carbon dioxide arterial blood. The Qc measurements corresponding to the average value cal- culated over one breathing cycle (1/fr) were used. The C~CO2 was calculated from the partial pressure of carbon dioxide in the arterial blood (PaCO2) by means of the nomogram of Dill et al. (1937). The P.CO2 was estimated from PETCO2 as (Jones et al. 1979):
P a C O 2 = 5.5 q- 0.90PrTCO2 - 0.0021 V-r (4)
Statistics
The effects of exercise intensity and PCO2 on the characteristics of ph I were analysed by two-way ANOVA. When needed, a z-test was used to identify significant differences. The relationship between CO2 flow to the lungs and 1/E was determined by linear regression. The level of significance was set at P < 0.05.
Results
Ventilatory response
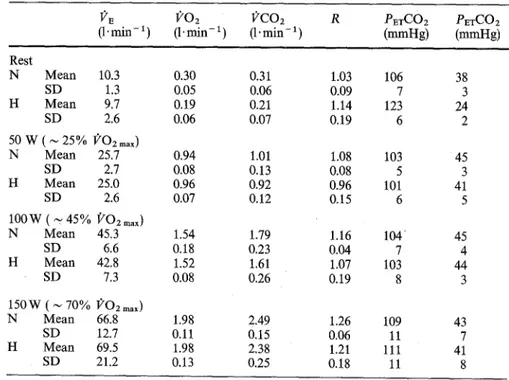
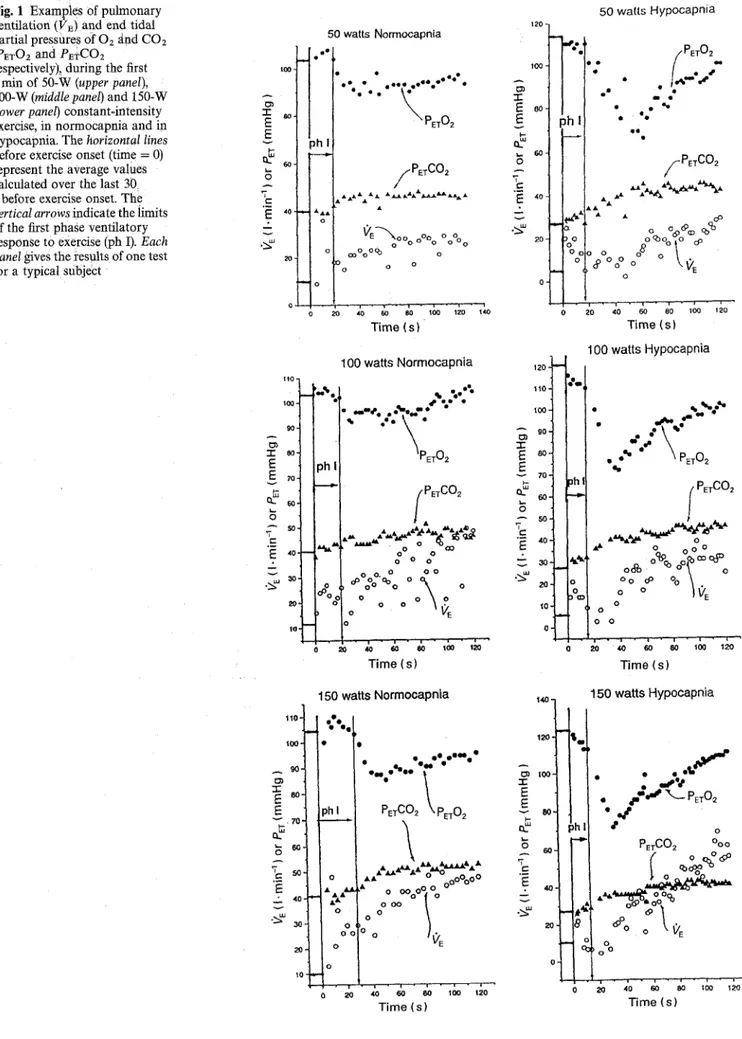
Mean resting and steady-state exercise values for 12E, 1202, 12COz, R, PEa'O2 and PETCO2 are shown in Table 1. Individual examples of the time course of I)'E following the onset of exercise, in which the ph I is highlighted, are shown in Fig. 1 (the first 2 min of the 5 min exercise test, BbB values) for the three tested exercise intensities in normocapnia (N, left panel) and hypocapnia (H, right panel). The PETO2 and PEa'CO2 are also given. Figure 2 is an individual summary of the time courses (up to 2 min) of 12E and PEa'CO2 for the 5-min 50-W intensities. The corresponding time courses of (/02 and 12CO2 are given in Fig. 3. In N 12E increased abruptly after the onset of work (ph I). In 48 out of 72 experiments, this increase was followed by a clear transient fall in 12E, which in 15 cases was
associated with a slight decrease in
PETC02.
WhenPETCO2 started to increase and P E T O 2 to decrease
above and below resting levels, respectively (end of ph I), 12E began to increase again (ph II) towards a steady state. In H, an abrupt 17E increase, similar to that in N,
was accompanied by a slight increase in P E T C O 2 and
by a decrease in P E T O 2 (not shown in Fig. 2) towards
the values preceding hyperventilation. However, con- trary to N, the sudden changes in the slope of the
P E T C O 2 o r PETO 2 versus the time curves, indicating end ofph I, were not followed by an immediate increase in 12E (ph II). Rather, 12 E stayed low, sometimes even below the pre-exercise values. Accordingly, PET 02
Table 1 Pulmonary ventilation (12r) , 02 consumption (1202), C O 2 output (IICOz), gas exchange ratio (R), end tidal partial pressures of 02 and CO2 (PETO2
and PrTCOz), in normocapnia (N) and in
hypocapnia (H), at rest and at the steady state of different exercise intensities; n = 72 at rest and 18 during exercise
I)'E 1)'O2 I)'CO2 R PETCO2 PETCO2
(1' min - ~ (1" rain- 1 ) (1. min - 1) (mmHg) (mmHg) Rest N Mean 10.3 SD 1.3 H Mean 9.7 SD 2.6 50 W ( ~ 25% l?Oz max) N Mean 25.7 SD 2.7 H Mean 25.0 SD 2.6 lOOW ( ~ 45% ,~rO2 max )
N Mean 45.3 SD 6.6 H Mean 42.8 SD 7.3 1 5 0 W ( ~ 7 0 % ~rO2 max ) N Mean 66.8 SD 12.7 H Mean 69.5 SD 21.2 0.30 0.31 1.03 106 38 0.05 0.06 0.09 7 3 0.19 0.21 1.14 123 24 0.06 0.07 0.19 6 2 0.94 1.01 1.08 103 45 0.08 0.13 0.08 5 3 0.96 0.92 0.96 101 41 0.07 0.12 0.15 6 5 1.54 1.79 1.16 104' 45 0.18 0.23 0.04 7 4 1.52 1.61 1.07 103 44 0.08 0.26 0.19 8 3 1.98 2.49 1.26 109 43 0.11 0.15 0.06 11 7 1.98 2.38 1.21 111 41 0.13 0.25 0.18 11 8
Fig. l Examples of pulmonary ventilation (12~) and end tidal partial pressures of Oz ~tnd CO2 (P~O~ and PETCO2
respectively),, during the first 2 rain of 50-W (upper panel),
100-W (middle panel) and 150-W
(lower panel) constant-intensity exercise, in normocapnia and in hypocapnia. The horizontal lines
before eXercise onset (time = 0) represent the average values calculated over the last 30 s before exercise onset. The
vertical arrows indicate the limits of the first phase ventilatory response to exercise Iph I). Each panel gives the results of one test for a typical subject
50 watts Normocapnia e l e -r E - r
E
g
g
~
8 / " P E T C 0 2 E .:~ .~ ~E-~,oo °o o % °0% o 20 c°°°O q3 o o o o 0 20 40 60 80 too 1zo 140 Time (s) gO. A "1" eo- E E 70" v A 50" "T E '~: 40' i v . . ~ 30 2O IO" 100 watts Normocapnia I" -"..'~..--" PETO2 ph _ _ ~ w ~ ~ k oI%°1
-r
I . o I PETC02 . o ° o 0"o<30 o o o o o. o o o ,~ oOO OOo o ~ o Time (s) 1 1 0 . 100, . ~ 90 -,- so~ 0 S O ' L]r
20- 150 watts Normooapnia""t
" .. " . . . ' ; " ' - " ~ A- AA• & I | , " ~ ' ~ - " o ~ " •• oo~eOOo
o o o o o o ° o VE 0 ~ ,=0 60 80 1oo 12 120 Time (s) 120 io0 2 120 -j 110 1 I O 0 - A 90- - r E SO- 70- v ~> . 50. "~ 40 - .2-' 30- v .~,,, 2'0- tO. 50 walls Hypocapniaii
" / PET O2 . u . I.,-'.-"" .
2-,"
• e e e t e /~PETC02 yo o'~Oo ,o oO°°°
~°°°o°~ °tc,~
20 4'0 60 80 IOO 130 Time (s) 100 watts Hypocapnia #,, ~,hl o"-
. ,'e',"''"
..--.;
• PET02 o,i l PETCO2 ~ ' o o o o oooo °°~b oo~COC~D °OOo~ % \ .
° o ~ v ~ o o o Time (s) ~40 150 watts Hypocapnia ""l PETCO~ %° / ( ° ~ ; " ~ " 2o " ~ ~ , ; C , ; ~ '~ Time (s)1 50- N - 40 .c_ - - 4 £ E 30 o .~ • 1 0 0 3
soso
C 40 ~ C D O t - • E 30 ~ • • .~,- 20 • 1 0 H 2 50 " 5 0 4o 40 -r E e- 30 30 E '~= ~o f f + ~o -~ ~o ~Y ~0 o o 0 -.5 0 ,5 1 1,5 2 -. 0 o5 1 1.5 2 H " 60 • o oG% • • • 0 • • • 0 • 5O .g 40 • 40 32 ,7 E .£ • a o E E 3o I- . 1 0 &-~ • 10 o o o 5 5O 40 e,, E 3 0 20. .~, • 10, -.5 0 .5 1 1.5 2 -.5 0 .5 1 1.5 N%":
6 5O H 50 4 0 - r ~ 40 E c- O 0 o o "30 g: '~ 30 .20 _ 20 o • 10 ' ' ~ 0 -.5 0 .5 1 1.5 2 -.5 0 .5 1 1.5 2 N @ -.5 0 .5 1 1.5 N , o ° ° ° A A • ~A '50 Oq~OO c 40 '-r o ~ oo E o o 3 0 g • f f o 2 0 0 • • • • ~ - 1 0 . . . • • ~ A A A • O o -.5 0 .5 I 1.5 2 H 50 "~ 40 E • A E -3o % 0 J'~ • *?• • -20 ~% • • - 1 0 o A A p~ -,5 0 .5 1 1.5 2 -,5 0 .5 1 1,5 2 A ' l i ~ , , ' , i i i' H d o O O • • A w( ~ o -*A~ "~ •I•22
, , i , i i b , , i " 5 0 -40 :I: 'E E "30 ---- o ~ - 2o "10 o 0 -.5 0 .5 1 1.5 2 -.5 0 .5 1 1.5 2Time (min) Time (min)
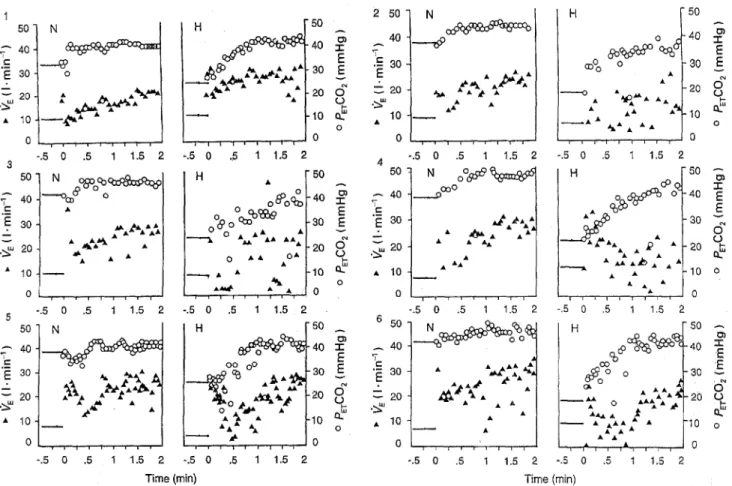
Fig. 2 Pulmonary ventilation (12~) and end tidal partial pressure of C O 2 ( P E T C O 2 ) during the first 2 rain of 50-W constant-intensity exercise, in normoeapnia (N) and in hypoeapnia (H). The horizontal lines before exercise onset (time = 0) represent the average values calculated over
the last 30 s before exercise onset. Each panel gives the results of one test for each Of six subjects
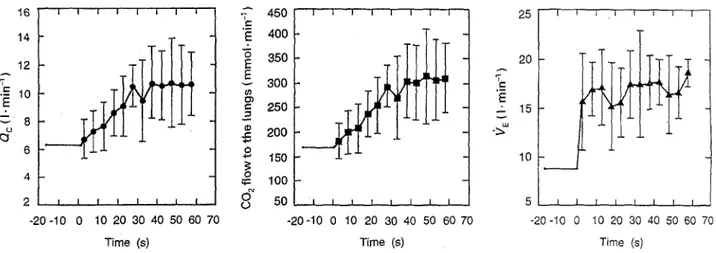
Fig. 3 Average time courses of O2 uptake 0202) and COz output (l;'COa) following the onset of 50-W exercise in normocapnia. The horizontal lines before exercise onset
(time = 0) represent the average values calculated over the last 30 s before exercise onset. Bars
indicate standard deviations
1.2 I I I 1 I | I I 1.0 0.2 - 0.0 1 I L I t t I - 2 0 - 1 0 0 10 20 30 40 50 60 70 Time (s) ~-" 0.8 r - E -- 0.6 o ~ "~ 0.4 1 . 2 1.0 0.8 'E= ::. 0.6 o " o.4 0.2 0.0 I I 1 I I 1 I I I I t l I - 2 0 - 1 0 0 10 20 30 40 50 60 70 Time (s)
decreased even below 80 m m H g (10.7 kPa) and the response. The size of ph I was not significantly Pm-COa continued to increase. It was only when different between N and H, and was independent of the PETCO2 reached about 40 m m H g (5.3 kPa) (Fig. 2) exercise intensity. By contrast, the duration of ph I was that l)'r increased again (start of ph II). The average longer in H than in N. The time elapsing from the end amplitude and duration of ph I for all subjects and all of ph I-~nd the start of ph II in H, calculated from the conditions are shown in Table 2, together with the 5-min exercise tests, was 30.0 (SD 6.4)s, and did not corresponding average P~a-O2 and P~TCO2 throughout vary with the exercise intensity. The P~TCOz at the
Table 2 Characteristics of the first phase ventilatory response to exercise (ph 1). See text for details. PETO2, PrTCO2 End partial pressure of oxygen and carbon dioxide, respectively
Normocapnia Hypocapnia Power (W) 50 100 150 50 100 150 Duration (s) Mean 25.5 22.6 21.3 27.3 22.9 21.6 SD 3.8 4.1 2.4 2.9 4.7 4.5 Amplitude (I-min- 1) Mean 16.8 17.2 22.3 2 0 . 2 21.6 20.1 SD 3.1 3.1 3.7 4.1 8.8 9.4 Time to peak (s) Mean 8.1 11.6 11.6 8.1 7.0 7.8 SD 1.8 3 . 2 5.0 2.8 2.1 2.7 PETO 2 (mmHg) Mean 105 106 108 113 116 113 SD 5 5 4 7 5 7 PETCO2 (mmHg) Mean 40 39 38 29 28 30 SD 3 3 2 4 2 4 start of ph II was 39.6 (SD 3.1)mmHg [5.3 (SD 0.41) kPa].
Q~ and C O 2 flOW to the lungs
Individually calculated values for ()~ and for the C O 2
flow to the lungs during the 1st rain of exercise, and the corresponding VE response curves, are shown in Fig. 4 (50 W, N mode). The CO2 flow to the lungs at rest varied between 130 and 2 0 0 m m o l ' m i n -1, attaining about 300-350 mmol" rain- 1 at steady state. In the few measurements carried out in the H mode, CO2 flow to
the lungs at rest was approximately halved, and was still lower than in N after 5 rain of exercise. In contrast to 12E, which increased abruptly at onset of exercise (ph I), CO2 flow to the lungs over the first 10-15 s of exercise did not change substantially, both in N and in H, even though the trend was towards a slight increase. In any case, no correlation between CO2 flow to the lungs and 12E could be observed during ph I (r = 0.22; P = 0.28; n = 27) in the subjects on whom a simulta- neous determination of these two parameters was ob- tained.
Discussion
Reliability of 0o measurements
There are only two techniques that can provide, nonin- vasively, (~c or SV bbb, these are impedance cardiogra- phy and Doppler ultrasound techniques. Both tech- niques as a result of the underlying principles are in- direct, and thus, in this respect there is no clear advant- age of one over the other. Indeed, there are common problems for both techniques, which may not be rel- evant for measurements at rest but may become impor- tant during exercise, mainly because of body move- ments. For the impedance technique it is mainly the movement of the electrodes that can cause artefacts, whereas for the Doppler technique placement and stab- ility of the Doppler probe becomes increasingly difficult during exercise. As a consequence, Qc measurements in the present study were restricted to moderate exercise (50 W), in which the movements of the upper part of the body were limited, and therefore did not significantly interfere with the measurements. The reliability of Z as an indirect index of 0~, even during exercise, has been supported by numerous studies (e.g. Kobayashi et al.
16 14 12 • -= 10 E 8
.ff
I 6 4 2 m I -20 -10 0 I I I I I I I 'T 450 e.,' "~ 400 3 5 0 300 250 2 0 0 o 1so 0 ~ 100 o ~ o & .2. I 1 I I I I 1 I 50 I I t t, t I I I - 2 0 - 1 0 0 10 20 30 40 50 60 70 Time (s) 25 I 20 15 10 5 I I - 2 0 - I 0 0 I 1 I I 1 I 1 I I I [ t I f I I i t I 10 20 30 40 50 60 70 10 20 30 40 50 60 70 Time (s) Time (s)Fig. 4 From left to right, cardiac output (0o), CO2 flow to the lungs and pulmonary ventilation (12r) as a function of exercise time (50 W in normocapnia). The horizontal lines before exercise onset (time = 0) represent the average values calculated over the last 30 s before exercise onset. Bars represent standard diviations. Data are from the three subjects who underwent simultaneous determinations of Qc and i?E. The 0c and CO2 flow represent average values calculated over one breathing cycle
1978; Edmunds et al. 1982; Hatcher and Srb 1986; Niizeki et al. 1989). What matters for the present study is that the relative changes (compared to the resting baseline) of 0~ were properly followed, the absolute values being less important. Indeed, the results would be essentially the same if the changes of Z, rather than the calculated SV, were used as an indirect index of Q.c. In any case, the marked disparity of CO2 flow and VE time courses at the onset of exercise (see below) would be preserved.
The kinetics of (~ reported in the present study appear somewhat slower than those described by Cum- min et al. (1986) and by Yoshida et al. (1993), but substantially confirm previous results that have been obtained by other authors by means of impedance cardiography (Miyamoto et al. 1982; Morikawa et al. 1989) or Doppler ultrasound techniques (Adams et al. 1987).
On the origin of the ph I ventilatory response to exercise
In N, initiated from rest in the upright posture, ph I appeared in more than 95% of the trials and lasted for a few breathing cycles. Its amplitude was invariant with exercise intensities from 50 W to 150 W. These obser- vations do not fully confirm previous results which have been obtained by Asmussen and Nielsen (1948), by Dejours et al. (1961) and by Pearce and Millhorn (1977), who have observed a slight increase in the amplitude of ph I with increasing exercise intensity. The present results suggest that ph I may be an all or nothing type of response. As to the constancy of the size of ph I, preliminary results obtained in our laboratory indicate that the inertia encountered by the subject at the very beginning of pedalling is essentially indepen- dent of the imposed (50-150 W) exercise intensity. Con- sequently, a similar initial strain on the muscles could be expected. This might explain why the ph I magni- tude does not change with the exercise intensity. The mean size of the ph I in N was not significantly different from that in H. This finding is in contrast with the results of Asmussen (1973), who has failed to detect ph I after voluntary hyperventilation in Oz in 2 subjects. Also Ward et al. (1983) have found that ph I was drastically reduced after voluntary hyperventilation. On the other hand, they are in agreement with earlier results of Lefran~ois and Dejours (1964), who have shown that after hyperventilation ph I is independent of the initial PACO2 level. The apparent discrepancies regarding ph I following hyperventilation could be due in part to a difference in measurement accuracy (Asmussen 1973), or possibly to differences in the pro- cedure adopted for data averageing. Also the shorter interval (15-20 s) imposed between the end of hyper- ventilation and exercise onset by Ward et al. (1983) may be of importance.
With regard to the origin of ph I, recent experimental evidence from animals or humans carrying an artificial heart set at given (~c levels (Huszczuk et al. 1990; Marconi et al. 1991) has argued against the effec- tiveness of mechanical cardiodynamic receptors, such as those hypothesized by Jones et al. (1982). On the other hand, according to Wasserman et al. (1974, 1986), ph I could be elicited by an augmented COz flow to the lungs, as a consequence of the sudden increase in ()c at the onset of exercise. This hypothesis is contradicted by the present results. Indeed, in~ contrast to tTE, at the onset of constant-intensity exercise CO2 flow to the lungs did not increase significantly during ph I, and therefore cannot be held responsible for the 12E in- crease. This was particularly evident in H, a condition in which, despite a drastic reduction in CO2 flow to the lungs, ph I was no different from that in N.
As mentioned above, the method used in the present study for the BbB assessment of gas exchange did not correct for changes of pulmonary gas stores in between breaths. This could potentially lead to some errors in the determination of BbB I)COz, which we used for the estimation of CvCOz (Eq. 3). However, the risk of intro- ducing significant errors should be minor, if we con- sider that, as has been shown by di Prampero and Lafortuna (1989), changes in pulmonary CO2 stores do not significantly affect BbB I?CO2, at variance with what has been described for pulmonary 02 stores and
g o 2.
The present evidence against a humoral origin of ph I strengthens the hypothesis that neural mechanisms are responsible for it. It has been shown that the firing of cortical and/or subcortical (hypothalamic) motor centres during constant-intensity exercise is maintained after the onset of exercise (Eldridge et al. 1985). This being the case, the present results would appear more compatible with the hypothesis of an exercise reflex control of ph I, rather than of a central command mechanism. In fact:
1. The initial rise of I/E was followed by a marked dropl particularly in H;
2. A considerable time lag between the end of ph I and the beginning of ph II was found in H.
The observed ph I may indeed be qualitatively related to the input from group III spinal afferent fibres in response to muscle contraction. In fact, this response is characterized by a strong initial firing activity, followed by rapid adaptation. The latter has been shown to be completed in the cat within 20 s of the contraction period (Kaufman et al. 1983), and seems therefore com- patible with the time course of ITE during ph I, as described in the present study.
The results of the present study are substantially compatible with the neuro-humoral hypothesis pro- posed by Dejours (1963). According to this author the ventilatory response to exercise has a dual origin: a fast, short-lasting neural phase, followed by a chemic- ally-driven response elicited by the work-dependent
increase in blood PCO2. A novel finding from this study is the clear-cut temporal dichotomy between the fast and the slow components of the I?E response to exercise, never detected so clearly in previous studies. Indeed, the ventilatory increase during phase I was reversed after a few seconds following onset of exercise. In N this tendency was masked in part by the incoming slow component of ventilation (ph II), but when exer- cise was preceded by voluntary hyperventilation (H) a complete temporal dissociation between the fast and the slow components of the I)'E response to exercise became evident.
In conclusion, the results of the present study will appear to be against the hypothesis of a metabolic (CO2 fl0w to the lungs) control of ph I. Concern- ing the neural origin of ph I, they would appear
compatible with a reflex drive of the type exercise
reflex, rather than with a central command control
mechanism.
Acknowledgements. The authors thank Dr. Pierre Dejours and Dr. Sukhamay Lahiri for constructive criticism, Mr. Angelo Colombini and Mr. Christian Moia for technical assistance. This work was partially supported by Grant no. 3228719.90 of the Fonds National Suisse for the Scientific Research, and by the Carlos and Elsie De Reuter Foundation, Geneva, Switzerland.
References
AdamsL, Guz A, Innes JA, Murphy K (1987) The early circulatory and ventilatory response to voluntary and electrically induced exercise in man. J Physiol (Lond) 383:19-30
Asmussen E (1973) Ventilation in the transition from rest to exercise. Acta Physiol Scand 89:68-78
Asmussen E, Nielsen N (1948) Studies on the initial changes in respiration at the transition from rest to work and from work to rest. Acta Physiol Scand 16:270-285.
Cummin ARC, Iyawe VI, Mehta N, Saunders KB (1986) Ventilation and cardiac output during the onset of exercise, and during voluntary hyperventilation in humans. J Physiol (Lond) 370: 567-583
Dejours P (1963) The regulation of. breathing during muscular exercise in man. A neuro:humoral theory. In: Cunningham DJC, Lloyd BB (eds) The regulation of human respiration. Blackwell, Oxford, pp 535-547
Dejours.P, Flandrois R, Lefrangois R, Teillac A (1961) l~tude de la r6guli~tion de la ventilation au cours de l'exercice musculaire chez l'homme. J Physiol (Paris) 53:321-322.
Dill DB, Edwards HT, Consolazio WV (1937) Blood as a physico- chemical system.XI. Man at rest. J Biol Chem 118:635-648 di Prampero PE, Lafortuna CL (1989) Breath-by-breath estimate of
alveolar gas transfer variability in man at rest and during exer- cise. J Physiol (Lond) 415:459-475
Edmunds AT, Godfrey S, Too!ey M (1982) Cardiac output measured by transthoracic impedance cardiography at rest, during exercise and at various lung volumes. Clin Sci 63:107-113
Eldridge FL, MiUhorn DE, Kiley JP, Waldrop TG (1985) Stimula- tionby central command of locomotion, respiration and circula- tion during exercise. Respir Physiol 59:313-337
Hatcher DD, Srb OD (1986) Comparison of two noninvasive tech- niques for estimating cardiac output during exercise. J Appl Physiol 61:155-159
Huszczuk A, Whipp B J, Adams TD, Fisher AG, Crapo RO, Elliott CG, Wasserman K, Olsen DB (1990) Ventilatory control during exercise in calves with artificial hearts. J Appl Physiol 68: 2604-2611
Jones NL, Robertson DG, Kane JW (1979) Difference between end-
tidal and arterial PCOz in exercise. J Appl Physiol 47:954-960
Jones PW, Huszczuk A, Wasserman K (1982) Cardiac output as a controller of ventilation through changes in right ventricular load. J Appl Physiol 53:218-224
Kaufman HP, Longhurst JC, Rybicki K J, Wallach JH, Mitchell JH (1983) Effects of static muscular contraction on impulse activity of groups III and IV efferents in cats. J Appl Physiol 55:105-112 Kobayashi Y, Andoh Y, Fujinami T, Nakayama K, Takada K, Takeuchi T, Okamoto M (1978) Impedance cardiography for estimating cardiac output during submaximal and maximal work. J Appl Physiol 45:459-462
Krogh A, Lindhard J (1913) The regulation of respiration and circulation during the initial stages of muscular work. J Physiol (Lond) 47:112-136
Kubicek WG, Karnegis JM, Patterson RP, Witsoe DA, Mattson RH (1966) Development and evaluation of an impedance cardiac output system. Aerospace Med 37:1208-1212
Lefran~ois R, Dejours P (1964) l~tude des relations entre stimulus ventilatoire gaz carbonique et stimulus ventilatoire neur- og6niques de l'exercice musculaire chez rhomme. Rev F r Etud Clin Biol 9: 498-505
Marconi C, Grassi B, Meyer M, Cabrol A, Cabrol C, Cerretelli P (1991) Ventilatory and gas exchange kinetics in a human recipient of a Jarvik-7 total artificial heart (Letter to the Editor). J Appl Physiol 70:1406-1407
McCloskey DI, Mitchell JH (1972) Reflex cardiovascular and respir- atory responses originating in exercising muscles. J Physiol (Lond) 224:173-186
Miyamoto Y. Hiura T, Tamura T, Nakamura T, Higuchi J, Mikami T (1982) Dynamics of cardiac, respiratory and metabolic function in men in response to step work load. J Appl Physiol 52:1198-1208
Morikawa T. Ono Y, Sasaki K, Sakakibara Y, Tanaka Y, Maruyama R. Nishibayashi Y. Honda Y (1989) Afferent and eardiodynamic drives in the early phase of exercise hyperpnea in humans. J Appl Physiol 67:2006-2013
Niizeki K, Miyamoto Y, Doi K (1989) A comparison between cardiac output determined by impedance cardiography and the rebreathing method during exercise in man. Jpn J Physiol 39: 441-446
Pearce DH, Millhorn HT Jr (1977) Dynamic and steady-state respir- atory responses to bicycle exercise. J Appl Physiol 42:959-967 Ward SA, Whipp BJ, Koyal S, Wasserman K (1983) Influence of
body CO2 stores on ventilatory dynamics during exercise. J Appl Physiol 55: 742-749
Wasserman K, Whipp B J, Castagna J (1974) Cardiodynamic hyper- pnea:hyperpnea secondary to cardiac output increase. J Appl Physiol 36:457-464
Wasserman K, Whipp B J, Casaburi R (1986) Respiratory control in exercise. In: Cherniack NS, Widdicombe JG (eds) Handbook of physiology, section 3. The respiratory system, vol. II. American Physiological Society, Washington, DC, pp 595-619
Whipp BJ ~ 1987) The control of exercise hyperpnoea. In: Whipp BJ (ed) The control of breathing in man. Manchester University Press, London. pp 87-118
Whipp B J, Ward SA (1980) Ventilatory central dynamics during muscular exercise in man. Int J Sports Med 1:146-159 Yoshida T, Yamamoto K, Udo M (1993) Relationship between
cardiac output and oxygen uptake at the onset of exercise. Eur J Appl Physiol 66:155-160
Zuntz N, Geppert J (1886) Uber die Natur der normalen Atemreize und den Oft ihrer Wirkung. Pflfigers Arch 38:337-338