M.Benedetti is with University of Rome “Tor Vergata”, Faculty of
Engineering, Department of Mechanical Engineering, Quantum Electronics and Plasma Physics Research Group, Via del Politecnico 1, 00133 Rome, Italy (corresponding author phone: 0039 0672597196; fax: 0039 0672597207; e-mail: [email protected]).
P.Gaudio is with University of Rome “Tor Vergata”, Faculty of
Engineering, Department of Mechanical Engineering, Quantum Electronics and Plasma Physics Research Group, Via del Politecnico 1, 00133 Rome, Italy (corresponding author phone: 0039 0672597209; fax: 0039 0672597207; e-mail: [email protected]).
I.Lupelli is with University of Rome “Tor Vergata”, Faculty of
Engineering, Department of Mechanical Engineering, Quantum Electronics and Plasma Physics Research Group, Via del Politecnico 1, 00133 Rome, Italy (corresponding author phone: 0039 0672597196; fax: 0039 0672597207; e-mail: [email protected]).
A.Malizia is with University of Rome “Tor Vergata”, Faculty of
Engineering, Department of Mechanical Engineering, Quantum Electronics and Plasma Physics Research Group, Via del Politecnico 1, 00133 Rome, Italy (corresponding author phone: 0039 0672597196; fax: 0039 0672597207; e-mail: [email protected]).
M.T. Porfiri is with ENEA UTFUS-TEC (Fusion Safety & Environment)
Via Enrico Fermi, 45, 00044 Frascati (Roma), Italy. (corresponding author phone: 0039 0694002654; e-mail: [email protected]).
M.Richetta is with University of Rome “Tor Vergata”, Faculty of
Engineering, Department of Mechanical Engineering, Quantum Electronics and Plasma Physics Research Group, Via del Politecnico 1, 00133 Rome, Italy (corresponding author phone: 0039 0672597197; fax: 0039 0672597207; e-mail: [email protected]).
Abstract
A recognized safety issue for future fusion reactors fueled with deuterium and tritium is the generation of sizeable quantities of dust. Activated dust mobilization during a Loss of Vacuum Accidents (LOVA) is one of the safety concerns for the International Thermonuclear Experimental Reactor (ITER). Intense thermal loads in fusion devices occur during plasma disruptions, Edge Localized Modes (ELM) and Vertical Displacement Events (VDE). They will result in macroscopic erosion of the plasma facing materials and consequent accumulation of activated dust into the ITER Vacuum Vessel (VV). In order to perform thermo-fluid dynamic analysis a small facility, Small Tank for Aerosol Removal and Dust (STARDUST), was set up at the University of Rome “Tor Vergata”, in collaboration with ENEA Frascati laboratories. This facility simulates low pressurization rates (100Pa/s, 300 Pa/s and 500 Pa/s) due to LOVA events in ITER due to a small air inlet at different internal pressure conditions and wall temperatures. The authors will present the experimental results in order to analyze the influence of different pressurization rates in the variation of thermo-fluid dynamic conditions that are strictly connected to dust mobilization.
Keywords — ITER; Velocity; Flow Field, LOVA; Pressurization rate ; STARDUST.
I. INTRODUCTION
This work takes ITER as reference machine because it is the most interesting project in the fusion safety field for its safety concerns and lay out. Intense thermal loads in fusion devices occur during plasma disruptions, Edge Localized Modes (ELM) and Vertical Displacement Events (VDE). They will result in macroscopic erosion of the plasma facing materials and consequent accumulation of activated dust in Vacuum Vessel (VV). In ITER it is foreseen that the continuous first wall erosion caused by plasma disruptions and the bumps of the plasma during the operation induce the formation of mobilizable materials, in shape of radioactive dust [1]. The safety limit for dust inside the ITER Vacuum Vessel (VV) has been proposed to the safety authorities to be 1000 kg, without any precision on the composition. However, it is settled also a “hot dust” limit (defined as the dust on surfaces with
Scaled experiment for Loss of Vacuum
Accidents in nuclear fusion devices:
Experimental methodology for fluid-dynamics
analysis in STARDUST facility.
T>400°C) of 6 kg each of C, Be and W [2]. These administrative limits have been fixed to avoid, also in case of severe accident, the evacuation of the population from the area surrounding the plant [2] because the consequent calculated releases should cause doses below the limits according the current recommendations of the International Commission on Radiological Protection. In case of LOVA [3], air inlet occurs due to the pressure difference between the atmospheric condition and the internal condition. A LOVA event causes mobilization of the dust that can exit the VV, threatening public safety because it contains tritium, it is radioactive from activation products, and may be chemically reactive and/or toxic [1]. Several experiments with STARDUST facility have been conducted to reproduce a low pressurization rates LOVA [3] event in ITER due to a small air leakage for one position of the leak, at the equatorial port level in order to evaluate the influence of flow field and temperature on dust resuspension. The pressurization rate of 300 Pa/s is the estimated consequence of a 0,02 m2 wide breach during the first seconds
of a LOVA, as defined by Generic Site Specific Report (GSSR) [4].In these work have been considered different flow rates in order to evaluate the effects due to several accidental conditions. The authors will present and discuss experimental results.
II. STARDUST
STARDUST (Figure1) is a small facility, set up in the ENEA laboratories of Frascati (by Fusion Technology Department) in collaboration with the Research group of Quantum Electronics and Plasma Physics of University of Rome “Tor Vergata” and represents a section, in scale, of ITER Vacuum Vessel. STARDUST is a stainless steel tank with a cylindrical shape in made to reproduce LOVAs and analyze the behavior of dust due to these accidents.[5] The functional scheme of STARDUST is showed in Figure 1.
Fig. 1 STARDUST
In STARDUST the main objective is to reproduce LOVAs as those expected in ITER for sealing failures and to obtain, by means of the comparison among experimental and numerical data, the basis for a mathematical model suitable to simulate dust behavior in such accidents. [5,6,7]. The main geometrical features of STARDUST facility are showed in the table that follows (Tab.1):
External length of the tank (mm) 920 External diameter of the tank (mm) 506 External diameter of the lids (mm) 570 Thickness of the tank’s wall (mm) 5
Thickness of the lid (mm) 14
Quartz lateral windows : distance from the pipe inlet (center of the window) (mm)
182 Diameter of the lateral quartz windows (mm) 84 Diameter of the frontal quartz window in the mobile lid (mm)
79 Internal volume of the tank (m3) 0,17
Tab.1 STARDUST geometrical features
Now the Labview software to manage hardware and acquire data will be briefly explained in order to understand how is possible reproduce LOVA with STARDUST.
1. The program asks to the user to switch on the heaters that regulate the electrical resistances wrapped around STARDUST wall (for warm experiments, at walls temperature of 120-130 °C), in case of cold experiments (environmental temperature) the heaters will not be switched on;
2. The pneumatic-valve relay is automatically activated and the valve is open;
3. The program reminds the user to open the vacuum valve;
4. Now the achievement of boundary condition is started, and the user can monitor the temperature and pressure conditions and the values of flow rate trough the flow meter by the display showed in figure 22 and automatically open by the program (this display takes data by the input cards and show it in continuum mode).
5. When the boundary conditions are reached (Pinternal=100 Pa or 1000 Pa and T = 25°C (cold
experiments) and T=120-130 °C (hot experiments)) the program automatically closes the pneumatic-valve stopping the air extraction by vacuum pump; 6. The program asks to the users the valve used (A) and
the path-file for the data storage;
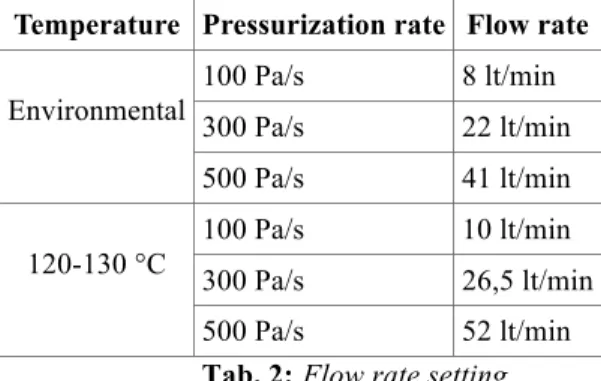
7. Automatically feed valve is opened (by external relay controlled by internal relay by the program) and by the analogical output card a voltage signal is sent to the flow meter to activate the air compressed flowing trough valve A. The air flows with a pressurization rate of 100Pa/s or 300 Pa/s or 500 Pa/s, obtained with the flow rates showed in table 2;
Temperature Pressurization rate Flow rate Environmental 100 Pa/s 8 lt/min 300 Pa/s 22 lt/min 500 Pa/s 41 lt/min 120-130 °C 100 Pa/s 10 lt/min 300 Pa/s 26,5 lt/min 500 Pa/s 52 lt/min
Tab. 2:Flow rate setting
The sensor dotation of STARDUST is:
i. For internal pressure measurements: Three pressure
gauges placed on [5,6,7] the top of STARDUST (as showed in Fig. 2)
• Leybold Heareus Barometer;
• BOC EDWARDS ASG-2000-NW16 pressure gauge;
• Alcatel AP 1004 Pirani. pressure gauge
Fig.2: Pressure gauges positions
ii. For temperature measurements: four thermocouples
J type
iii. For velocity measurements: Two XCE-093-2D
[8,9,10] Kulite pressure transducers (after called PT 455 and PT 461) that area pressure detector realized with a monolithic piezo-resistive sensor in silicon that works in a temperature range from -55 to 273 °C, even if the pressure transducer operations are optimized for the temperature range from 25 °C to 235 °C (and it allows the measurements in our experimental conditions).
The velocity values are obtained by an empirical equations that follows [6]: 1 __
2
1
(
1)
s sP
P
RT
v
M
P
γ γγ
γ
− Δ⎡
⎤
⎛
+
⎞
⎢
⎥
=
⎜
⎟
−
⎢
⎥
−
⎝
⎠
⎢
⎥
⎣
⎦
Where:Ø γ : ratio of the fluid specific heat at constant pressure to the fluid specific heat at constant volume (cp/cv)
and is approximately 1.4 for air;
Ø R : universal gas constant (8,314 J K−1 mol−1 ) ;
Ø
T
__ : mean temperature ;Ø M : air molecular mass (28,968 g/mol); Ø Ps : static pressure ;
Ø PΔ: differential pressure (PΔ = PT - Ps).
Ø PT : total pressure
8.
Immediately after the flow rate activation (the time depends by time machine time) the acquisition starts, and the data are stored in a file (with a frequency of 50 Hz) in the following order :a. Acquisition number;
b. Pressure transducer value (PT455); c. Pressure transducer value (PT461); d. Pressure transducer value (PT464); e. Pressure value;
f. Temperature value of thermocouple n°2; g. Temperature value of thermocouple n°3; h. Temperature value of thermocouple n°4; i. Flow rate value.
When the internal pressure of 95000 Pa is achieved the program automatically allows the closure of flow meter and the experiment is over. After these data acquisition, by a MATLAB software, all data are elaborated in order to obtain velocity values and velocity errors.
III. EXPERIMENTAL SET-UP
In the previous sections has been explained how it is possible to reproduce a LOVA with STARDUST. The STARDUST set up has been used to make experimental campaigns.
Experimental protocol: Velocity mapping in STARDUST
during a LOVA reproduction, trough valve A under the experimental conditions showed in table 2 and following the experimental path showed in Figure 3;
Compressor on Heaters on (For hot experiments)
Pneumatic valve Open Vacuum Valve Open Vacuum Valve Open Pressure : 100 Pa and 1000 Pa Temperature: 25°C or 110 °C Pneumatic Valve Closed Vacuum Pump Closed Valve A or B Open
Flow Meter open
Pressurization rates:
100Pa/s, 300 Pa/s, 500 Pa/s Data Acquisition
Start
Air flow inlet Start ACQUIRED VALUES •INTERNAL PRESSURE •WALL TEMPERTAURE •TANK TEMPERATURE •FLOW RATE Pressure 95000 Pa Flow meter and Valves Closed Data stored
Fig.3: STARDUST functional scheme for LOVA reproduction
In the following section the experimental setup for experimental campaign will be explained. To map the velocity flow values in the tank the sensor has been placed inside a circular support system (Fig.4) that has been placed in several sections of the tank to obtain a velocity mapping.
Fig.4: Pressure transducer support
The support has been positioned at several distances from the valves air inlet positions
• 4 cm; • 22,75b cm; • 45,5 cm • 68,25 cm.
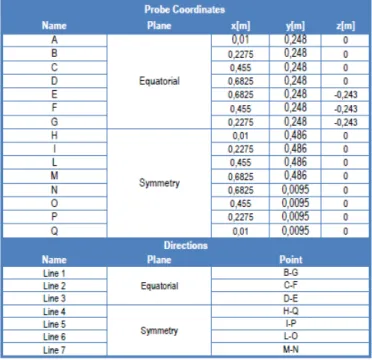
The pressure transducers are placed inside the tank, on these support, on the points reported on Table 3 and Figure 5.
Tab. 3 Pressure transducers positions
Fig.5 Pressure transducer scheme
The pressure transducer 455 has been placed on points A,B,C,D with the sensible element on the valve A (facing the flow field air flux) as in figure 6 that represents the verse of transducers on line I-P positions B (PT 455), and P (PT 461).
Fig.6 Versus of PTs
The pressure transducer 461 has been placed on the other points (by rotating the support) with the sensible element on the lid (facing the flow field air re-flux). For each positions the experiments have been repeated for each of the configuration reported in table 2, in both maintenance conditions (Twalls : 25
°C) and operative conditions (Twalls : 120-130 °C) and with
both the initial pressure conditions considered (100 Pa and 1000 Pa). All the parameters are stored, when the internal pressure equals the external ones, the acquisition stop and a file.dat is stored with all the parameters showed before.
IV. EXPERIMENTAL RESULTS
The previous experimental campaigns and numerical simulations [9,10] have put in evidence that the first 3-4 seconds are the most important for dust resuspension in case of LOVA (almost all dust resuspendend in these seconds). In these period the mean temperature for hot experiments and cold experiments doesn’t change substantially (in Fig. 7 is showed the mean temperature in the first 5 second for a cold experiment with an initial pressure of 100 Pa and a pressurization rate of 100 Pa/s).
Fig.7 Mean Temperature 100Pa_100Pa/s_cold experiment
The other experimental evidence is that the flow rate has been changed in order to obtain the pressurization rates (100 Pa/s, 300 Pa/s and 500 Pa/s) to simulate different LOVAs.
By passing from experiments with wall temperature of 120-130 °C to 25 °C (Tab. 2) is it possible observe that the flow rate has to be reduced of 20% to obtain the same pressurization rate. The velocity flow field for every single point of Fig. 5 has measured for each of the experimental set-up. In the figure that follows (Fig. 8 ) there is the graph of velocity for the first 5 seconds.
Fig.8 Mean Temperature 100Pa_100Pa/s_cold experiment
After the analysis of all the experimental data, the comparison of maximum velocity values measured by the pressure transducer placed as figure 6 in different point on the same lines. The figures that follows (Fig.9 and Fig.10) shows a comparison between velocity values measured (with an initial pressure of 100 Pa, a pressurization rate of 100 Pa/s and Twall=25 °C) on:
• the central line by PT 455 (Points : A-B-C-D) (Fig. 9);
Fig.9 Velocity comparison at 100Pa_100Pa/s_cold experiment for central line
• the inferior line by PT 461 (Points : Q-P-O-N) (Fig.10);
TIP OF ARROW : HEAD OF PT 455
TIP OF ARROW : HEAD OF PT 461 0 1 2 3 4 5 260 270 280 290 300 310 320 330 Time (s) Mean temperature M ea n t em pe ratu re ( K) 0 1 2 3 4 5 0 100 200 300 400 500 600 Velocity 4 55 sm oo thing (m /s) Time (s) Velocity 455 smoothing A -- -- -- B -- -- -- C -- -- -- -- D 100 200 300 400 500 600
Max velocity smoothing 455 (mean)
M ax ve locity sm oo thing 45 5 ( m ea n) (m /s) Point
Fig.10 Velocity comparison at 100Pa_100Pa/s_cold experiment for inferior line
V. CONCLUSION
For all the experiments is it possible observe that:
• the velocity values measured by PT 455 on the central line decrease of 20-25% passing from position near air inlet to the lid;
• the velocity values measured by PT 461 on the central line increase of 20-25% passing from position near air inlet to the lid;
• At the same distances from the valve the maximum velocity values measured on the central line are almost 20% higher than the the ones measured on the other lines;
• The maximum velocity values measured on the same point by the same PT are almost 15-20 % higher in case of hot experiments (in operative conditions). • The maximum velocity values are measure almost
between the time of 1s and 2s in accordance with other experimental campaigns and simulations [5,6,7,8,9,10];
• The initial pressure inside the chamber (100 Pa or 100 Pa) doesn’t influence critically the maximum velocity values measured.
VI. FUTURE DEVELOPMENTS
The numerical simulations, in order to simulate the experiments explained, are in progress. The numerical results will be compared with experimental ones in order to validate the model and the consideration explained.
VII. BIBLIOGRAPHY
[1] C. Bellecci, P. Gaudio, I. Lupelli, A. Malizia, M.T. Porfiri, M. Richetta. Dust mobilization and transport measures in the STARDUST facility, EPS2008 Proceedings, 35th EPS Conference on Plasma Phys. Hersonissos, 9 - 13 June 2008 ECA Vol.32, P-1.175 (2008).
(http://epsppd.epfl.ch/Hersonissos/pdf/P1_175.pdf)
[2] M.T. Porfiri, N. Forgione, S. Paci, A. Rufoloni, Dust mobilization experiments in the context of the fusion plants – STARDUST facility, Fusion Engineering and Design 81 (2006) 1353-1358.
[3] E. Eberta, J. Raeder, LOCA, LOFA and LOVA analyses pertaining to NET/ITER safety design guidance, Fusion Engineering and Design 17, (1991) Pages 307-312.
[4] ITER-JCT Generic Site Safety Report N84 Garching (Germany), July 2001
[5] C Bellecci, P Gaudio, I Lupelli, A Malizia, M T Porfiri, R Quaranta, M Richetta, “STARDUST experimental campaign and numerical simulations: Influence of obstacles and temperature on dust resuspension in a Vacuum Vessel under LOVA”, Nuclear Fusion, IOPscience, 2010, Nucl. Fusion 51 (2011) 053017, 27/04/2011 (http://stacks.iop.org/0029-5515/51/053017)
[6] C Bellecci, P Gaudio, I Lupelli, A Malizia, M T Porfiri, R Quaranta, M Richetta, “Loss of Vacuum Accident (LOVA): Comparison of Computational Fluid Dynamics (CFD) flow velocities against experimental data for the model validation”, Fusion Engineering and Design, Elsevier, 2010, publication on-line complete.
[7] P Gaudio, A Malizia, I Lupelli, “RNG k-ε modelling and mobilization experiments of loss of vacuum in small tanks for nuclear fusion safety applications”, International Journal of Systems Engineering, Applications and Development, WSEAS, ISSN:2074-1308, Issue 1, Volume 5, 2001 (pag.287-305).
[10] P.Gaudio, A.Malizia, I.Lupelli, “Experimental and Numerical Analysis of Dust Resuspension for Supporting Chemical and Radiological Risk Assessment in a Nuclear Fusion Device” “International Conference on Mathematical Models for Engineering Science (MMES’ 10), Puerto De La Cruz, Tenerife, November 30- December 2, 2010, ISBN 978-960-474-252-3, Electronic Version ISSN: 1792-684X, pag. 134-147. Q 1,58 -- -- -- P 2 -- -- -- -- O 0,54 -- -- N 0,72 --0 100 200 300 400
Max velocity smoothing 461
M ax ve locity sm oo thing 46 1 ( m /s)