Rapporto CEIS-Sanità 2008: la Sanità delle regioni: bilancio e prospettive a sette anni dalla riforma del Titolo V e alla vigilia del federalismo fiscale
358
0
0
Testo completo
(2) The 6th publication of CEIS , University of Tor Vergata- Rome, is the result of a public-private partnership. This partnership flanks CEIS with organizations which believe in the necessity of supporting stakeholders of the healthecare system and offering policymakers access to knowledge. The publication and circulation of the volume to healthecare operators and experts has been made possible thanks to the financial support and commitment of : •. A.N.I.A.. •. Boehringer Ingelheim Italia. •. GlaxoSmithKline Italia. •. J&J Medical Holding. •. Pfizer Italia S.r.l.. •. TEVA Pharma Italia S.p.A.. The partners in this initiative share with CEIS Sanità the necessity to offer elements that are necessary when taking rational decisions both to the operators in the sector and to politicians; offering business administrations the necessary information to improve their programming and organizational levels; as well as offering citizens and their associations some elements for understanding the system’s performance. The Report (which has been conceived, planned and accomplished in the dual Italian/English version) collects the work carried out by CEIS Sanità researchers, and other experts in the sector.. 1.
(3) Index Difference and Uniformity: where Efficiency ends and Equity begins (or vice versa). 6 1 - Financing healthcare: an overview 1.1 Financing healthcare in OECD countries 1.2 SSN funding and gross profit in Italy 1.3 Regional Health Services funding and gross profits 1.4 The allocation of healthcare resources. 16 18 23 28 33. Bibliography. 43. 2 - The hospital care system 44 2.1 Hospitals and beds 51 2.2 Medical imaging and diagnostic equipment (MIDE) 62 2.3 Human resources 65 2.3.1 Public hospital staff 70 2.4 Acute cases healthcare 74 2.4.1 Hospitalization rates in acute cases 74 2.4.2 Average hospital stay and case-mix 85 2.4.3 Value of production 87 2.4.4 Appropriateness 93 2.4.5 Tariff policies 95 2.5 Rehabilitation healthcare 100 2.5.1 Hospitalization rates 100 2.5.2 Average hospital stay 103 2.5.3 The value of production 104 2.6 Long-term healthcare 104 2.6.1 The need 104 2.6.2 Average hospital stay 107 2.6.3 The value of production 107 2.7 Hospital in-patient care expenditure in OECD countries 108 2.8 An estimate of total in-patient hospital expenditure 111 2.9 Expenditure trends for private hospitals accredited by the National Health System 114 Focus: Organ transplantation in Italy: A regional analysis of transplant demand and supply 2.A.1. Transplant supply 2.A.2 Transplant demand 2.A.3 Outcome of the estimates and open problems. 119 120 121 129. 2.
(4) Bibliography. 133. 3 - The Emergency Care System in Italy 3.1 The framework legislation 3.2 Facilities and care services 3.3 Cost-sharing charges on emergency room visits. 135 136 137 140. Bibliography. 145. 4 – Residential assistance system: Healthcare Residential Structures. 4.1 Healthcare Residential Structures: characterization 4.2 Healthcare residences 4.3 Data on Healthcare Residences Regions. 146 147 149 153 154. Bibliography. 157. 5 - Pharmaceutical assistance system 5.1 National policies about drugs 5.2 Regional interventions 5.2.1. Pharmaceutical ticket 5.2.2. Direct and ‘on behalf of’ distribution 5.2.3. Prescription limits 5.2.3.1 Prescription limits for Inhibitors of Pump 5.2.3.2 Minimum quotas of generically equivalent drugs 5.3 Expenditure on drugs and medicines: the trends 5.4 National and regional expenditure on drugs and medicines. 158 161 162 162 163 165 165 166 168 170. Bibliography. 177. 6 - The specialist medical assistance system in Italy 6.1 OECD specialist expenditure 6.2 The Requirements 6.3 Medical services 6.4 Offer 6.5 Dimensions of the delivering facilities 6.6 Evolution of specialist medical expenditure financed by the medical insurance plan 6.7 Total specialist medical expenditure (estimate) 6.8 Prescription Charges. 178 181 184 186 192 194 198 202 205. 7 - Health and Social care integration: the Italian regions experience 7.1 Health and Social care integration reforms. 208 208. 3.
(5) 7.2 Devolution and social services provision 7.3 Managed integration: regional and area plans 7.4 Managed integration: models of intervention for social and health care services development 7.5 Concluding remarks. 209 210 211 215. Bibliography. 217. 8 - The Home Care system 8.1 National orientations on the subject of home healthcare 8.2 Home Healthcare in the Regions 8.3 Disability figures in Italy 8.4 Potential ADI offer on the territory 8.5 Resorting to Integrated Home Care 8.6 Health expenditure for ADI (estimate). 219 221 227 230 234 236 238. Bibliography. 240. 9 - Healthcare Spending 9.1 Analysis of healthcare spending in the OECD countries 9.2 The dynamics of healthcare spending in the OECD countries 9.3 The break-down of healthcare spending in the OECD countries 9.4 Public healthcare spending in Italy 9.5 Private spending on healthcare in Italy 9.6 Direct public spending on healthcare functions in Italy 9.7 Public healthcare spending on subsidies for functions in Italy 9.8 An analysis of Healthcare Costs 9.9 Databanks and estimated model 9.10 Forecast of total healthcare spending 9.11 The future development of public and private healthcare spending. 241 246 249 253 254 262 266 274 284 287 290 290. 10 - L’equità nel SSN 10.1 Data and methodology 10.2 Impoverishment and catastrophic payments 10.3 The impact of different kind of out of pocket expenditures. 293 296 296 302. Bibliography. 304. 11 - The impact of the Health National System on economy 11.1 The pharmaceutical industry 11.1.1 The world pharmaceutical industry 11.1.2 The pharmaceutical industry in Italy 11.1.3 The industrial market for generic drugs 11.1.4 Industry of pharmaceutical drugs in Italy 11.2 The medical device manufacturing sector. 306 306 308 313 317 319 321. 4.
(6) 11.2.1 The medical device market worlwide 11.2.2 The European medical device market 11.2.3 Medical device public expenditure in Italy 11.3 The insurance market 11.3.1 The international market 11.3.2 The domestic market 11.3.3 Supplementary insurance cover Bibliography. 322 325 330 332 333 335 336 339. 5.
(7) Report CEIS Sanità 2008 presentation.
(8) Presentation We are very glad to introduce the 6th Publication of the CEIS Report, University of Tor Vergata-Rome, entitled “Regional Health Care. Assessment and Perspective seven years after the costitutional reform and just on the eve of fiscal federalism”. The Report has been born from the work or research that CEIS has been working out for years in the field of healthcare economy, in the economical evaluation of healthcare projects and in the private/public business administrations; this research also increases an intensive post-Lau ream activity and a scientific support to private/public institutions This year too the report wishes to offer that scientific support which is necessary when taking rational decisions both to the operators in the sector and to politicians stressing the most relevant thematics for the realization of the fiscal federalism, maintaining an adequate level of solidarity within the public healthcare system. This year too the Report has been conceived, planned and accomplished in the dual Italian/English version to spread the knowledge of the Italian healthcare system to the international scientific community. Luigi Paganetto. Giovanni Tria. Presidente CEIS. Direttore CEIS. Univ. di Roma Tor Vergata. Univ. di Roma Tor Vergata. 6.
(9) Report CEIS - Sanità 2008 Regional Health Care. Assessment and Perspective seven years after the costitutional reform and just on the eve of fiscal federalism.
(10) Regional Health Care. Assessment and Perspective seven years after the costitutional reform and just on the eve of fiscal federalism.1 The CEIS Health Report is now in its sixth edition. As the Report’s editor, since the first edition, I am of course very pleased about the growing attention it is receiving; I wish to add that the nature of the Report has not changed, its purpose still being to disseminate the results of the research and survey activities carried out by CEIS in the field of health care, in a form that can be easily understood and used by both expert and layperson alike. Some changes, however, have been introduced to the structure of the index, by taking a more organic approach, which will presumably be maintained in the forthcoming editions. Accordingly, the Report addresses first of all the funding of the Italian national health service (NHS); this is followed by an overview of the key health care sectors (Hospital, A&E, Residential, Pharmaceutical, Specialist, Social & Health, Home care), which combines economic and statistical data and regulatory issues; the next section presents an analysis of the financial (and, possibly, economic) effects of the care services, and the related expenditure, but also the equity impact of the system. Finally, the last chapter is dedicated to the principal healthrelated “industries” (Pharmaceutics, Medical Equipment, Insurance), as a reminder that the health sector, although unquestionably “costly”, also contributes significantly to the overall economy of the country. This new approach is a result of the awareness that federalism in health care is now a fact, although this raises two issues that are best addressed in this new framework. First of all, we believe that without a mutually accepted system of fiscal federalism, the current institutional arrangements are inadequate, as they provide no ties between regional autonomy and the related financial responsibilities. Secondly, it is necessary to ensure the social rights of citizenship, which translate here into the so-called “Essential” Levels of Care (ELC). In other words, the stakeholders should work to achieve a balance between the admissible regional differences (as a result of the federal system) and the nationwide uniformity of fundamental rights (stemming from the concept of ELC), which appears to be the real challenge faced by the Italian NHS in the forthcoming years. The two issues are obviously intertwined; for example, no acceptable funding and/or equalization criteria can be determined without acceptable assessments of the levels of efficiency of the regional systems; but the development of suitable criteria of comparison in this field requires the capacity to monitor the ELC, in particular, and the different needs of the regional populations in general. In short, lower expenditure does not necessarily determine greater efficiency, insofar as the relevant figures might be subject to more or less distortion due to the different needs and/or to shortcomings in quality (e.g. the formal, but not effective, implementation of the ELC); in summary, spending less because the regional population has fewer needs, or because of a lower quality of services, does not signify greater efficiency. Therefore, we will not deal in this Report with the determination of “standard costs”, despite the fact that the issue is at the top of the political agenda, because we are convinced that, 1. Spandonaro F., CEIS Sanità- Faculty of Economics, University of Rome “Tor Vergata”.. 7.
(11) given the present state of the art, the determination of such costs is still premature; although necessary, they must nevertheless be the result of a complex process of assessment, the fine points of which have yet to be fully investigated, based on a joint analysis of costs and needs; the expression “standard cost”, in fact, conjures up a picture of efficiency of the system as a whole, insofar as it is preferred to the “average cost” of care, which is undoubtedly higher than the best performance; however, it also suggests a certain caution in comparing the figures, having ruled out the concept of “minimum cost”, which might be the result of the failure to fully implement the essential levels of care. Determining an efficient cost model for the care services provided, therefore, remains a difficult task, made even more difficult by a structural shortage of monitoring data: the present cost survey model is based on a classification by type of production factors while, moreover, in order to reliably tackle the issue of “standard costs”, the best option would be to focus on the types of care (which is why they have been put at the centre of the 6th Health Report). The choice of the level of aggregation for benchmarking purposes is decidedly important, to determine the “standard costs”: the highest aggregate level (benchmarking on costs per resident) appears practically non-significant, because the efficiencies and inefficiences in the single sectors of care financially offset each other, but certainly not with respect to effective (substantial) compliance with the ELC requirements: suffice it to mention the bogus “savings” on residential and home care in situations that, moreover, conceal considerable shortcomings in the services provided. At the opposite end – that of the individual services or diagnostic-therapeutic pathways – the predominant factor is a subjective inconsistency of the need and effectiveness of the treatments, which appears to be a discriminating reason for discarding this approach (which, moreover, is disregarded internationally). Ultimately, a “middle of the road”, substantially pragmatic, approach would appear to focus on macro-areas of care (cost per type of care), selecting them so that the “scale” is such as to allow the definition of reasonably objective output and, possibly, outcome assessment criteria, such as to discard the experiences with significant qualitative and quantitative shortcomings. The experience made by the British NHS on capitation moves in this direction, based on the capacity of defining scales of equivalent needs per type of care. The fact that the inconsistency of needs is a key element of judgement is proven by some easy numerical exercises: for example, if we calculate the cost per resident at regional level we see that the lowest costs, at present, are those incurred by Sardegna, Puglia and Lombardia, followed by Campania which, moreover, features a huge deficit; if we “adjust” the data according to the weights used for the distribution (to the extent that they can suitably represent the need differentials of the population) the best performances become those of Umbria, Basilicata and Marche, while the other regions tend to slide downwards (Lombardia, for instance, is surpassed by Toscana, and Campania drops considerably in the league table). This seems sufficient to prove the sensitivity of the figure to the criterion of weighing the needs; and if we wish to further investigate the current accounting system’s capacity to discriminate in terms of efficiency, the case of Campania appears paradigmatic; but we cannot neglect the fact that the regions featuring the lowest costs all seem to be the smaller regions and that Sardegna, which is among the most virtuous, based on our survey, features decidedly scarce performance, with respect to the appropriateness of hospitalization. The direct benchmarking of the total costs per resident, therefore, appears to be scarcely grounded: fundamentally, it is a matter of need standardization criteria, the related algorithm. 8.
(12) (the current version of which was developed between 1996 and 1999) certainly requires further investigation and revision. Therefore, we cannot neglect the issue of the suitable funding of the essential levels of care at regional level by means of “standard costs”, i.e. reasonably efficient costs for the services provided, although this should be preceded by a scientific and agreed assessment of the cost determinants, irrespective of whether they are related to appropriate needs, non-appropriate needs, induced demand, etc., with obvious different implications in respect of the eligibility of central government funding and, therefore, national solidarity. The British experience provides some important information on the methods that can be used, beginning with the levels of disaggregation of the estimates (based on the type of care, as mentioned above), and ending with the choice of the base survey unit, which in the UK is the Primary Care Trust: obviously, with regard to the latter issue, it is necessary to make a reasoned decision on how to transpose the principle into the Italian system, but the Local Health Authority (ASL) seem to be the best choice, rather than the regional level, where different situations are averaged and, therefore, ultimately concealed. However, no projection will ever be able to guarantee the minute, albeit not less important, guarantee of coverage. We are personally convinced, in fact, that this can be based only a twofold and complementary approach. First of all, the capacity of the system to effectively collect the reports and feedback from the public: no statistical method can ever identify the small-scale deviations from the “established rules of the game” within the system, despite the fact that these deviations undermine the concept of ELC. It seems to us that, consistently with an approach focusing on empowerment, a complaints reporting system should be provided for (at the central level, because we are dealing here with potential deviations from the nationwide system), based on the ‘incident reporting’ model, as developed in the field of risk management (i.e. it should be easy to access, anonymous, independent of any claims-related/legal implications, etc.). In short, a user-friendly (e.g. web-based) and informal events-reporting system for highlighting any shortcomings in the overall social rights system, at the discretion of the public. Such a system might provide useful information, which a ‘table’ comprising representatives of the central and regional governments and of the citizen and patients organizations, might transform into an observatory capable of effectively monitoring the concrete application of the ELC. An empowerment-based approach should also provide that the public, even before being granted access to a system allowing them to “voice” their concerns and experiences, are suitably informed about the quality of the services provided: if AGENAS, as often re-iterated at the central government level, is to take on the role of independent watchdog, it must necessarily open itself up to the civil society (citizen and patients groups and organizations, scientific institutions working in the health sector, etc.), in order to become a really credible independent party, within a primarily public health and welfare system. At a more aggregate level, as regards the guarantee of ELC, all we can do is conduct a close (informal) monitoring of the regional health policies and the substantial incentives introduced in the health and welfare system as a whole. In this regard the issue of the so-called ‘portability’ of rights is another matter for concern; in a situation of increasing autonomy of the regions, in fact, it might become difficult for members of the public to apply for services in a different region. At present, this is guaranteed by the substantial inefficiency of the financial regulation of the mobility process,. 9.
(13) whereby the services are first provided, then generally settled a posteriori by the regions among themselves. For this purpose, based on the SANIDATA project for building an Observatory on regional and national regulation, the 6th CEIS Health Report has registered the sedimentation of increasing regulatory differences in many fields of health care: the characterizing aspect seems to be the predominance of an approach based on financial, rather than economic and, at times, equity savings; moreover, the increasing regulatory autonomy, with respect to matters touching entitlement to the quantities of services (justified by assessments of appropriateness) allow the forecasting, in the medium term, of an increasing risk of regional disparity, in respect of the ELC, and therefore potential problems with respect to the portability of entitlement to health care cover. Although reference should be made to the single chapters for more in depth and detailed information in this respect, it can be observed here that the pharmaceutical sector appears to be a paradigmatic care segment in terms of regulatory inconsistency. Despite the unquestionable financial success (public expenditure has been significantly cut back in recent years, as a result of the measures relating to prices and quantities), and regardless of any industrial policy considerations, it must be noted how the prescription limits introduced to date, as well as the processes relating to the off-label use of drugs, and the regional changes to the fee-exemption and cost-sharing rules, are prefiguring significant deviations from the principle of nationwide uniformity of health care eligibility. For example, with respect to the regulations governing the so-called ‘prescription limits”, some regions are already defining different reference prices, precisely quantified as costs per DDD (e.g. Sardegna, in the case of acid pump inhibitors); while others (within the same ambit, for example Lazio and Molise) are introducing different criteria (i.e. maximum prices per type of different dose packages); one can therefore easily assume that, today, the effective possibility of receiving various types of drugs, and the disincentives to using more costly molecules, differ from region to region. Therefore, there are already disparities on both the demand and the supply side, with levels of competition that cannot be superimposed; furthermore, since the quantities concerned by the reasoning are currently limited (although, in the future, the conditions for other types of development may set on), with regard to the portability of entitlement, we must ask ourselves to which prescription limits should the prescriptions required from outside the region conform? Likewise, other regulations seem to evolve in a potentially distorsive manner: this is the case of the drugs included in so-called ‘file F’; this flow, created for settlements among the regions and then extended to that between the regions, was supposed to represent a type of refund against invoices. However, certain regions have explicitly imposed a financial cap, while others do so implicitly, as a result of which drugs are effectively rationed (drugs that are, generally speaking, innovatory drugs, subject to accurate monitoring also by the AIFA), even more so than the drugs reimbursed within the DRG system. Likewise, as regards off-label use, the regions have been devolved the task simply to define the authorization procedures, but lacking the definition of the minimum requirements (for example, timeframes for the performance of the process, or the obligation to adopt the principle of consent by silence), these procedures can create the conditions for implicit rationings and, therefore, differing access to drugs in usually extremely serious and urgent cases. If the differences relating to the cost-sharing schemes can be (partially) justified due to their “fiscal” role, in connection with the local financial situations, the increasing differentiation of the exemption caps appear much less obvious. Especially in a binary system (total or no exemption), it is difficult to justify why, according to the region, citizens are considered more or. 10.
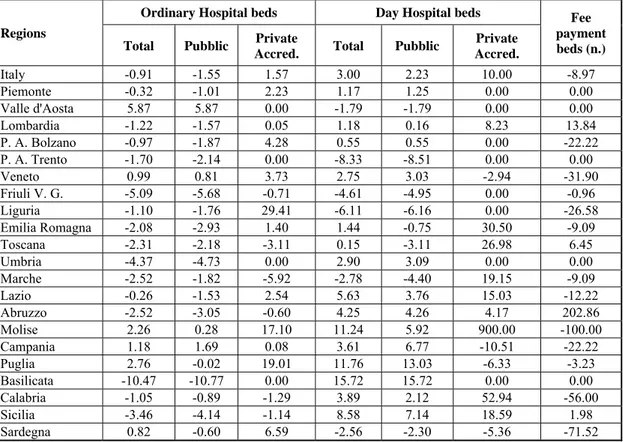
(14) less fragile within different income brackets (and, besides, some regions use the household income and others the so-called “equivalent household income”). Forms of disparity can be found even with respect to apparently similar cost-sharing schemes: this is the case of consultant services where, with just a few exceptions (e.g. Lazio), the exemption is effectively common, but not so the price lists, as a result of which the same amount of money purchases different “baskets” of services. On top of this, always formally justified by reasons of appropriateness, the transition from ordinary inpatient to day hospital care is now followed by a transition to outpatient care; for this purpose, in several regions we are viewing the definition of (variously named) packages of outpatient services, typically delivered by hospitals. There would be much to say about the assignment of the services to a (inpatient or outpatient) system, based on considerations that often have the objective of cutting back costs, as also about the maintaining (if not the increase) of outpatient services within hospitals, but it anyhow highlights that, based on the regionally adopted system, the charges for the public can change radically, ranging from nothing in the case of inpatient/day hospital services, to a cost-sharing charge (called a ticket in Italian) in the case of outpatient services. Suffice it to mention, for instance, many infusional treatments – including oncological treatments – which are already subject to different systems in the different regions. The disparities that impact rights (or at least the related eligibility procedures) are certainly those that should be monitored most closely; here too there are significant differences, which must be highlighted, also with respect to regulations that, although they are related to organizational matters, which clearly fall within the remit of the regional governments, nevertheless may have considerable effects on the quality of the services and, therefore, once again, on effective entitlement to the rights mentioned above. The paradigmatic case is represented here by accreditation and, within this, by the criteria relating to residential facilities (but the discussion can be extended to include other segments as well). We have, in fact, observed that there is a strong regional inconsistency with respect to definitions; for example, very different meanings and roles are assigned to the so-called Residenze Sanitarie Assistenziali (RSA), Health Care Residences; some regions have redefined RSAs by breaking them down based on the type of user group (ordinary RSAs, RSAs for mental patients, Alzheimer homes), while others have introduced new (more or less temporary) types, according to the gradient of care provided: Residenze Sanitarie Flessibili (RSF) are flexible homes, Residenze Sanitarie a Sede Ospedaliera (RSAO) are homes based in hospitals, while RSA medicalizzate (RSA-M) are residential care facilities were patients can receive medical care. This inconsistency in respect of definitions, however, is not accompanied by a clear set of specific requirements in the legislation (also for reasons of political “realism”, as a result of the difficulty by the various managements to adapt the requirements according to the procedures laid down in the regulations). Many requirements are subject to the possibility of derogation or determined only as general guidelines or, as in the case of Lombardia, worded simply as suggestions or intentions (in the sense that they apply only to the new facilities). Therefore, although the regional requirements (with respect to the premises or staff, for example) appear to be formally superimposable (and even this is not always the case), in actual fact the system features a cohabitation of significant differences in quality for users, besides creating significant differences between existing and new facilities, with respect to requirements (which has obvious effects on costs and, therefore, on the barriers hindering entry into the sector).. 11.
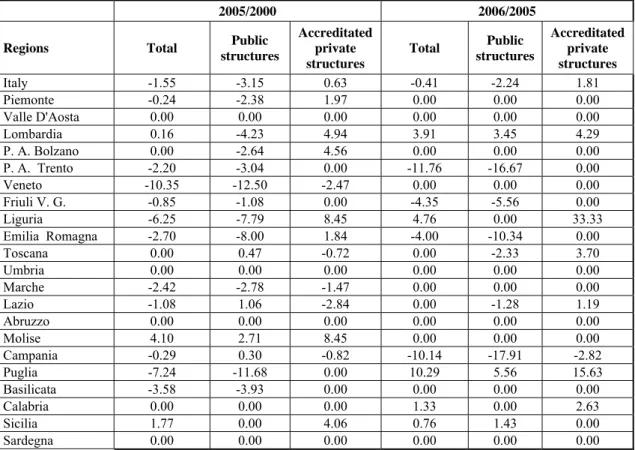
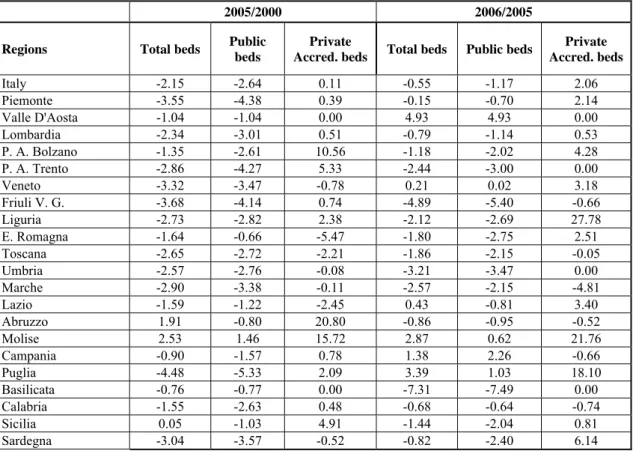
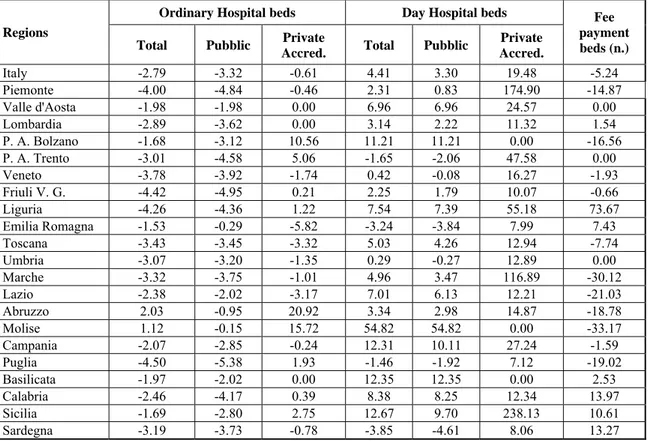
(15) It is obvious that, lacking minimum clearly defined and cogent nationwide criteria, accreditation (or, better, a casual use of this instrument), may become a means for the less virtuous regions of simulating non-existent “savings”, which are then paid for by the public in terms of impaired safety and/or quality of care. The tangible effects of this regulatory disorder is the practical impossibility to compare the relevant data; excluding the hospital, pharmaceutical and, in part, specialist sectors, the available statistics appear totally incomparable, making it impossible to suitably assess the efficacy and efficiency of the residential and home care systems and, generally speaking, the social and health care sector as a whole. Incidentally, we may notice that the social and health care sectors are becoming increasingly less separable and should be finally brought back under the same welfare umbrella. Concerning the incomparability of the data, we should also highlight some organizational innovations that contribute to raising obstacles in this respect. In particular, there is an innovatory instrument that is making an appearance in our system, in the field of home care, and which is not receiving the attention it should be receiving: so-called “care vouchers” (in Lombardia), a.k.a. “care allowances” (in Toscana and Emilia Romagna). The distribution of vouchers for purchasing care services undoubtedly has some advantages (such as a greater degree of self-determination of the beneficiaries and stimulating competetition between service providers), but it also features certain risks (in particular, scarce flexibility with respect to individual needs, and the different capacity of communicating with the supply system, based on socio-economic conditions). The phenomenon, therefore, should be better analysed empirically, assessing its actual efficacy and efficiency: we can highlight that the transformation of several services currently provided in kind into services delivered for cash might foster financial integration by the public, thus significantly boosting the development of a second health care pillar (supplementary care). Lastly, certain inefficiencies in the area of hospital policy, which remains the area that absorbs the highest resources, deserve commenting on. Besides a general reduction in the number of beds, several regions have also reduced the number of hospitals (especially public hospitals), while in others there has been an overall downsizing of the existing facilities. The aggregate figure, therefore, conceals policies that cannot be superimposed and which are, to a certain extent, based on opposing models of hospital efficiency assessment. Likewise, we can see that significant differences continue to exist between the North and the South of the country, which becomes particularly obvious when we analyse hospitalizations (decidedly lower in the South) and appropriateness (which is also lower in the South). The staff of the public hospitals, from 2000 to date, has not dropped and, on the contrary, has slightly increased (net of the contracts entered into with self-employed professionals): in detail, the number of nursing staff has dropped, while doctors and clerical staff have increased. The ensuing feeling is that the bed-cutting policies are often only a smokescreen, without any true efforts at rationalization in the sector. Practically speaking, we are witnessing the partial failure of the ‘per-service’ payment system (which, moreover, has been only partially applied, since most public hospitals enjoy refunds against invoices). Proof of this failure is the strong regional inconsistency in the levels of hospital remuneration. The average regional tariff, calculated based on the current regional price lists, highlights differences of up to 60%, which can hardly be rationally justified.. 12.
(16) The rationalization of the sector, especially in the regions with the largest deficits, which are also those with the highest number of private facilities, has been carried out according to the tariff regression mechanism. Here too the regional regulations feature some significant differences: in some cases there is a 100% regression (in short, once the amount of allocated services has been exceeded no further payments are forthcoming), which not only prevents the alteration of the allocated market shares, but also erects significant barriers to the entry of new facilities (of great importance is, currently, the case of facilities that have been accredited – and which, therefore, are authorized to act in the name and on behalf of the RHS – but which lack an agreement with the RHS for practically delivering their services within the system). As mentioned above, the regional policies often seem to sacrifice efficiency and appropriateness to financial savings: this can obviously be understood in a public financial system subject to large-scale constraints, which, however, does not seem to take into due account other objective factors. First of all, the fact that health expenditure in Italy (as a percentage of the GDP) continues to be lower compared to other European countries of similar economic weight (France, Germany, the Netherlands, Denmark, etc); secondly, if we classify the countries by health expenditure, but also by health expenditure growth in the medium term, Italy falls into the quadrant of the more virtuous countries. Based on these observations, we can maintain that the “problem” lies entirely within the constraints of public expenditure, also considering that Italy, with regard to the public share of health expenditure, is above the OECD average (in 2006, 77.2% compared to an OECD average of 73.4%), a percentage that has remained substantially stable since 2005. According to a longterm outlook, the public share of health expenditure in Italy dropped by about 7 percentage points in the decade between 1990 and 2000, but then increased by 5 points between 2000 and 2006. Moreover, it should not be forgotten, in particular at a time of serious economic difficulty, that the health sector is substantially anticyclic and that, including the ancillary industry, it is the third largest economic sector after the food and building industries. Furthermore, given the frequency of the contacts of the public with the NHS (in the order of tens of millions per year) every improvement to the sector’s organizational efficiency can significantly affect the productivity of the system: without applying the theory of training human capital, it is sufficient to remind people of the number of working hours lost as a result of health problems affecting employees or their family members. It seems to us, therefore, that there are good reasons for supporting the expediency of investments in the sector, strengthened by the need to support the rationalization of the health services currently undergoing serious financial problems: regions like Campania, Lazio and Sicilia can hardly catch up on their (negligent) delays without implementing suitable efforts aimed at the reconversion of the services they deliver, which are rather expensive. What seems to hinder change or the process most is, actually, the system’s incapacity (or fear) to avoid wasting any additional resources: this brings us back to the issue of whether or not the system is capable of providing itself with concrete means for measuring efficiency, without which not only would it be impossible to define “standard costs”, but it would also be very difficult to achieve the effective requalification of health expenditure. In terms of future development, the econometric model used for the Report confirms an upward trend of overall health expenditure (public plus private), faster than the GDP, although the crisis may have determined cutbacks in the sector analysed herein as well. The estimates for 2010, in fact, are that health expenditure will exceed the € 149 bn mark, equal to 8.8% of the GDP (about 9.0% according to the OECD statistics of international comparison), with a further. 13.
(17) 0.1% growth on the GDP compared to 2008 (thus remaining below the principal European countries). If we consider that, in the same period, the share of public financing by the central government is expected to remain substantially the same, and that, in a period of recession, or of substantial stability of the real GDP, there is the possibility that the private share of expenditure may increase, in all likelihood as a result of a growth of public-private partnerships, with an increase of the deficit: alternatively, of course, it is possible that the gap may at least be partially bridged by the rationalization of expenditure, for example, through the speedy “recovery” of the regions with serious financial problems, with respect to which, at present, we cannot foresee the details. According to estimated public expenditure trends, this should stand at the end of the period (2010) at about 7.1% of the GDP, with private expenditure at a constant level of between 1.8% and 1.9%. According to the forecasts set out in the budget documents, expenditure trends are expected to be less dynamic, at about 6.8-6.9% of the GDP in 2010. Compared to these developments, central government funding is expected to stop at 6.2-6.3% of the GDP; in order not to create a deficit in 2008, therefore, it would be necessary that the regional revenues be sufficient to bridge the gap, which amounts to € 10.4 bn, according to the government projections, or 10.7 according to us; in 2010 the gap is set to widen further: € 11.4 bn according to the government and € 16.0 bn according to us. Table 1: Development of health expenditure Year. 2009. 2010. Total health expenditure TV% %GDP Public health expenditure trends TV% %GDP Private-sector health expenditure TV% %GDP Central government funding TV% %GDP Deficit. 143.6 4.0% 8.8% 113.6 5.3% 6.9% 30.1 -0.6% 1.8% 102.9 3.0% 6.3% -8.19. 149.3 4.0% 8.8% 120.0 5.7% 7.1% 29.3 -2.7% 1.7% 104.0 1.1% 6.2% -13.44. Data processed by us. As anticipated, even considering any extra revenue received by the regions, in connection with their deficit recovery plans, lacking effective measures capable of cutting down expenditure, it is arguably the case that € 3-4 bn will be missing in 2009 and € 10 bn in 2010; further revenue generating measures are very unlikely, lacking an agreement, to date, with the regions about requirements. In any case, if cost-sharing fees are introduced to reduce the gap between expenditure and funding, or to limit the deficit (probably concentrated in the same regions, albeit not to the same extent as in the past, because the gap between the nationwide deficit and the sum of the deficits of the 5 “less virtuous” regions widened until 2004, and then narrowed in the following years and especially in 2007), private-sector health expenditure will rise above the levels at which it had stabilized in recent years; if, however, the regions decide. 14.
(18) not to use cost-sharing schemes, private-sector expenditure might even remain substantially stable, in which case the gap would be bridged through deficit spending. In the 1982-2007 period, the gap between level of expenditure and of funding narrowed further and, consequently, the deficit dropped, on average: this process might now stop, lacking any rapidly effective measures in respect of the system’s overall efficiency, or a significant increase of public-private partnerships. This latter point highlights the urgency of overhauling the partnerships/exemption system, while at the same time giving the public the opportunity and incentives for creating a second pillar of complementary health schemes. In the case of a growth of partnerships, and considering that private-sector expenditure, in Italy, remains almost exclusively ‘out of pocket’, supplementary health schemes might contribute to the sustainability of the system, thus safeguarding forms of mutuality. Under the recent Ministerial Decree of March 2008, supplementary health schemes might play an important role also with respect to supporting the less protected areas of the NHS, dental care and long-term care (LTC) first and foremost. In this regard we cannot forget that, in 2006 in Italy almost 300,000 people fell below the poverty line for health reasons: and, therefore, with regard to Equity, there is a substantial stability of the phenomenon and, consequently, the incapacity of the present health policies to tackle the problem. Over 850,000 households are subject to catastrophic expenses, although there is a drop in the number of instances that will be confirmed in the forthcoming years. The equity measures at geographical level, although rather differentiated, have highlighted a certain drop in impoverishment in many of the southern regions; but the most important aspect – the use of regionalized indicators – seems to lead to a softer conclusion, in respect of the differentiation between the RHSs of the northern and southern regions: in other words, at least a part of the differentiation in the provision of services by the RHSs is arguably the result of differences in the regional socio-economic contexts. The extreme fragility of households with one or more elderly members has been confirmed, although there is an increasing number of households which, although not subject to improverishment because of health expenses, nevertheless find themselves “at risk of poverty” because of such expenses. At a time of economic crisis, such as the present one, we must also attentively assess the evidence brought to us by the latest available data about the incompressibility of health expenditure due to improverishment and, therefore, of its appropriateness, to a certain extent: in the future, the necessity of measures in support of impoverished households will almost certainly become increasingly necessary and quantitatively significant. In conclusion, we hope that this 6th edition of the Report will contribute to highlighting and reporting the difficulties, which, however, must not discourage us from making an attempt to strike a proper balance between Difference and Uniformity; the latter is requested by, we believe, the common sentiments of social justice that permeate society, with respect to health more than to any other sector; the former by the oft-repeated signal coming from the international league tables, in which the Italian health system ranks constantly in the top positions for technical and professional capabilities, clinical outcome and, all things considered, thrifty expenditure, but low down for its rate of responsiveness and, generally speaking, patient satisfaction.. 15.
(19) Ceis09 Inglese:Layout 1. 17-03-2009. 14:11. Pagina 1. Chapter 1 Financing healthcare: an overview.
(20) 1 - Financing healthcare: an overview1. Since its creation, the Italian National Health Service (SSN) has undergone important reforms which have completely modified healthcare financing mechanisms in the country. Financing dynamics deeply influence SSN final gross profit: the way in which the SSN manages its funds can either results into a surplus or a deficit, the latter to be due to factors such as inefficient spending, insufficient financing or bad allocation of resources. As regards the allocation of resources from the Italian Central Government to Regions, Law No 662/1996 highlights that a rigorous analysis of local population needs has to be carried out before allotment occurs, taking into account real care needs, demographic characteristics as well as inter-regional patient mobility trends. Once funds have reached regional authorities, management and further distribution to local public health agencies and hospital trusts appear to be more flexible as no specific criteria have been set by law. Indeed, Central Government has to guarantee impartiality while allocating resources, whereas regional authorities aim at using funds in the best and most effective way possible. A comparison between Italy and OECD countries in the field of healthcare financing, as well as a study – whose results are presented into following paragraphs – focused on resources allocation criteria from SSN to Regions and from Regions to local bodies, allow us to make the following considerations: 1. The public sector is the main source of health funding in all OECD countries (see table 1.1) Table 1.1: Share of public funding of health expenditure. Percentages - Year 2006 % groups. OECD Countries. ≤ 50. Mexico, United States. 50-75. Korea, Switzerland, Greece, Australia, Poland, Canada, Portugal, Hungary, Belgium, Spain, Turkey, Slovakia Finland, Austria, Germany, Italy, New Zealand, Ireland, France, Holland, Sweden, Iceland, Denmark, Japan, Norway. 75-85 >85. United Kingdom, Check Republic, Luxembourg. Source: elaborations by CEIS Sanità on OECD Health Data 2008. 2. In Italy, 77.2% of health spending was funded by public sources in 2006, a figure well above OECD average (73.4%) and confirming 2005 trend. 3. Between 1990 and 2000, the share of public spending in Italy has dropped by about 7% whereas between 2000 and 2005 it has grown by nearly 5%. 4. Over the last decade out-of-pocket expenditure incidence on households’ consumption patterns has increased in all OECD countries, with a few exceptions – thwarting all 1. Paragraphs 1 and 2 were edited by Giordani C., CEIS Sanità- Faculty of Economics, University of Rome “Tor Vergata”. Paragraph 1.1 which outlines health financing in OECD countries as well as conclusions were edited by Giordani C. and Morelli G., University of Teramo.. 16.
(21) 5. 6.. 7. 8. 9. 10. 11.. 12.. 13.. 14. 15.. efforts for complementary health and retirement policies (the so called “Second pillar” of healthcare). A paradox has emerged: countries with the highest per capita income have recorded the lowest out-of- pocket expenditure share and vice versa. In Italy, private health insurances are not widespread. In 2005 and 2006 they accounted for 4.1% of total private spending and stood at only 0.9% of total health spending (even lower than 1%). Between 1982 and 2007, incidence of SSN funding on GDP has increased by 1.7%. Indeed, it has risen from 4.9% of GDP in 1982 to 6.6% in 2007. A steep increase between 1990 and 1991, just before 1992 crucial healthcare reforms, was followed by a downturn trend and then a new upsurge from 1998 to 2007. From 1982 to 2007 the gap between levels of healthcare spending and levels of healthcare funding has reduced, causing a deficit drop, too. In 2004 the gap between total national deficit and deficits recorded in the five “worst performing” Italian Regions broadened dramatically compared with 2003, but then it has gradually narrowed, with a remarkable reduction in 2007. Taking into account yearly variations of financing in real terms, from 2001 to 2007 figures have changed constantly as if resources allocation were fulfilling political instead of healthcare needs. With a few exceptions, funds are allocated to Regions according to regional over 65 population shares. As far as geographical breakdown of financings is concerned, Southern Italian Regions receive higher health funding - as percentage of GDP – in comparison with the North or the Centre. Such a gap derives from a re-allocation process and highlights the importance of a federalism aiming at real resources allotment equalization. As regards per capita gross profits on a regional basis, over the last five years Lazio has reported the highest budget deficits - well above national figures– followed by Molise whose highest deficits have been recorded over three non-consecutive years, i.e. 2003, 2006 and 2007. In 2004, Liguria ranked second among the “worst performing” Italian Regions (198.12 euros per capita) and the same happened to Campania in 2005 (256.59 euros per capita). Over the same time, Lombardia and Friuli Venezia Giulia have recorded a profit, thus ranking among the “best performing” Regions. Shifting to patient mobility over the last five years, on the one hand an increasing flow of incoming non-resident patients has brought to a surplus in most Northern and Central Regions of Italy, i.e. Lombardia, A.P. of Bolzano, Veneto, Friuli Venezia Giulia, Emilia Romagna, Toscana, Umbria, Lazio and Abruzzo. On the other hand, some Southern Regions (Campania, Puglia, Basilicata, Calabria), the islands (Sicilia and Sardegna) and a few Northern Regions, i.e. A.P. of Trento, Liguria (from 2003), Piemonte, Val D’Aosta, Marche (until 2002) and Molise (until 2002), have seen their mobility deficits grow. From 2001 to 2007 budget deficits deriving from patient mobility have dropped in Piemonte, Molise and Basilicata whereas they have soared in Valle d’Aosta, A.P. of Trento, Liguria, Marche, Campania, Puglia, Calabria, Sicilia and Sardegna. A huge scientific debate is currently trying to identify shared criteria for healthcare resources allocation but, unfortunately, no agreement has been reached so far. Two approaches are possible: opting for objective criteria such as population structure or consumption patterns, or focusing on subjective/contractual criteria including both political instruments, such as agreements at regional level, and financial tools, like funds allocation ceilings. As a matter of fact, controversies over the years have. 17.
(22) prevented Italian Regions from agreeing on common objective criteria and a tendency towards the adoption of contractual allocation criteria has been noticed so far. Adopting contractual allocation criteria can be dangerous as funds are often distributed taking into account past expenditure levels and such a mechanism hinders any effort of preventing foreseeable deficits from occurring again. By the way, resources allocation as well as funds concentration process always occurs on the basis of previous budget deficits.. 1.1 Financing healthcare in OECD countries Healthcare costs can be met either by the public sector or by the private sector. Public funding includes public revenue, i.e. taxes, and public social health insurances whereas private funding derives from private health insurances as well as households out-of-pocket expenditures - comprising payments for goods or services as well as cost-sharing expenditure. Most OECD countries draw on both public and private sources to finance healthcare, thus adopting “combined” financing strategies which make it difficult to include each country’s healthcare system into just one category of healthcare funding. Most European countries as well as some non-European countries – such as Canada and Japan – currently depend on public funding to cover their healthcare costs, mainly through public revenue as well as public social health insurances. (see table 1.2) On the one hand, countries such as Italy, Denmark, Finland, Ireland, Portugal, Spain, Sweden, the United Kingdom, Australia, Canada, Iceland, New Zealand and Norway have adopted a so called “Beveridge’s system” according to which taxes are the major source of health funding. On the other hand, “Bismark’s system” considers public social health insurances as major source of healthcare funding and it has been implemented in Austria, Belgium, France, Germany, Hungary, Japan, Luxemburg, Poland and Holland (since 2006 Holland - as well as Switzerland – has shifted to a different system requiring all citizens to take out a compulsory private health insurance policy). In the United States, primary healthcare coverage programmes have been designed to meet the needs of families with low incomes (Medicaid) as well as elderly (Medicare), but still most people have taken out private insurances as the national health system is market-based and public coverage of health expenditure reaches just 27% of US citizens. The rest of people have either to rely on private insurances or to give up insuring itself. Shifting to population shares benefiting from healthcare coverage, “universal treatment” is guaranteed by most OECD countries where healthcare coverage is extended to all residents of a governmental region (typically, most costs are met by the public sector or through compulsory insurances). In Italy, it is a public body, i.e. the National Health Service, which provides universal health treatment, but in countries such as Switzerland or Holland (since 2006 after the “Hoogervorst reform”) citizens who wish to benefit from universal healthcare have to take out a compulsory private insurance by a private insurances provider.. 18.
(23) Table 1.2: Characteristics of health systems in OECD Countries - Year 2006 % of coverage. Insurance: voluntary=v Obligatory=o. Addressee of insurance: individuals=i groups=g. Life insurance including health coverage. Australia. 100. V. i. yes (es. serious diseaes and disability). Austria Belgium. 98 99. V v+o (LTC). i i+g. Canada. 100. V. i (10%)+g (90%). Check Republic. 100. V. i. Denmark Finland France. 100 100 99.9. V V V. i+g i+g. Germany. 89.6. v+o. i+g. Greece Hungary Iceland. 100 100 100. V V V. i. Ireland. 100. V. i+g. Italy. 100. V. i+g. Japan. 100. V. i+g. Korea Luxembourg Mexico Holland New Zealand Norway Poland Portugal Slovakia Spain Sweden Switzerland Turkey United Kingdom United States. 100 99.7 50.4 71.2 100 100 97.3 100 97.6 99.5 100 100 67.2 100 27.3. Countries. V V V. V V V V V. i+g i+g i. yes (serious diseaes and disability) no (sometimes yes for serious diseaes and disability) no. yes (permanent disability) yes yes yes yes (es. serious diseases, hospital expenditure) yes yes (es. tumours and others specific diseases). no no. I. i+g. yes (serious diseases) yes (serious diseases) no. Source: OECD Health Data 2008, Muraro G. and Rebba V. (2008). Despite universal healthcare coverage, today’s private spending is playing a more and more important role and its increase can be due to the following factors: cost-sharing, inefficient public services - such as long waiting lists - and an incredibly wide range of complementary private insurances. To make an example, in Italy in 2006 private spending accounted for nearly 30% of total health expenditure though SSN universal healthcare coverage. Picture 1.1 shows total health expenditure per funding source (private and public) in OECD countries in 2006.. 19.
(24) 90 80 70 60 50 40 30 20. 44,23 45,79 55,09 60,25 61,60 67,04 69,90 70,43 70,55 70,92 71,00 71,24 71,40 74,40 75,97 76,21 76,87 77,20 77,85 78,27 79,73 81,66 81,69 81,91 82,00 82,69 83,63 87,26 87,85 90,84. % of total health expenditure. 100. 55,77 54,21 44,91 39,75 38,40 32,96 29,98 29,56 29,45 29,08 29,00 28,76 28,60 25,60 24,03 23,80 23,13 22,80 22,15 21,73 20,27 18,34 18,31 17,99 18,00 17,31 16,38 12,74 12,15 9,12. Figure 1.1: Health expenditure in OECD countries by source of funding (public and private). Percentages - Year 2006. 0. Messico Stati Uniti Corea Svizzera Grecia Australia* Polonia Canada Portogallo Ungheria Belgio Spagna Turchia* Slovacchia* Finlandia Austria Germania Italia Nuova Zelanda Irlanda Francia Olanda Svezia Islanda Danimarca Giappone* Norvegia Regno Unito Repubblica Ceca Lussemburgo. 10. Finanziamento pubblico totale. Finanziamento privato totale. Source: elaborations by CEIS Sanità on OECD Health Data 2008. Clearly, public funding represents the dominant formula among OECD countries: 16 out of 30 countries surveyed have recorded a share of public spending over 75%, with peaks in Denmark, France, Japan, Iceland, Luxemburg, Norway, Holland, the United Kingdom, Check Republic and Sweden where it reached over 80%. It is probably worth underlying that all these countries grant universal healthcare. The lowest shares have been recorded in Mexico (44%), the United States (46%) and Chorea (55%) but everywhere else average is 60%. With respect to Italy, in 2006 the country stood well above OECD average (73.4%) and recorded a share of public spending equalling 77.2% - similar to 2005 figure (76.6%). As regards health funding sources over the last twenty years in OECD countries, the situation hasn’t modified consistently. Figure 1.2 contains comparable data concerning countries where shares of public spending have changed over nearly three decades (from the 1980 to 2006).. 20.
(25) Figure 1.2: Share of public funding of health expenditure in OECD countries. Percentages - Years 1980-2006. 100 80 60 40 20 0 Australia Austria Canada Corea Danimarca Finlandia Francia Germania Giappone Grecia Irlanda Islanda Italia Lussemburgo Messico Norvegia Nuova Olanda Polonia Portogallo Regno Unito Repubblica Spagna Stati Uniti Svezia Svizzera Turchia. % public health expenditure of total health expenditure. 120. 1980. 1990. 2000. 2006. Source: elaborations by CEIS Sanità on OECD Health Data 2008. Figures refer to 27 countries2 and demonstrate that, decade after decade, those countries relying mostly on public spending - Canada, Denmark, New Zealand, Poland, Check Republic, Spain e Sweden – have seen its decrease whereas countries with smaller public spending shares - Australia, Austria, Chorea, Japan, Switzerland e Turkey – have witnessed a remarkable growth over the same time. Some countries showed rather “irregular” trends: for example, France, Greece, Ireland and the United States recorded a big drop of public spending shares from 1980 to 1990, followed by upsurges over the next decades. In Italy the share of public spending has dropped by 7% between 1990 and 2000, but from 2000 to 2006 it has seen a rise by nearly 5%. (Compare Muraro and Rebba3).. 2 3. As regards some countries, data refer to 2005 as 2006 figures were not available. Muraro G. e Rebba V., Public and Private Financing of Health Care: An Overview, (2008). 21.
(26) 2,75. 0,00. 4,80 0,00. 1,78 100,00. 95,47. 6,10 93,90. 95,17. 7,47 0,38 0,00 4,05 9,50 90,13. 88,48. 12,78 0,00 11,87. 1,87. 88,19. 85,36. 7,45 10,47 3,32 14,26 82,42. 82,07. 18,85. 9,1513,24. 3,59 77,57. 77,61. 77,33. 76,86. 21,48 2,36 20,95 2,58 18,16 4,99 13,79 8,88 76,47. 76,15. 18,78 10,61 21,16 4,19 70,61. 69,46. 69,26. 55,21. 48,96. 33,22. 74,65. 19,71 11,02. 0,00 30,54. 3,27. 4,20 38,58 57,23. 22,29. 39,65. 22,51. 57,07. 3,77. 8,38 42,66. 63,00. 35,48. 10,08 66,38. 31,92 32,59. 23,54. 100 90 80 70 60 50 40 30 20 10 0. Stati Uniti Olanda Francia Canada Australia* Germania Irlanda Austria Turchia* Lussemburgo** Nuova Svizzera** Spagna Belgio Portogallo Ungheria Finlandia Corea Giappone* Polonia Slovacchia* Italia Danimarca Messico Norvegia Repubblica Islanda. % of private health expenditure. Figure 1.3: Composition of private funding of health expeniture in OECD countries. Percentages - Year 2006. Spesa out of pocket. Assicurazioni private. Altro. Source: elaborations by CEIS Sanità on OECD Health Data 2008. Shifting to private spending as a source of health funding, it encompasses out-of-pocket expenditure, i.e. health costs met directly by families and including cost-sharing and copayments, private insurances and products offered by non-profit organisations or further associations different from private insurance companies. In OECD countries4 households spending accounts for an average 17.1% of total health expenditure – 18.4% was the percentage in 2005. Indeed, picture 1.3 portrays out-of-pocket expenditure as accounting for 50% of total private spending in most OECD countries – except in the United States, Holland, France and Canada. Nevertheless figures vary remarkably from country to country and are included in the range between 55.2% - recorded in Australia - and 100% in Iceland. Two-thirds of countries surveyed show an average share of 70%. In Italy out-of-pocket expenditure still plays a central role, as in 2006 it accounted for 88.5% of private health expenditure – slightly more than in 2005 when it stood at 87.0%. These figures demonstrate once again that in our country not enough room has been devoted to the “Second pillar of healthcare”, i.e. healthcare funds, mutual funds or complementary insurances. In fact, the whole OECD area – except for the United States and France, to make a few examples – has seen a growing incidence of out-of-pocket expenditure on total households spending, with worrying consequences as regards the criteria of solidarity and equality. Indeed, 4. No comparable data on private spending composition were available for Greece, United Kingdom and Sweden.. 22.
(27) though this trend is slowly reversing, the higher out-of-pocket spending and private insurances expenditures are, the less solidarity exists in the country. As a result, today we are confronted with a paradox: countries with the highest per capita income have the lowest out-of- pocket expenditure share and vice versa. With respect to private insurances, they accounted for an average of 4.7% of total health spending (compared with 5% in 2005) and made up an average 18.4% of total private expenditure in 2006 in OECD countries. Going more into details, picture 1.3 shows that, on the one hand, private insurances as a share of private expenditure are highest in the United States (66.4%), in France (63.0%), in Canada (42.7%), in Germany (39.7%), in Ireland (38.6%) and in Holland (31.9%). On the other hand, they lack completely in Norway, Iceland and Slovakia. In Italy private insurances appear to be quite unpopular, too. In 2006, they recorded a share of 4.1% of total private spending (close to 2005 figure) whereas private insurances accounted for 0.92% (not even 1%) of total health expenditure over the same 12 months. Considering the burden of data, some remarks could be interesting at this stage: OECD expects the share of public spending– including resources allocated to help non self-sufficient old people - to double in a few decades, not only in Italy but also in many other countries, if heath policies remain unvaried. Prospects of an increasing public health spending worry policy makers whose financial resources get poorer and poorer every day. The Italian Minister of Labour, Health and Social Policy, Maurizio Sacconi, has recently issued the Libro Verde (Green Paper), a document focusing on the need for radical changes in the Italian welfare state, with a particular look at the healthcare system. As stated in the Libro Verde, “Italian families continue to rely on private spending to meet the most of their healthcare costs. That said, different forms of mutuality among individuals, the principle of bilateralism, the promotion of private insurances as well as costsharing initiatives - in the field of both social security and healthcare - can effectively contribute to a fairer and more efficient risk management. It is therefore necessary to put the abovementioned strategies soon into practice and make them an essential component of any welfare policy adopted in our country. Thereafter, we must foster complementary pension schemes as well as complementary health funds so that private spending will really become an effective supplementary health funding source able to support public funding, notably public revenue, without jeopardising the principle of solidarity among generations. As a result, costs and risks will be shared by the private and public sectors and problems deriving from eligibility criteria will diminish. In this framework, the Government has to draw up appropriate regulations, it has to provide citizens with fiscal benefits and, above all, it has to make them aware that any public intervention has its own limits and needs external support.”. 1.2 SSN funding and gross profit in Italy This paragraph analyses the trend of SSN funding in Italy from 1982 to 2007, as comparable data available to the Ministry of Labour, Health and Social Policy - Health Department5 – refer exclusively to that time-lapse.. 5. Named “Ministry of Health” from now on, for the sake of brevity.. 23.
(28) Figure 1.4: SSN funding as share of GDP. Percentages - Years 1982-2007 7. 6,55 6,5. % of GDP. 6 5,5 5 4,5. 4,62. 4 3,5. 2004 2005 2006 2007. 1995 1996 1997 1998 1999 2000 2001 2002 2003. 1992 1993 1994. 1986 1987 1988 1989 1990 1991. 1982 1983 1984 1985. 3. Source: elaborations by CEIS Sanità on Ministry oh Health and ISTAT Data. Over that interval, SSN current funding6 as a proportion of GDP has grown on an irregular basis (see figure 1.4): an increase of 1.7% has been recorded, causing funding to rise from 4.9% (1982) to 6.6% of GDO (2007). It was exactly in 2007 that the highest funding proportion of GDP has been recorded (according to the Italian budget law 2008 as well as other estimates, the percentage is expected to grow), whereas the lowest funding percentage ratio of GDP occurred in 1986 (4.6%). Average share from 1982 to 2007 is 5.4%.. 6. In order to carry out the following analysis, current funding includes revenues deriving from intramoenia medical services (i.e. medical examinations carried out by specialists overtime and in hospital. Targets are both in- and outpatients who are required to pay the doctor a fee) but it does not include extraordinary revenues as well as revenues linked to inter-regional patient mobility. Patient mobility balances were taken into account when analysing regional gross profits.. 24.
(29) Figure 1.5: Expenditure, funding and deficit. Shares of GDP - Years 1982-2007. 8 7. % of GDP. 6 5 4 3 2 1 1982 1983 1984 1985 1986 1987 1988 1989 1990 1991 1992 1993 1994 1995 1996 1997 1998 1999 2000 2001 2002 2003 2004 2005 2006 2007. 0. Disavanzo. Spesa sanitaria. Finanziamento SSN. Source: elaborations by CEIS Sanità on Ministry oh Health and ISTAT Data. Picture 1.5 shows that the increase in funding had a rather irregular trend, characterised by a steep rise between 1990 and 1991, immediately before crucial healthcare reforms7, followed by a downturn in 1992 and then a new upsurge from 1998 to 2007 when a “peak level” (6.6%) has been recorded. Over the same lapse of time (1982-2007) health spending has constantly been higher than SSN funding and budget deficits have ensued since the creation of the SSN (see figure 1.5). Nevertheless, the gap between health expenditure and health funding seems to have gradually narrowed, leading to lower budget deficits, too (see figure 1.5). Referring to the last five years8, the ratio of deficit to GDP had a slight rise in 2004 (+0.3%) compared with 2005, it has remained rather flat over the two following years and it dropped by 0.1% in 2007 compared with 2006.. 7 8. Cf. Report CEIS - Sanità 2007, Chapter 1.4, p. 76. Last update by the Ministry of Health: July 2008.. 25.
(30) Figure 1.6: Comparison between national deficit and total deficit of the five “worst performances” Regions Shares of GDP - Years 2003-2007 2003. 2004. 0. 2005. 2006. 2007. years. -0,05. % of GDP. -0,1 -0,15 -0,2 -0,25 -0,3 -0,35. disavanzo nazionale in % PIL. disavanzo 5 Regioni con maggiore disavanzo in % PIL. Source: elaborations by CEIS Sanità on Ministry oh Health Data. Now, let us take into consideration the five “worst performing” Italian Regions, i.e. those with the highest deficits over a given lapse of time. If we add up deficits recorded there from 2003 to 2007 and then we compare the total figure with national health deficit – all figures have to be seen as a proportion of GDP – we will notice that the gap between these two figures has widened in 2004 – compared with 2003 – whereas it has reduced from 2005 to 2007 when deficits accumulated in the five “worst performing” Italian Regions (Lazio, Sicilia, Campania, Abruzzo and Liguria) accounted for 91.5% of national health deficit (see figure 1.7).. 26.
(31) Figure 1.7: Share of deficit of the five “worst performances” Regions Shares of national deficit - Years 2003-2007. 100% 90%. 23.42. 19.49. 76.58. 80.51. 9.06. 11.17. 8.48. 90.94. 88.83. 91.52. 80% 70% 60% 50% 40% 30% 20% 10% 0% 2003. 2004. 2005. disavanzo 5 Regioni con maggior disavanzo in % del disavanzo tot. 2006. 2007. disavanzo restanti Regioni in % del disavanzo tot. Source: elaborations by CEIS Sanità on Ministry oh Health Data. Apparently, changes in deficit figures do not depend on changes in expenditure items (see table 1.39). Table 1.3: Annual variations of funding, deficit and most important health expenditure elements. Percentages - Years 2003-2007 Personnel Goods and services10 Funding Deficit/Surplus. 2003 +1.18 +10.55 +4.39 -23.89. 2004 +5.58 +13.13 +6.01 +85.61. 2005 +7.64 +17.88 +7.51 +4.20. 2006 +5.22 +1.22 +4.50 -6.07. 2007 +1.14 +9.84 +4.51 -27.78. Source: elaborations by CEIS Sanità on Ministry oh Health Data. For example, in 2004 higher financial resources were allocated to meet increasing personnel costs as well as a rise in costs linked to production of goods and services, and, nevertheless, deficit soared. On the contrary, in 2006 financial resources weren’t sufficient to cover rising personnel and production costs and, nevertheless, deficit decreased compared to 2005. 9 10. Cf. Report CEIS - Sanità 2007, Chapter 1.4, p. 79-80. This part of health expenditure includes expenditure for goods, tipical provisions, intramoenia, passives interests, financial costs, other services and tax. 27.
(32) Table 1.4 analyses percentage shifts of both nominal and real funding levels in “real” terms, from 2000 (the base year) up to now. Table 1.4: Annual increases of financing in real and nominal terms. Percentages - Years 2001-2007 Funding in nominal terms Funding in real terms. 2001 +8.61 +5.61. 2002 +6.79 +3.40. 2003 +4.39 +1.47. 2004 +6.01 +3.36. 2005 +7.51 +5.38. 2006 +4.50 +2.76. 2007 +4.51 +2.29. Source: elaborations by CEIS Sanità on Ministry oh Health and ISTAT Data. Data show that a peak in financing in real terms occurred in 2001 and in 2005 whereas 2003 and 2006 reported the lowest funding levels ever recorded in real terms. Such an irregular trend was mainly due to the economic situation at that time and it didn’t manage to meet real needs of the population.. 1.3 Regional Health Services funding and gross profits Funding of public health spending occurs in Italy under various agreements: those at national level - between the Ministry of Economy, the Ministry of Health and Regional Authorities - as well as those at regional level - involving representatives for all different Regions, the latter to be approved by the Conferenza Stato-Regioni.11 These agreements must provide Regions with the necessary financial resources to guarantee adherence to the so called LEA (Livelli Essenziali di Assistenza or Essential Levels of Care), i.e. minimum healthcare services all Italian citizens are entitled to, as well as to meet the need of the whole population, as stated in D.P.C.M. (Decree of President of the Cabinet) on the 29th November 2001. As a result, since 1999 - once the budget Law no. 662/1996 came into force - resources have been allocated following the weighted capitation formula according to which size and characteristics of population are the primary determinant to allot resources. Therefore, today’s allocation process follows criteria such as age, sex and, if relevant, epidemiological or similar indicators, causing structural indicators to recently become less important. As a matter of fact, the weighted capitation formula continues to be adopted nationwide though it has been “adapted” to local conditions in order to avoid controversies among Regions.. 11. Conferenza Stato-Regioni (Conference of the State and Regions) is a temporary public committee established in 1983 and composed by national Ministries as well as Regional and Provincial representatives. It takes decisions aiming at promoting cooperation between Central Government and local authorities [TN].. 28.
(33) Table 1.5: Regional per capita funding. Euros - Years 1995-2007 Regions Italy Piemonte Valle d'Aosta Lombardia Trentino A.A. Veneto Friuli V.G. Liguria Emilia Romagna Toscana Umbria Marche Lazio Abruzzo Molise Campania Puglia Basilicata Calabria Sicilia Sardegna. 1995. 2000. 2005. 2006. 2007. 828.547 840.38 888.18 854.33 957.04 870.37 882.62 900.43 907.76 854.21 897.47 851.35 814.04 816.32 788.67 763.86 786.97 754.31 752.80 759.11 788.46. 1,167.101 1,219.12 1,438.97 1,184.99 1,465.09 1,200.55 1,238.98 1,347.32 1,289.05 1,233.76 1,270.24 1,346.89 1,172.00 1,161.95 1,150.09 1,034.33 1,063.57 1,026.99 1,036.63 1,048.49 1,065.69. 1,568.046 1,691.52 1,884.39 1,551.15 1,932.39 1,580.64 1,678.82 1,712.17 1,655.11 1,643.10 1,611.93 1,581.08 1,598.32 1,545.60 1,587.56 1,415.39 1,465.07 1,519.05 1,491.44 1,493.61 1,471.86. 1,630.515 1,747.70 2,036.99 1,600.28 1,982.70 1,675.26 1,664.79 1,809.13 1,694.62 1,681.78 1,637.47 1,627.47 1,655.48 1,593.76 1,604.24 1,518.37 1,550.20 1,575.83 1,582.67 1,538.06 1,555.96. 1,693.126 1,791.42 2,033.62 1,671.38 2,055.95 1,711.96 1,819.21 1,873.84 1,765.45 1,764.81 1,721.53 1,709.38 1,650.37 1,651.50 1,677.55 1,585.95 1,633.26 1,681.62 1,681.44 1,589.33 1,654.82. Source: elaborations by CEIS Sanità on Ministry oh Health and ISTAT Data. Table 1.5 illustrates the amount of regional per capita funding to Regions and to Autonomous Provinces from 1995 to 200712. From 2005 to 2007, Campania has received the lowest amount of per capita funding, followed by Sicily (year 2006 and 2007) and Puglia (year 2005) whereas in 1995 and in 2000, the lowest amount of per capita resources has been allocated respectively to Calabria and Basilicata. Let us discovered which have been the best-financed Regions in the country on a per capita basis: Trentino Alto Adige has constantly received the highest funding except in 2006 when the best-financed region was Val D’Aosta. Emilia Romagna ranked second in 1995 whereas Val D’Aosta was the second best-financed region over the remaining years.. 12. Data were collected by the Ministry of Health. Current funding figures derive from intramoenia medical services revenues (i.e. medical examinations carried out by specialists overtime and in hospital. Targets are both in- and outpatients who are required to pay the doctor a fee [TN]) and do not take into account revenues of any extraordinary management activity. The most recent comparable data refer to 2007.. 29.
(34) Figure 1.8: Regional per capita funding* and over 65 population. Euros and percentages - Year 2007. 1900 1850 1800 1750 1700 1650 1600 1550 1500 1450. Liguria. Piemonte. Emilia Romagna. Toscana. Umbria. Veneto. Marche. Basilicata. Calabria. Molise. Lombardia. Abruzzo. Lazio. Puglia. Campania. 1400. * Ordinary Regions Source: elaborations by CEIS Sanità on Ministry oh Health and ISTAT Data. Figure 1.8 refers to 2007 and highlights the link between the share of resources allocated to Italian Regions (Autonomous Provinces excluded) and the quota of old people (over 65) on total population. On the 1st January 2007, Campania recorded the lowest share of old people (15.52% over 65 and 7.12% over 75), and it received the lowest amount of per capita health funding (1,585.95 euros). Over the same year, Liguria recorded the highest share of old people aged both over 65 (26.70%) and over 75 (13.39%), and it received the highest amount of per capita health funding (1,873.84 euros). In other words, ageing of population appears to play a central role whenever resources are allocated. But some exceptions exist: Lombardia, Calabria and Veneto have a low share of old people but they have received high per capita funding (see figure 1.8).. 30.
Figura


+7


Documenti correlati
per il marketing delle imprese (anni ’80) e rimane totalmente separata dagli altri strumenti di marketing segue una fase (anni ’90) in cui da un lato si evidenzia come
Secondo un aspetto dell’invenzione, le luci di uscita possono essere disposte tra loro adiacenti e allineate lungo uno stesso bordo frontale del corpo monolitico della
7 E, in aggiunta alle metodologie più popolari, come doppiaggio, sottotitolazione, voice-over, commento e narrazione, concepite per essere sottoposte al passaggio
photoswitching circuit with rectangular electrodes leads to simulations results by the method of the moments, close to measurements, in the case of a constant illumination [4]..
thermal comfort (orientation studies and the form factor, the strategic use of plantings, etc.) has, in only a few years, decried the total extraneousness of Selva Cafaro
The most important examples to demonstrate the influence of pharmacogenetics on anticancer therapy are dihydropyrimidine dehydrogenase (DPD) gene mutations and severe
