A
A
l
l
m
m
a
a
M
Ma
at
te
er
r
S
St
tu
ud
di
i
or
o
ru
um
m
–
–
U
Un
n
iv
i
ve
er
rs
si
i
tà
t
à
d
d
i
i
B
B
ol
o
lo
o
gn
g
na
a
DOTTORATO DI RICERCA IN
Scienze ambientali: tutela e gestione delle risorse naturali
Ciclo XXVII
Settore Concorsuale di afferenza: 04/A1 Settore Scientifico disciplinare: GEO/08
TITOLO TESI
HYDROGEOCHEMICAL MONITORING AND MODELLING OF
SALTWATER INTRUSION IN LOWLANDS (FERRARA, IT)
Presentata da: Nicolò Colombani
Coordinatore Dottorato
Relatori
Prof. Enrico Dinelli
Prof. Enrico Dinelli
Prof.ssa Maria Dolores Fidelibus
Acknowledgments
Prof. Ramon Aravena, Prof. Enrico Dinelli and Prof. Maria Dolores Fidelibus are gratefully acknowledged for their precious comments and suggestions.
Many thanks are also due to Dr. Dario Di Giuseppe, Dr. Renzo Tassinari and Dr. Umberto Tessari for laboratory assistance and to Dr. Mariachiara Caschetto, Dr. Massimo Marchesi, Dr. Enzo Salemi and Dr. Fabio Vincenzi for field assistance.
CONTENTS
i
THESIS CONTENTS
List of figures iii
List of tables viii
RIASSUNTO ix
Contesto e motivazione ix
Significato del sito di test selezionato xii
Obiettivi della tesi xiii
Implicazioni e prospettive xvi
1. INTRODUCTION 1
1.1 Background and motivation 1
1.2 Significance of the selected test site 5
1.3 Objectives of the thesis 6
2. SITE DESCRIPTION 9
2.1 Study area 9
2.2 Morphological evolution during the last glacial period 10
2.3 Recent anthropogenic activity 12
2.4 Hydrogeological setting 13
3. MATERIALS AND METHODS 16
3.1 Field activities 16
3.1.1 Monitoring wells installation 16
3.1.2 Continuous monitoring of piezometric heads and surface waters levels 17
3.1.3 Depth profiles acquisition 17
3.1.4 Constant rate pumping tests 19
3.2 Analytical methods 21
3.2.1 Sedimentological characterization 21
3.2.2 Chemical analysis of water samples 22
3.2.3 Geochemical analysis of soil samples 22
3.3 Numerical modelling activities 24
3.3.1 Site wide steady-state simulation 24
3.3.2 Two dimensional transient simulation 28
CONTENTS
ii
4. RESULTS AND DISCUSSION 34
4.1 Characterization of the lowland coastal aquifer of Ferrara: hydrology,
hydrochemistry and evolution of the system 34
4.1.1 Hydrostratigraphic characterization 34
4.1.2 Hydrochemical characterization 39
4.1.3 The origin of the salinization processes 43
4.2 The importance of data acquisition techniques in saltwater intrusion
monitoring 47
4.2.1 Open-Borehole Logging and Multi-Level Sampling 48
4.2.2 Integrated-Depth Sampling and Multi-Level Sampling 53
4.2.3 Discrepancy between an integral-depth and a depth-dependent
monitoring 55
4.3 Numerical modelling to predict salinization trends in a lowland coastal
aquifer 58
4.3.1 Three-dimensional model calibration and sensitivity analysis 59
4.3.2 Three-dimensional model results 62
4.3.3 Tidal forcing effects on groundwater fluctuation 63
4.3.4 Two-dimensional model calibration and validation 65
4.3.5 Future scenarios 68
4.4 Ammonium occurrence in a salinized lowland coastal aquifer 71
4.4.1 Water table elevation and ammonium mapping 72
4.4.2 Core samples depth profiles 73
4.4.3 Groundwater quality depth profiles 75
4.4.4 Groundwater mineralization processes 77 4.5 Trace elements mobility in a saline coastal aquifer of the Po river lowland 78
4.5.1 Sediment composition 78
4.5.2 Hydrochemical conditions of the shallow aquifer 81
4.5.3 Trace elements distribution in the shallow aquifer 81
4.5.4 Trace elements profiles in sediments and groundwater 83
4.5.5 Trace elements partitioning between groundwater and sediments 85
5. SUMMARY AND CONCLUSIONS 87
5.1 Synthesis 87 5.2 Conclusions 87 5.3 Recommendations 90 5.3.1 Practical implications 90 5.3.2 Remaining challenges 91 5.4 Related publications 92 6. REFERENCES 95
LIST OF FIGURES
iii
LIST OF FIGURES
Figure 1.1 – Wheat fields in the Ferrara lowland (www.estense.com).
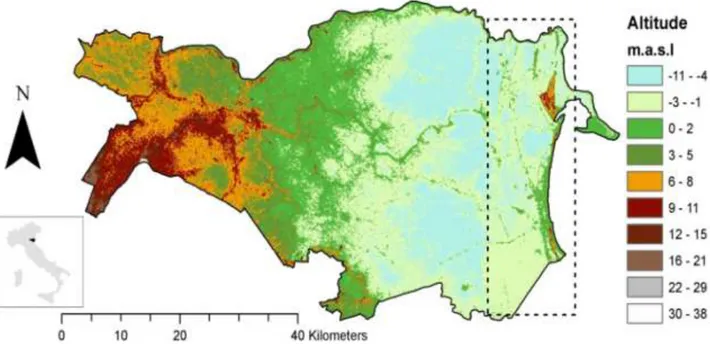
Figure 2.1 - Ferrara Province topography map and location of the coastal lowland study area (dashed rectangle).
Figure 2.2 – Upper panel: Location of the 13 monitoring wells, the sandy paleochannel belts, the dunes and paleodunes in the study area. Lower panel: sketch of the study area showing the location of the two boreholes P33, P34 and of the courses of the main rivers. Below is shown the hydro-stratigraphyc reconstruction along the transect AA’, with geological logs and piezocone resistance profiles.
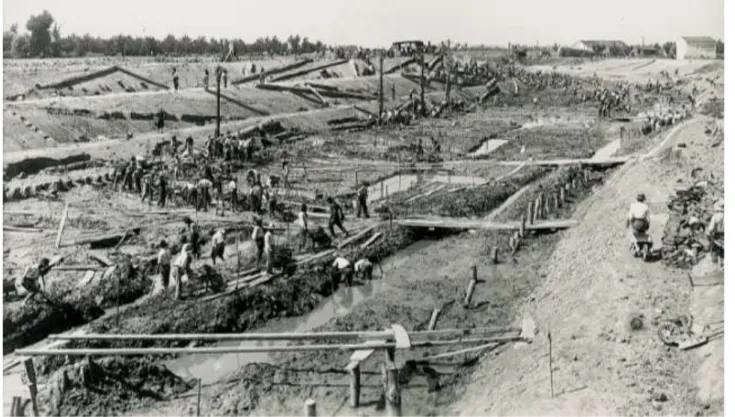
Figure 2.3 – Waterworks in the Ferrara Province at the beginning of the XX century (www.bonificaferrara.it).
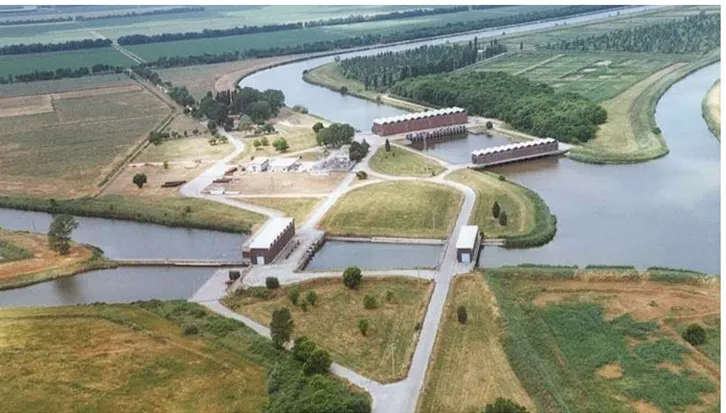
Figure 2.4 – “Valle Lepri” dewatering station in the Ferrara Province lowland (www.bonificaferrara.it).
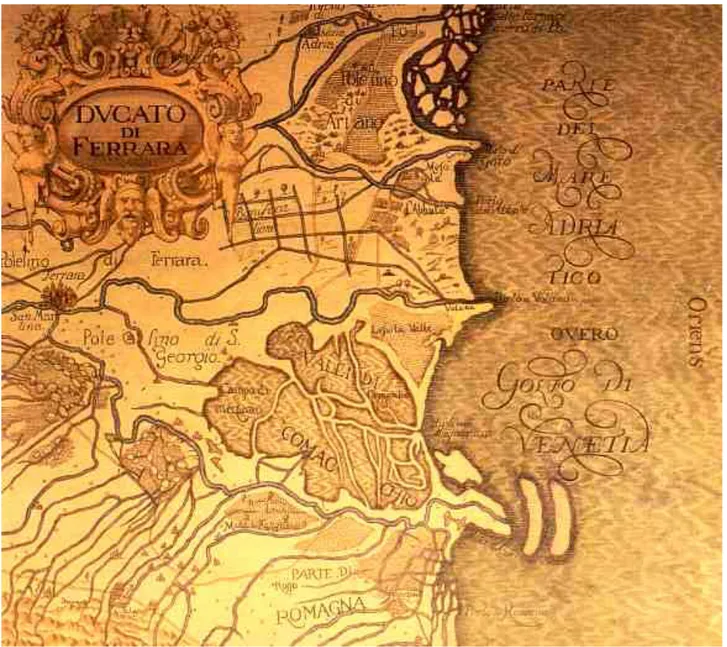
Figure 2.5 - Excerpt of the coastal territory of the Duchy of Ferrara in 1648 (ilmuseodimirabello.com).
Figure 3.1 - Multilevel Sampler set up and installation.
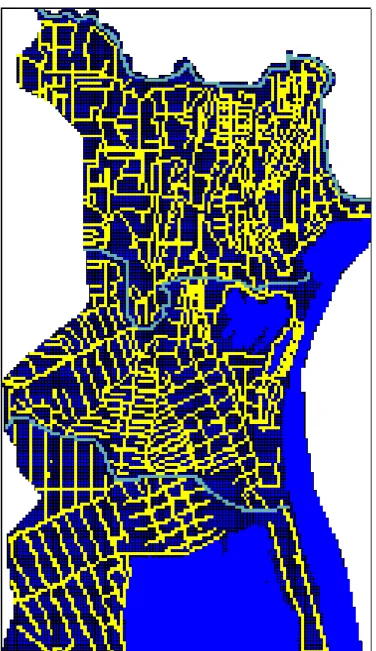
Figure 3.2 - Grid discretization and boundary conditions applied to the model domain: no flow cells (grey), constant heads cells (blue) drain cells (yellow) and river cells (cyan).
Figure 3.3 - Hydraulic conductivity (m/s) discretization of the model domain based on surface geology and the decreasing hydraulic conductivity pattern found during the multi-level pumping tests.
Figure 3.4 - Variogram fitted with a power law function (left plot), and distribution of Specified Concentration in layer 10 derived from the interpolated measured TDS and pilot points (right plot).
Figure 3.5 - Numerical grid, with the optimized kh discretization, in yellow the Drain cell and
in light blue the Time-Variant Specified-Head cells pertaining to the canal and to the pro-delta silty clays connected with the Adriatic sea.
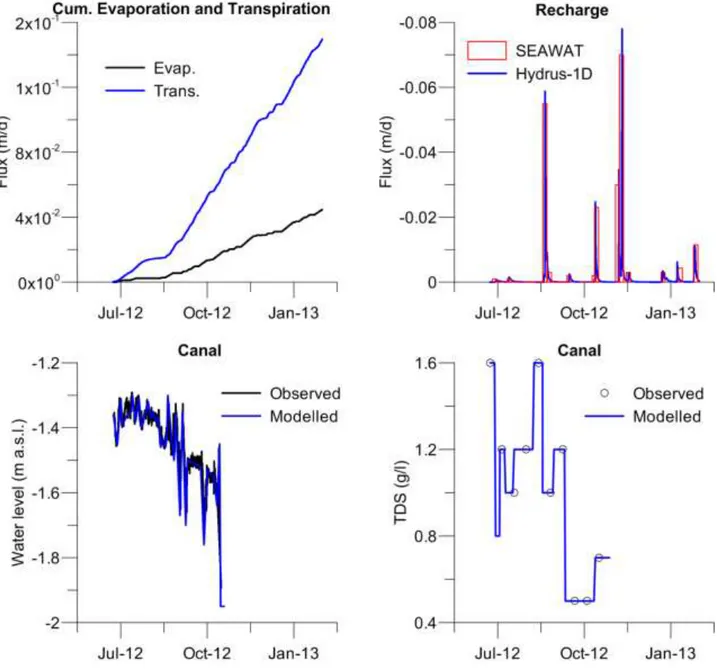
Figure 3.6 - In the upper left hand side plot, the actual cumulative transpiration (blue line) and evaporation rates (black line) computed by Hydrus-1D are shown. In the upper right hand
LIST OF FIGURES
iv
side plot, the recharge rate computed by Hydrus-1D (blue line) and its discretization as input in SEAWAT (red bars) are shown. In the lower left hand side plot, the modelled (blue line) and observed (black line) canal water levels are shown. In the lower right hand side plot, the modelled (blue line) and observed (black open circles) canal TDS values are shown.
Figure 4.1 - (a) Profiles of hydraulic conductivity measured by constant rate pumping tests in the four monitoring wells and (b) Scatterplot of K values calculated by pedotransfer formula (Kped) and K values resulting from permeability tests in P33 and P34.
Figure 4.2 - Transect AA’ across the coastal aquifer (trace in Figure 2.2) showing freshwater head (hf in green color) and seepage (qz in red color). Note: positive value means flow from
the bottom toward the surface, while negative values indicate downward flow (recharge). Figure 4.3 - Salinity (TDS in g/l) and concentration of the anions of major salts. The purple line indicates the TDS concentration of the current Adriatic Sea water.
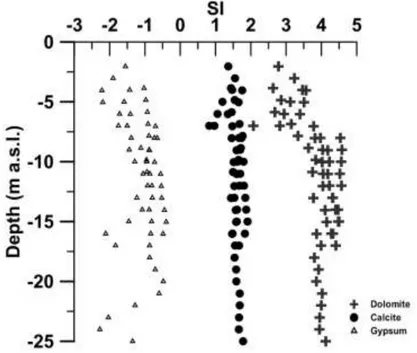
Figure 4.4 - Saturation index for gypsum, calcite and dolomite along the aquifer depth calculated with PHREEQC.
Figure 4.5 - Plots of the concentration of Br-, Na+, SO4-, and Mg2+ with respect to Cl-. The purple
lines indicate the non-reactive mixing line between freshwater and modern seawater; the star symbol indicates the concentration of the modern Adriatic Sea water.
Figure 4.6 - Variation of sample concentration of Na+, K+, Mg2+, and Ca2+ with respect to the
theoretical composition expected for a non-reactive mixing of Adriatic Sea water and freshwater. Note: positive values indicate enrichment, while negative values indicate depletion.
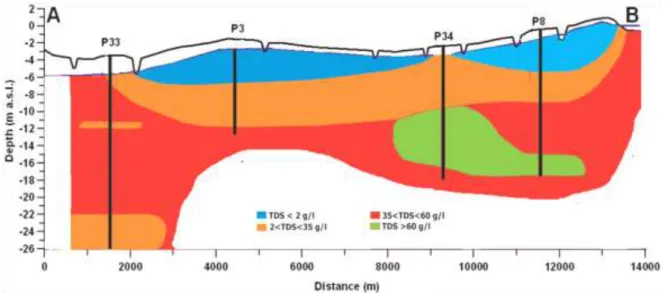
Figure 4.7 - TDS versus Depth, blue circles indicate the MLS samples and red crosses indicate the IDS samples. Water quality classes are drawn according to Davis and De Wiest (1996). Figure 4.8 - TDS distribution along the coastal aquifer. Dashed lines indicate TDS values of monitoring campaign in November 2011.
Figure 4.9 - Plot of Cl-/Br- molar ratio versus Cl- (meq/l) for the groundwater samples (left
panel). Plot of Cl- versus Br- (meq/l) for the groundwater samples (right panel). Black lines
indicate the ideal mixing line between actual freshwater and seawater, while the grey shaded areas represent the mixing area.
LIST OF FIGURES
v
Figure 4.11 - Plots of salinity with MLS versus OBL data for each monitoring well along transect AA’; stratigraphy (core logs data) from figure 2.2 is displayed on each plot to assist the interpretation.
Figure 4.12 - Plots of pH with MLS versus OBL data for each monitoring well along the transect AA’; stratigraphy (core logs data) from figure 2.2 is displayed on each plot to assist the interpretation.
Figure 4.13 - Plots of Eh with MLS versus OBL data for each monitoring well along the transect AA’; stratigraphy (core logs data) from figure 2.2 is displayed on each plot to assist the interpretation.
Figure 4.14 - Plots of O2 with MLS versus OBL data, for each monitoring well along the
transect AA’; stratigraphy (core logs data) from figure 2.2 is displayed on each plot to assist the interpretation.
Figure 4.15 - TDS versus Depth, blue circles indicate the MLS samples and red crosses indicate the IDS samples. Water quality classes are drawn according to Davis and De Wiest (1996). Figure 4.16 - Eh versus depth for selected monitoring wells. Blue circles indicate the MLS values and red lines indicate the IDS values.
Figure 4.17 - Eh versus pH plot. Grey shaded areas identify the main TEAP environments. Figure 4.18 - Cl- distribution maps, according to Stuyfzand classification (1989), derived using
IDS data (left panel) and MLS data from the upper aquifer portion (mid panel) and from the lower aquifer portion (right panel).
Figure 4.19 - Subdivision of the model in drainage basins.
Figure 4.20 - Scatter diagrams of calculated and measured hydraulic head (left plot) and of salt concentrations (right plot).
Figure 4.21 - Piezometric map of the calculated heads (m a.s.l.).
Figure 4.22 – Three-dimensional isoconcentration map of the calculated salt concentrations, along the transect AA’.
Figure 4.23 - Plots of continuous piezometric head monitoring of monitoring well P8 (black line) and sea level (red line). The left plot shows the entire monitoring period, while the right plot shows a zoomed timeframe of one week when the tidal oscillation is more evident. Note that the y scales have different ranges.
LIST OF FIGURES
vi
Figure 4.24 - Location of the study area and conceptual model of the transect across monitoring well P8 and Canale della Gronda, selected for the two-dimensional numerical model.
Figure 4.25 - In the left hand side plots: comparison of modelled hydraulic heads (blue lines) versus observed hydraulic heads (grey lines) and their running average with daily period (black lines), In the right hand side plots: comparison of modelled TDS (blue lines) versus observed TDS (grey lines) and their running average with daily period (black lines). The observed water levels and TDS in the drain ditch are plotted with black open circles.
Figure 4.26 - In the upper panels the simulated TDS contours for 12/12/2012 (left panel) and for 26/02/2013 (right panel) are shown with the location of P8. Profiles in P8 of modelled (black lines) versus observed (black open circles) TDS used to validate the numerical model are shown in the lower plots.
Figure 4.27 - In the upper panels the actual average TDS contours for the end of the summer (left panel) and for the end of the winter (right panel) are plotted, while the future scenarios are all plotted for the end of the summer conditions. The projected LSLR are shown in the left panels and HSLR are shown in the right panels. The black line represents the 2.5 g/L TDS isoline.
Figure 4.28 - Location of the study area with the piezometric contour map (black lines); circles represent the groundwater NH4+ concentration at 1 m below the water table in the 59
piezometer investigated; in black colour the four selected piezometers along a flow line (dashed line corresponding to transect AA’ in Fig. 2.2).
Figure 4.29 - Distribution of NO3- and NH4+ concentrations for the 59 monitoring wells with
respect to redox values (Eh).
Figure 4.30 - Depth profiles of sediment TOC, TLN and NH4+; stratigraphy (core logs data) is
plotted on each graph to facilitate the interpretation.
Figure 4.31 - Transect along the selected flow line (refer to figure 4.28 for the location) with concentration profiles of NH4+, NO3- and NO2-; unconfined aquifer thickness (shaded grey
area), water table (blue line) and core logs stratigraphy are also shown. Note that curves are plotted at different horizontal scale to facilitate the graph interpretation.
Figure 4.32 - Transect along the selected flow line (refer to figure 4.28 for the location) with concentrations profiles of NH4+ and TDS; unconfined aquifer thickness (shaded grey area),
water table (blue line) and core logs data are also shown. Note that curves are plotted at different horizontal scale to facilitate the graph interpretation.
LIST OF FIGURES
vii
Figure 4.33 - Salinity versus Sr2+ concentration in deep (from -25 to -9 m a.s.l.), medium (from
-9 to -7 m a.s.l.), and shallow (from -7 to +1 m a.s.l.) samples (left graph); grey bars represent salinity and Sr2+ concentration of the Adriatic seawater. NH4+ versus Sr2+ concentration in
deep (from -25 to -9 m a.s.l.), medium (from -9 to -7 m a.s.l.), and shallow (from -7 to +1 m a.s.l.) samples (right graph); grey bars represent NH4+ and Sr2+ concentration of the Adriatic
seawater.
Figure 4.34 - Scatter plots of selected TE in sediments versus clay content and their relative regression coefficients (R2) for linear fitting.
Figure 4.35 - Depth profiles of TDS, Eh and selected redox species in groundwater and sediments; stratigraphy (core logs data) is reported on each plot to facilitate the interpretation.
Figure 4.36 - Depth profiles of TE in groundwater and sediments; stratigraphy (core logs data) is reported on each plot to facilitate the interpretation.
LIST OF TABLES
viii LIST OF TABLES
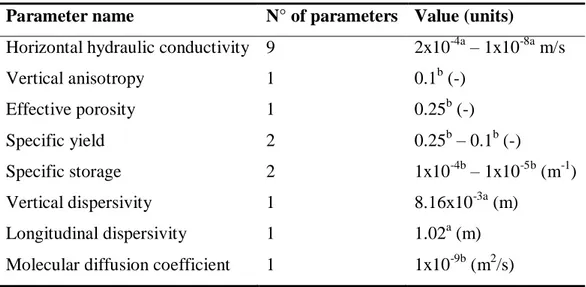
Table 3.1 - Flow and transport parameters used for the simulations. Table 4.1 - Core sample analyses of monitoring wells P33 and P34.
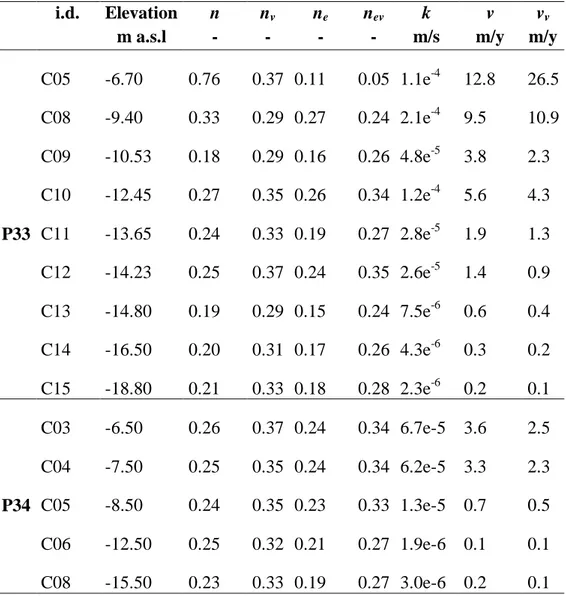
Table 4.2 - Values of measured total porosity (n), calculated total porosity by Vukovic and Soro (1992) (nv), respective effective porosity (ne, nev) and pore-water velocity (v and vv), and
measured hydraulic conductivity (k) in monitoring wells P33 and P34.
Table 4.3 - Discrepancy between MLS and IDS values concerning the major ions, the symbol – is used when concentrations are below detection limit.
Table 4.4 - Discrepancy between MLS and IDS values concerning the physical-chemical parameters.
Table 4.5 - Comparison between the observed and calculated volume of water (m3/s)
discharged to the sea by the 5 main dewatering stations.
Table 4.6 - Hydraulic heads composite scale sensitivity values calculated by PEST.
Table 4.7 - Absolute mean error between observed and calculated values of the calibrated and validated models.
Table 4.8 - Scenario modelling of the predicted variations of freshwater maximum thickness respect to the actual situation, with sub-scenarios of projected low sea level rise (LSLR) and high sea level rise (HSLR). Positive values indicate thinning of freshwater lens, while negative values indicate thickening.
Table 4.9 - Chemical composition of samples from P33 and P34. Depth are expressed as relative to mean sea level.
Table 4.10 – Derived parameter values in the sediment samples collected from P33 and P34 (in italics). SOM and clay content reported from Mastrocicco et al. (2012). Depth are expressed as relative to mean sea level.
Table 4.11 - TE concentrations in groundwater samples from P33 and P34. Depth are expressed as relative to mean sea level.
RIASSUNTO
ix
RIASSUNTO
Contesto e motivazione
Le risorse idriche sotterranee delle aree costiere sono sottoposte ad una crescente attenzione come fonte di approvvigionamento idrica grazie alla loro minor vulnerabilità all'inquinamento rispetto alle acque superficiali ed alla elevata capacità di stoccaggio degli acquiferi (Dillon, 2005). Tuttavia, in assenza di sistemi di gestione sostenibile delle risorse idriche, un incontrollato uso del suolo ed il sovrasfruttamento delle falde, possono portare ad un deterioramento significativo e di lunga durata delle risorse idriche e degli ecosistemi da esse dipendenti (Candela et al., 2009; Grassi et al., 2007; Park et al., 2005).
Per queste ragioni, negli ultimi decenni la ricerca sugli acquiferi costiere si è intensificata soprattutto per quanto riguarda i processi di salinizzazione (Barlow e Reichard, 2010; Custodio, 2010; Post e Abarca, 2010; Werner et al., 2013). Tuttavia, l’individuazione delle sorgenti di salinizzazione delle falde costiere non è semplice in quanto essa può derivare sia da fonti naturali che antropiche e, in molti casi, più sorgenti possono agire contemporaneamente in uno stesso acquifero (Cartwright et al., 2004; Fakir et al., 2002; Lenahan e Bristow, 2010; Sanchez Martos et al., 2002). In alcune zone costiere, la questione della salinizzazione delle acque sotterranee vede il coinvolgimento non solo di acqua marina attuale ma anche di acque di mare relitte e acque ipersaline (Fass et al., 2007; Ridd e Stieglitz, 2002; Wood et al., 2003). In questi casi, la distinzione tra intrusione attuale e relitta è fondamentale per costruire un modello concettuale robusto con il quale definire un programma di gestione sostenibile (Werner e Gallagher, 2006). Qualunque sia la sorgente salina, la sua identificazione è spesso complicata dalle interazioni suolo-acqua, per altro amplificate dall’aumento della forza ionica dell'acqua (de Montety et al., 2008), e dai processi di miscelazione spesso accelerati dalle attività antropiche come l'eccessivo pompaggio o l’escavazione di canali artificiali (Barlow e Reichard, 2010; Custodio, 2010; Kass et al., 2005; Yamanaka e Kumagai, 2006).
Un tema chiave per comprendere i processi di salinizzazione è quello della corretta caratterizzazione verticale delle proprietà fisico-chimiche degli acquiferi (de Louw et al., 2010; 2011; Netzer et al., 2011). La variabilità nella composizione chimica verticale delle acque sotterranee è stata descritta sia tra diverse unità idrogeologiche della medesima falda (Nativ e Weisbrod, 1994) che su piccole sezioni di una data unità idrologica (Dhar et al., 2008). Gli acquiferi costieri sono spesso costituiti da sequenze di strati con differenti proprietà idrauliche (Bear et al., 1999), che possono complicare l’andamento dell'interfaccia acqua dolce/acqua salata (Kim et al., 2008) e quindi i pozzi di monitoraggio delle zone costiere possono agire come cortocircuiti verticali fra strati (Werner et al., 2013) inducendo un flusso verticale locale (Elci et al., 2003) che può causare il trasporto dei soluti (Konikow e Hornberger, 2006) compromettendo le misure concernenti la distribuzione della salinità (Shalev et al ., 2009).
RIASSUNTO
x
Le diagrafie (OBL) sono spesso impiegate per individuare l‘interfacce acqua dolce/acqua salata negli acquiferi costieri e per caratterizzarne le zone redox (Jorstad et al., 2004; Kim et al., 2008). Tuttavia, anche se questo metodo di monitoraggio è semplice, economico e veloce, la tecnica OBL ha alcune limitazioni, in particolare nelle zone costiere dove i valori misurati (di salinità o di qualsiasi altra proprietà dell'acqua) potrebbero essere rappresentativi della colonna d'acqua stratificatasi all’interno del pozzo, ma non necessariamente del mezzo poroso circostante (Balugani e Antonellini, 2010; Kurtzman et al., 2011; Shalev et al., 2009).
Allo stesso modo, il campionamento integrato (IDS) fornisce campioni d'acqua che rappresentano un'integrazione indefinita della qualità delle acque sotterranee per l'intera lunghezza del pozzo (Robbins e Hayden-Martin, 1991) ed è quindi in gran parte carente ai fini dello studio dei processi di salinizzazione, dal momento che in un acquifero costiero la stratificazione delle acque in funzione della loro densità è la regola piuttosto che l'eccezione. Al contrario, il campionamento multilivello (MLS) della falda acquifera è in grado di fornire una distribuzione tridimensionale della qualità delle acque sotterranee all'interno di un sistema acquifero costiero (Mastrocicco et al., 2012c). La tecnica MLS è abitualmente applicata in siti contaminati per mappare la diffusione dei contaminanti e quantificare i percorsi di reazione biogeochimici (Colombani et al., 2009; Henderson et al., 2009; Mastrocicco et al., 2012b; Prommer et al., 2006), ma è meno frequentemente utilizzata nel monitoraggio della salinizzazione nelle zone costiere a causa dei costi elevati e dei tempi lunghi (Einarson e Cherry, 2002). La spesa, tuttavia, non cancella la necessità di una caratterizzazione in funzione della profondità per stimare correttamente la composizione chimica delle acque sotterranee e migliorare quindi la comprensione dei processi che agisco nelle zone costiere.
La discretizzazione verticale negli acquiferi è fondamentale non solo per comprendere i processi di salinizzazione ma anche nello studio della distribuzione e la speciazione di alcuni composti maggiori ed in tracce che, in seguito all’aumentata della forza ionica delle acque sotterranee, potrebbero essere rimobilizzati. Dalla diffusione di contaminanti geogenici o di origine antropica disciolti nelle acque sotterranee, derivano potenziali rischi non solo per le acque superficiali (Li et al., 2014) ma anche per le colture (Li et al., 2010). Ad esempio, un aumento delle concentrazioni di azoto reattivo (N) può essere responsabile di pericoli per la salute (Gelberg et al., 1999; Guliš et al., 2002), dell'eutrofizzazione delle acque superficiali (Jayasingha et al., 2011) e della crescita di alghe nelle acque marino costiere con conseguenti danni non solo ambientali ma anche alle attività turistiche (Linderfelt e Turner, 2001). L’aumento del contenuto di N nelle acque superficiali e sotterranee è stato comunemente attribuito a fonti antropiche, quali la presenza di scarichi civili o di attività agricole e/o industriali (Rodvang e Simpkins, 2001). Minore attenzione è stata data alle sorgenti naturali di N nelle acque sotterranee, quali ad esempio un arricchimento dovuto al contributo di processi di interazione acqua/sedimento, la mineralizzazione della sostanza organica, (Lorite-Herrera et al., 2009) e il rilascio di NH4+ per scambio cationico in condizioni anossiche
(Appelo e Postma, 2005; Lewandowski e Nützmann, 2010; Seitzinger et al., 1991).
Un altro argomento in cui la discretizzazione verticale è inevitabile è lo studio della distribuzione degli elementi in traccia (TE) nelle acque sotterranee con salinità variabile e nei sedimenti associati. I TE posso derivare da fonti antropiche quali attività agricole, industriali e
RIASSUNTO
xi
minerarie (Buggy e Tobin, 2008; Du Laing et al., 2009), ma possono anche essere legati alla naturale composizione delle formazioni da cui derivano i sedimenti erosi o alle reazioni di scambio promosse dall'intrusione di acque saline (Teuchies et al., 2013). La contaminazione da metalli geogenici è infatti possibile soprattutto nelle zone costiere dove la forza ionica delle acque sotterranee può essere molto elevata, favorendo così la consistente mobilitazione di TE (Acosta et al., 2011; Wang et al., 2012; Cidu et al., 2013; Delaune et al., 2008. Dévai et al., 2005; Du Laing et al., 2008).
Un caso particolare è rappresentato dalle zone costiere che si trovano sotto il livello del mare, che in futuro, con l'aumento del livello del mare previsto dai cambiamenti climatici (Werner et al., 2013), potrebbero sperimentare un aumento della risalita delle acque saline presenti alle base degli acquiferi, grazie ai flussi verticali indotti dalle attività di bonifica indispensabili per mantenere asciutti i terreni delle pianure alluvionali utilizzati per l'agricoltura (Louw et al., 2013; Giambastiani et al., 2013; Mollema et al., 2013; Hinsby et al., 2008; Vandecasteele et al., 2006).
Con il recente perfezionamento delle proiezioni dei cambiamenti climatici, è aumentato il numero degli studi che valutano gli effetti delle crescenti pressioni sugli acquiferi costiere (Ranjan et al., 2006; Werner et al., 2013). Diversi studi hanno cercato di quantificare l'effetto dell’innalzamento del livello marino (SLR) sull’intrusione di acque marine in acquiferi costieri. Considerando l'Europa, la vulnerabilità delle aree costiere al SLR è stata indagata da Lebbe et al. (2008) e da Vandenbohede et al. (2008) per la pianura costiera del Belgio, da Oude Essink (2010) per i Paesi Bassi, da Feseker (2007) per il Nord-ovest della Germania, da Fujinawa et al. (2009) per la regione orientale della Turchia, da Giambastiani et al. (2007) e da Colombani et al. (2015a) per le falde acquifere costiere di Ravenna e Ferrara. La maggior parte di questi studi sottolineano la salinizzazione dell’acquifero costiero spesso mette a rischio anche le risorse idriche superficiali. Recenti studi hanno esaminato le interazioni quantitative a grande scala tra acque superficiali e sotterranee in prossimità della costa (Oude Essink et al., 2010; Vandenbohede et al., 2008) ma meno è stato fatto per chiarire le interazioni a piccola scala tra acque sotterranee e canali di irrigazione e drenaggio. Solo di recente sono stati pubblicati alcuni studi dettagliati in cui i processi di flusso e trasporto del sale in pianure agricole bonificate sono stati quantificati e modellati (de Louw et al., 2010; 2011; 2013).
Una volta che un modello concettuale affidabile è stato costruito, l'implementazione di modelli numerici di flusso e trasporto densità-dipendenti, come SEAWAT (Guo e Langevin, 2002; Langevin et al., 2007) e MODFLOW (Harbaugh et al., 2005; McDonald e Harbaugh, 1988), costituisce un valido approccio per capire: (i) i meccanismi di salinizzazione (da intrusione di acqua di mare attuale e per risalita di acque saline relitte), (ii) il loro effetto sulla mobilitazione di contaminanti geogenici e (iii) gli impatti che i diversi scenari di cambiamenti climatici avranno su questi fenomeni. L’utilizzo di tali strumenti, vincolati ai rilievi di campo, consentirà migliorare la gestione dell’interazione tra acque superficiali e sotterranee e di individuare eventuali misure di mitigazione degli impatti per evitare il deterioramento delle risorse idriche.
RIASSUNTO
xii
Significatività dell’area di studio prescelta
Le aree soggette a deterioramento delle acque sotterranee sono prevalentemente pianure costiere densamente popolate, che più di altre sono esposte alle perturbazioni antropiche e alle conseguenze dei cambiamenti climatici. Tra i problemi che queste aree devono affrontare, la salinizzazione delle risorse sia di superficie che sotterranee sembra essere il più preoccupante, soprattutto in pianure intensamente coltivate.
Per questo motivo, l‘acquifero costiero non confinato della Provincia di Ferrara, situato nella pianura del delta del fiume Po, è stato scelto come area di studio per esaminare i meccanismi che regolano il processo di salinizzazione delle acque sotterranee.
Questo territorio è stato ampiamente studiato negli ultimi decenni e un gran numero di contributi provenienti da discipline diverse permettono di ottenere una solida conoscenza dell'evoluzione geologica e geomorfologica della falda costiera della Provincia di Ferrara. D'altra parte, essendo le acque sotterranee poco sfruttate a causa delle abbondanti risorse idriche superficiali, gli studi sulle falde acquifere locali sono limitati.
Per migliorare la comprensione degli aspetti idrologici e idrochimici dell'acquifero costiero sono stati utilizzati, 11 dei 30 pozzi di monitoraggio delle rete del Servizio Geologico della Regione Emilia Romagna insieme con 38 pozzi di monitoraggio pre-esistenti della Provincia di Ferrara.
Oltre al buon livello di dettaglio con cui questa zona è stato indagata, altri fattori la rendono ideale per condurre lo studio oggetto di questa tesi: (i) la zona costiera di Ferrara è intensamente coltivata sin dalla sua bonifica più recente (metà del 1900), (ii) ancora oggi il sistema di drenaggio è necessario per abbassare la falda e garantire la coltivabilità dei terreni, (iii) l'irrigidimento della rete idrografica causata dalla bonifica ha aumentato la subsidenza del terreno, già naturalmente presente, (iv) l'aumento della differenza tra la quota del piano campagna ed il livello del mare ha favorito l’ingressione marina nella rete idrografica, (v) la salinizzazione del suolo danneggia la produttività agricola, (vi) la diminuzione della disponibilità delle risorse idriche, specialmente nel periodo estivo, rappresenta un rischio per lo sviluppo delle attività turistiche.
L'analisi dei risultati aiuterà le autorità locali a gestire correttamente le risorse idriche costiere e permetterà di individuare possibili azioni di mitigazione del fenomeno della salinizzazione delle acque sotterranee e superficiali.
Va comunque sottolineato che lo studio qui presentato si è focalizzato esclusivamente sugli aspetti fisico-chimici del problema della salinizzazione senza tener conto degli aspetti economici di tale problematica, che sono altrettanto importanti per l'identificazione e l'attuazione delle azioni di mitigazione. Tuttavia, il protocollo di caratterizzazione impiegato in questo studio potrebbe essere applicato con successo in molte altre zone costiere con problemi analoghi a quelli descritti per l’area costiera ferrarese.
RIASSUNTO
xiii
Obiettivi della tesi
A causa dell'impatto potenzialmente irreversibile del deterioramento della qualità delle risorse idriche , l'obiettivo primario di questa tesi è stato quello di ottenere una comprensione quantitativa dei processi che hanno causato la salinizzazione delle acque sotterranee nella falda acquifera costiera ferrarese. In secondo luogo si è voluto indagare l’impatto che i cambiamenti climatici potranno avere sul processo di salinizzazione in atto e le eventuali conseguenze che un aumento di salinità possono avere sulla mobilizzazione di contaminanti sia maggiori che in tracce. Alla luce di quanto detto sin qui, lo studio in oggetto si propone di raggiungere i seguenti obiettivi:
Caratterizzazione della falda acquifera costiera della pianura di Ferrara: idrologia, idrochimica ed evoluzione del sistema
La caratterizzazione idrodinamica e idrogeochimica della falda acquifera costiera ferrarese, soggetta a profondi cambiamenti naturali e antropici dall'ultima glaciazione ad oggi, ha permesso di comprendere le cause che hanno portato alla salinizzazione delle acque sotterranee (vedi capitolo 4.1).
Le acque saline e ipersaline sono per lo più associate a sedimenti fini di retro-barriera e ambienti lagunari, legati alla trasgressione Flandriana, mentre le acque dolci e salmastre sono legate a sistemi di dune e spiagge relitte. Le acque ipersaline si trovano nella parte più profonda della falda acquifera e non possono essere associate all’intrusione marina attuale ma testimoniano piuttosto la presenza di acque marine relitte intrappolate in ambienti retro-dunali e lagunari durante le fasi interglaciali dell’Olocene. Dati di campo mostrano come gli elevati tenori di salinità (superiori all’acqua di mare) possano essere attribuiti all’evaporazione diretta e/o alla traspirazione di acqua di mare prima della sua infiltrazione. La parametrizzazione idrodinamica dell’acquifero ha permesso di individuare la presenza di un gradiente idraulico verticale dovuto al drenaggio delle rete di canali di bonifica presenti nell’area. Di conseguenza le acque saline precedentemente intrappolate nella parte più profonda dell‘acquifero da lenti a bassa permeabilità, sono state trasportate verso la parte superficiale della falda e addirittura scaricate nella rete di canali di irrigazione.
L'indagine idrogeochimica ha anche permesso di distinguere tra il ruolo della miscelazione tra acque a diversa salinità e quello dell’interazione acqua/sedimento (scambio ionico, dissoluzione/precipitazione di calcite e dolomite, ossidazione della materia organica, riduzione dei solfati) nell'evoluzione delle acque sotterranee. Le acque più saline infatti sono caratterizzate da scambio cationico e riduzione di SO42-, soprattutto dove è presente materia
organica fossile (depositi paleo-palustri e strati di torba). L'insieme di tali processi comporta poi l'aumento del contenuto di Ca2+ e HCO3- nelle acque sotterranee con conseguente
RIASSUNTO
xiv
Importanza di tecniche di monitoraggio nella comprensione dei processi di salinizzazione L'esperienza in campo ha dimostrato che una dettagliata caratterizzazione verticale è l'unico metodo che può restituire una ricostruzione affidabile della distribuzione delle specie disciolte all'interno della falda freatica. Per questo motivo sono state applicate diverse tecniche di monitoraggio per acquisire i principali parametri fisico-chimici in funzione della profondità: diagrafie (OBL), campionamento integrato (IDS) e campionamento multilivello (MLS). I risultati derivanti dall’applicazione delle diverse tecniche di monitoraggio sono stati quindi confrontati per individuare la metodologia più adatta ed efficace (vedi capitolo 4.2). Il confronto tra la tecnica OBL e la tecnica MLS mostra che, escludendo la distribuzione delle acque saline e ipersaline alla base dell’acquifero, le due metodologie non presentano differenze significative. Ne consegue che il metodo OBL può essere utilizzato con successo per una determinazione preliminare della posizione dell’interfaccia acqua dolce/acqua salata. Tuttavia, il metodo OBL ha fornito una caratterizzazione fuorviante della distribuzione degli ambienti redox all'interno della falda poiché la distribuzione dei dati idrochimici (pH, Eh e O2)
raccolti con la tecnica OBL non concorda con quella della tecnica MLS. Ne consegue che uno studio più dettagliato sui processi geochimici reattivi può essere intrapreso solo attraverso la tecnica MLS, che è comunque preferibile anche quando è richiesto un elevato livello di precisione nel descrivere la distribuzione delle acque ad elevata salinità.
Un confronto diretto tra l’affidabilità delle tecniche di monitoraggio IDS e MLS è stato effettuato derivando due diversi modelli concettuali della distribuzione della salinità sulla base dei monitoraggi effettuati con l’una e con l’altra tecnica.
Il disaccordo nell'interpretazione dei risultati ottenuti con le due tecniche di campionamento è particolarmente evidente nell'analisi del TDS rispetto alla profondità, e del Eh rispetto al pH. Il modello concettuale IDS richiama il fenomeno dell’intrusione marina attuale, poiché le concentrazioni di Cl- non sono mai superiori a quella dell'acqua di mare e per l'assenza di
acque ipersaline in tutta l'area di studio. Al contrario, nel modello concettuale MLS la parte inferiore della falda freatica presenta acque ipersaline rendendo necessario considerare processi di salinizzazione diversi dall’intrusione marina attuale, come l'evoluzione geochimica delle acque sotterranee causata dall’evapoconcentrazione o l’interazione acqua/sedimenti. Le discrepanze tra il monitoraggio effettuato via MLS e IDS risultano particolarmente evidenti specialmente nel caso di specie disciolte sensibili agli ambienti redox, confermando che nella tecnica IDS la miscelazione artificiale all’interno del pozzo può maschere la stratificazione verticale delle concentrazioni nella falda acquifera.
I risultati dimostrano non solo che la tecnica IDS è decisamente più imprecisa rispetto alla tecnica MLS, ma addirittura che essa potrebbe dare rappresentazioni fuorvianti della realtà. Pertanto, i modelli concettuali ottenute tramite la tecnica IDS non possono neppure essere considerati uno studio preliminare in un acquifero costiero affetto da salinizzazione ma dovrebbero essere evitati con fermezza, soprattutto quando il contrasto di densità tra acque dolci e saline è particolarmente elevato.
RIASSUNTO
xv
Previsione dei trend di salinizzazione della falda acquifera costiera
Attraverso l'utilizzo della modellazione numerica, basata sui rilievi di campagna e sul conseguente modello concettuale, è stato possibile ricostruire e confermare l'ipotesi sull'origine di salinizzazione (vedi capitolo 4.3). La salinizzazione della falda dovuta al richiamo verso l'alto di acque ipersaline relitte ed il conseguente deterioramento della qualità anche delle acque superficiali, sono stati simulati tramite l’implementazione e la calibrazione di un modello di flusso tridimensionale (MODFLOW-2000) accoppiato ad un modello di trasporto non reattivo a densità variabile (SEAWAT).
Le simulazioni hanno chiaramente indicato che il principale driver del processo di salinizzazione è l’interazioni tra la falda freatica costiera e la rete di canali che richiamano verso l’alto le acque salate relitte. Questo processo, che è il risultato di un drenaggio avvenuto per secoli e che continua ancora oggi, influisce sulla qualità delle acque superficiali mettendo a rischio il loro futuro utilizzo a scopo agricolo e sottoponendo ad una crescente pressione gli ecosistemi costieri.
Per comprendere meglio l’evoluzione di tale fenomeno in un prossimo futuro, quando anche gli effetti dei cambiamenti climatici contribuiranno ad alterare i labili equilibri che governano gli scambi idrici tra acque sotterranee ed acque superficiali nella bassa pianura ferrarese, è stato implementato un modello numerico bidimensionale che tenesse conto di: (i) aumento dell’evapotraspirazione indotto dall’aumento della temperatura; (ii) aumento della frequenza di eventi di pioggia estremi; (iii) comparsa di condizioni di estrema siccità; (iv) e aumento del livello medio marino.
I risultati mostrano che in primavera e estate i canali di irrigazione ricaricano la falda diminuendo la falda salinità superficiale, anche nel caso di un aumento della temperatura (e quindi dell’evapotraspirazione). Al contrario, durante la stagione fredda i canali non sono più utilizzati per l'irrigazione e, rimanendo vuoti, portando ad una inversione di flusso che provoca un aumento della salinità nella falda superficiale dovuta al movimento verso l'alto dell’acqua ipersalina contenuta nei sedimenti di prodelta. Questo flusso verso l'alto salinizza lentamente i corpi d’acqua superficiali connessi con la falda acquifera tanto più quanto più è elevata la differenza di carico idraulico tra i due corpi idrici. Ne deriva che il previsto aumento de livello del mare influirà negativamente sui processi di salinizzazione, molto più di quanto non facciano l’aumento della temperatura o degli eventi di precipitazione estremi.
L’influenza della salinizzazione sui trend di concentrazione dell’ammonio e degli elementi nell’acquifero costiero
Dato che i cambiamenti climatici possono aumentare il tasso di salinizzazione della falda, per valutare se il cambiamento nelle attuali condizioni chimico-fisiche e idrodinamiche può anche indurre la mobilizzazione di elementi geogenici, sono stati studiati il contributo dell’interazione acqua/sedimento e l’influenza antropica sulla qualità delle acque sotterranee,
RIASSUNTO
xvi
focalizzando l'attenzione sull’azoto (vedi capitolo 4.4) e sugli elementi in traccia (vedi capitolo 4.5).
Per capire se i processi di salinizzazione possono svolgere un ruolo nella mobilitazione delle specie azotate, è stata condotta una caratterizzazione dettagliata riguardante la distribuzione spaziale e le possibili fonti di nitrati (NO3-) e ammonio (NH4+) nell’acquifero costiero
ferrarese. L’NH4+ è la specie di azoto inorganico prevalente nelle acque sotterranee. Mentre
NO3- è presente nella porzione superiore dell’acquifero dove esistono condizioni ossidanti, la
concentrazione di NH4+ aumenta con la profondità e la salinità. Concentrazioni molto elevate
di NH4+ si trovano in coincidenza con sedimenti torbosi presenti alla base dell’acquifero dove
sussistono condizioni anossiche e nell’aquitard sottostante. I risultati di questo studio mostrano che l’NH4+ deriva principalmente dalla mineralizzazione della sostanza organica
presente nei sedimenti fini depositati in ambienti paleo-palustri.
L'effetto dell’elevata salinità sulla mobilità degli elementi in traccia (TE), è stato studiato mediante l’analisi sia di campioni di falda sia di carote di sedimento, a varie profondità. La concentrazione totale di TE è maggiore nei sedimenti fini, ed in particolare nella frazione argillosa, mentre le concentrazioni di TE in falda aumentano con la forza ionica della soluzione e cioè con la profondità dal momento che la parte basale dell’acquifero presenta acque a maggior tenore di salinità. L'elevato contenuto di materia organica impone condizioni riducenti lungo tutto il profilo falda, cosa che promuove ulteriormente la mobilizzazione di TE. Le uniche eccezioni sono V e As, probabilmente rilasciati dalla lisciviazione dei fertilizzanti nella parte superiore della falda e da strati torbosi sepolti nella parte inferiore della falda acquifera. Pertanto, i risultati di questo studio mettono in evidenza la necessità di distinguere tra il rilascio di TE a causa dell‘alterazione dell'equilibrio acqua/suolo indotta dalla salinizzazione delle acque sotterranee ed il rilascio di TE in falda a causa di attività antropiche.
Implicazioni e prospettive
Il presente studio ha impiegato diverse discipline delle Scienze della Terra per indagare i fenomeni di salinizzazione dell’acquifero costiero ferrarese. Nessuna delle metodologie impiegate sarebbe stata in grado di garantire la completa comprensione del sistema idrogeologico in esame se applicata separatamente.
Discriminare tra processi di salinizzazione passati e attuali è spesso difficile, se non impossibile, soprattutto quando sono disponibili solamente i dati di salinità. La presenza di acque ipersaline nella falda acquifera costiera ferrarese dimostra che l'attuale situazione idrogeologica testimonia la presenza di acque relitte originatesi in un ambiente totalmente diverso da quello odierno. Ne deriva che l'interpretazione delle osservazioni attuali deve tener conto che la qualità dell'acqua continua ad evolversi dal passato, adattandosi alle condizioni al contorno contemporanee. La conoscenza della storia geologica della zona oggetto di indagine è quindi essenziale per riconoscere il potenziale contributo di processi idrologici passati alla situazione attuale.
RIASSUNTO
xvii
Inoltre, la scelta di un metodo di monitoraggio e campionamento affidabile è risultata di vitale importanza per la corretta identificazione delle proprietà fisiche dell’acquifero e della distribuzione della qualità delle acque sotterranee. Contare su appropriate tecniche di monitoraggio, come ad esempio il campionamento multilivello, è quindi importante tanto quanto selezione le giuste tecniche di analisi e di modellazione. Il campionamento multilivello non richiede competenze altamente specializzate o attrezzature particolarmente costose, tuttavia ancora oggi fatica ad imporsi negli studi sui processi di salinizzazione.
Questo studio, dimostrando in modo tangibile, come gravemente fuorviante potrebbe essere un modello concettuale più semplice, costruito sulla base di tecniche di monitoraggio inaffidabili, vuole essere un monito per i gestori delle risorse idriche che devono fare scelte difficili per la pianificazione della futura gestione e protezione delle acque sotterranee.
Infine, anche se i dati di campo sono indispensabili per comprendere il sistema idrogeologico in esame, i modelli numerici possono fornire un valido aiuto per testare le ipotesi del modello concettuale. Con il giusto approccio, l'uso congiunto di attività di campo e simulazioni può portare ad una migliore comprensione dei fenomeni ed a nuove intuizioni. Ad esempio, gli scenari numerici permettono di quantificare i possibili effetti dei cambiamenti climatici sulla salinizzazione delle acque sotterranee e le sue conseguenze sulla qualità delle risorse idriche, e potrebbero essere utili per trovare strategie di mitigazione per il futuro.
INTRODUCTION
1
1. INTRODUCTION
1.1 Background and motivation
In coastal areas groundwater has gained increasing attention as a source of water supply, owing to its relatively low vulnerability to pollution in comparison to surface water as well as its relatively large storage capacity (Dillon, 2005). However, in the absence of sustainable water resource management schemes, uncontrolled land-use activities and over-exploitations can lead to significant and long-lasting deteriorations of water resources and groundwater-dependent ecosystems (Candela et al., 2009; Grassi et al., 2007; Park et al., 2005). For these reasons, in the last decades the research on coastal aquifers has intensified especially with regards to salinization processes (Barlow and Reichard, 2010; Custodio, 2010; Post and Abarca, 2010; Werner et al., 2013). In these areas the saltwater intrusion is a well-known and studied problem, like the Polders in the Netherlands (Oude Essink et al., 2010) or in the south-eastern Florida (Langevin and Zygnerski, 2013) and the Po river lowland (Giambastiani et al., 2007).
The recognition of groundwater salinization origin in coastal aquifers is not straightforward. Salinization into coastal aquifers may occur from both natural and anthropogenic sources and in many cases salinity problems arise from more than one salt source (Cartwright et al., 2004; Fakir et al., 2002; Lenahan and Bristow, 2010; Sanchez Martos et al., 2002). In some coastal area, the issue of saline groundwater origins involves, beyond actual seawater, relic seawater and hyper-saline waters (Fass et al., 2007; Ridd and Stieglitz, 2002; Wood et al., 2003). In these cases, it is vital to distinguish between modern and ancient saltwater intrusion to build a robust conceptual model of groundwater salinization through which a sustainable management program can be designed (Werner and Gallagher, 2006). The most relevant salt sources/processes recognized worldwide are: evaporation, evaporite leaching, mobilization of salts stored in the unsaturated zone, infiltration of non-marine polluted surface waters, slow-moving saline/salt waters of marine origin, highly mineralised waters from geothermal fields (Fidelibus et al., 2011), sea spray, hyper-filtration, agricultural practices (return flow, use of fertilizers and irrigation with treated wastewater), cycling wetting and drying. Whatever the salt source, its identification is often puzzled by soil-water interactions amplified by the increased water ionic strength (de Montety et al., 2008) or by mixing processes enhanced by human activities as over-exploitation, land reclamation and construction of navigation channels along rivers or artificial canals (Barlow and Reichard, 2010; Custodio, 2010; Kass et al., 2005; Yamanaka and Kumagai, 2006).
A key issue to understand salinization processes is the correct characterization of vertical variability of aquifer properties governing groundwater quality (de Louw et al., 2010; 2011; Netzer et al., 2011). A variability in vertical chemical composition of groundwater has been described both among different hydrological units of the same aquifer (Nativ and Weisbrod, 1994) and over small sections of a given hydrological unit (Dhar et al., 2008). Coastal aquifers often consist of layered sequences with varying hydraulic properties (Bear et al., 1999) that
INTRODUCTION
2
can complicate monitoring of fresh–saltwater interface because of heterogeneity of the aquifer matrix (Kim et al., 2008). Therefore, coastal monitoring wells may act as vertical short circuits between layers (Werner et al., 2013), inducing local vertical flow due to connection between higher and lower hydraulic head zones (Elci et al., 2003). A common consequence is that ambient flow within long-screen wells may cause solute transport (Konikow and Hornberger, 2006), even in homogeneous aquifers with small vertical hydraulic gradients (Britt, 2005) and it may also compromise hydraulic head measurements (Shalev et al., 2009). Open borehole logging (OBL) is often employed to identify fresh-saltwater interfaces in coastal aquifers (Kim et al., 2008) and to characterize the redox zones within contaminant plumes (Jorstad et al., 2004). Even if this method of obtaining depth dependent groundwater quality data is plain, inexpensive and fast, the OBL technique has some limitations, most notably in coastal zones where measured values (salinity or any other water property) may be well representative of the stratified water column accumulated within the monitoring well, but not necessarily of the surrounding porous media (Balugani and Antonellini, 2010; Kurtzman et al., 2011; Shalev et al., 2009). Similarly, Integrated Depth Sampling (IDS) provides water samples representing an undefined integration of groundwater quality over the entire screen length (Robbins and Hayden-Martin, 1991): thus, it is largely deficient for the purposes of understanding salinization processes, since in coastal aquifer groundwater stratification is the rule rather than the exception.
On the contrary, Multi-Level Sampling (MLS) is an invaluable method that, by sampling at multiple intervals of an aquifer, allows the reconstruction of three-dimensional distribution of groundwater quality within a coastal aquifer system (Mastrocicco et al., 2012c). MLS is routinely applied in contaminated sites to map contaminant spreading and to quantify biogeochemical reaction pathways (Colombani et al., 2009; Henderson et al., 2009; Mastrocicco et al., 2011b; Prommer et al., 2006), but it is less frequently used in monitoring salinization in coastal areas because of high costs and time involved (Einarson and Cherry, 2002). The costs, however, cannot obscure the need for a dedicated depth-dependent groundwater monitoring, which is necessary to properly estimate the chemical composition of groundwater in coastal areas and to enhance the predictability of regional scale management models that will inevitably be required in the near future.
Depth-dependent aquifer characterization is essential to indentify vertical flow, which, beside salinizing the whole aquifer body, could enhance the mobility of geogenic and anthropogenic contaminants dissolved in groundwater, posing risk to surface water (Li et al., 2014) and to crop root uptake (Li et al., 2010). For instance, high-nitrogen loading in surface and ground waters is getting an increasing attention in order to fulfil the water quality objectives required by the Water Framework Directive (Directive 2000/60/EC, 2000). Nitrogen (N) enrichment is believed to be responsible for health hazards (Gelberg et al., 1999; Gulis et al., 2002) and deterioration of water quality, such as eutrophication (Jayasingha et al., 2011) and algal growth (Linderfelt and Turner, 2001). Increasing N content in surface and ground waters has been commonly explained evoking anthropogenic sources such as agricultural and industrial activities and sewage wastes (Rodvang and Simpkins, 2001).
INTRODUCTION
3
Many studies have focused on NO3- groundwater contamination in agricultural areas (Bohlke
et al., 2002; Mastrocicco et al., 2011a; Puckett et al., 2002) or in presence of anthropogenic sources (Aravena and Robertson, 1998); other studies have reported ammonium (NH4+)
contamination in groundwater due to rich wastewater spillage or landfill leachate plumes (Brun et al., 2002; Christensen et al., 2001). Less attention has been given to natural sources of N in ground waters. Thus, identification of potential sources of N and assessment of its speciation in aquifer is still needed. Elevated NH4+ contents of natural origin have been
reported in aquifers in different parts of the world: U.S. (Glessner and Roy, 2009; Hinkle et al., 2007), Mexico (Ortega-Guerrero, 2003), Asia (Jang and Liu, 2005; Jiao et al., 2010), Australia (Linderfelt and Turner, 2001) and Europe (Lorite-Herrera et al., 2009). Potential natural sources of NH4+ are mostly related to contribution of water/sediment interaction, such as
mineralization of sedimentary organic matter rich in organic N (Lorite-Herrera et al., 2009), and release of NH4+ from sediments, governed by cation exchange capacity under anoxic
conditions (Appelo and Postma, 2005; Lewandowski and Nützmann, 2010), especially in association with saline groundwater (Seitzinger et al., 1991).
Another topic where the vertical discretization is unavoidable is the study of trace element (TE) distribution of in groundwater with variable salinity and their associated sediments. TE can derive from anthropogenic sources like agricultural, industrial and mining activities (Buggy and Tobin, 2008; Du Laing et al., 2009), but they can also be related to weathering of host formations, or by cation or anion exchange reactions promoted by intrusion of saline waters (Teuchies et al., 2013). Geogenic metal contamination is of upcoming concern, especially in coastal areas where the ionic strength of groundwater can be very high, thus promoting substantial mobilization of TE (Acosta et al., 2011; Wang et al., 2012). In fact, many authors pointed out a potential significant threat related to the elevated trace and rare metals concentrations found in floodplain saline soils (Cidu et al., 2013; DeLaune et al., 2008; Devai et al., 2005; Du Laing et al., 2008). A peculiar case are the low lying areas, which represent a possibly extended problem throughout the world in the midterm future, with the forecasted sea level rise induced by climate changes (Werner et al., 2013). In these environments, the land reclamation usually induces upconing of the basal saline and hyperhaline groundwater (de Louw et al., 2013a; Giambastiani et al., 2013; Mollema et al., 2013). Thus, the ubiquitous presence of metals obliges to accurately prepare risk assessment studies especially in floodplains used for agriculture (Hinsby et al., 2008; Vandecasteele et al., 2006).
With the recent refinement of climate change projections, namely sea level rise (SLR) and changes in recharge and evapotranspiration patterns, the number of studies investigating the effects of raised pressures on coastal groundwater systems has increased (Ranjan et al., 2006; Werner et al., 2013). The IPCC 2014 reports (2014a; 2014b) predicted that climate change will have a range of impacts on water resources: annual runoff will decrease in southern Europe by 0 to 23% in 2020s and by 6 to 36% in 2070s; summer low flow may decrease down to 80% in some rivers in southern Europe; storage changes in soil moisture and recharge of groundwater will be largely reduced in valleys and lowlands; increasing drought risk in the Mediterranean might be amplified by water withdrawal leading to a strong competition for available water resources and for reduction of available drinking water (García-Ruiz et al.,
INTRODUCTION
4
2011). These problems may especially affect coastal areas where large socio-economic and environmental stresses are already observed. Several studies attempted to quantify the effect of SLR on salt water intrusion into a coastal aquifer. Werner and Simmons (2009) identified the major hydrogeologic controls on the impact of SLR on salt water intrusion in unconfined coastal aquifers by using a steady-state analysis with an analytical solution. They differentiated between flux-controlled and head-controlled systems and showed that SLR is more problematic for head-controlled systems because inland water levels do not rise with rising sea level. Chang et al. (2011) also found that for flux-controlled confined aquifers SLR may not have an impact on fresh water volumes. Watson et al. (2010) investigated the migration aspect and response time of salt water movement, concluding that in certain condition several centuries may be required for the salt water interface to reach equilibrium after SLR. Other studies focused on the effect of SLR on specific coastal settings. Just considering Europe, vulnerability of low-lying coastal areas to SLR has been addressed by Lebbe et al. (2008) and by Vandenbohede et al. (2008) for the Belgian coastal plain, by Oude Essink et al. (2010) for the Netherlands, by Feseker (2007) for North-western Germany, by Fujinawa et al. (2009) for the eastern Mediterranean coastal region of Turkey, by Giambastiani et al. (2007) and by Colombani et al. (2015a) for the unconfined coastal aquifers of Ravenna and Ferrara, Italy. Most of these studies point out that coastal aquifer salinization often directly endanger surface water resources. Recent studies have looked at quantitative interactions between surface and ground waters near the coast at large scales (Oude Essink et al., 2010; Vandenbohede et al., 2008), but less has been done to clarify the small scale interactions between groundwater and irrigation canals and drainage ditches. Only recently a few detailed case studies have been published, in which the actual flow and salt transport processes occurring in drained agricultural lowlands are quantified and modelled (de Louw et al., 2010; 2011; 2013).
Once a reliable conceptual model of the stresses acting on a territory has been built, a valuable approach to understand salinization mechanisms (both from seawater intrusion and saline seepage), their effect on the mobilization of geogenic contaminants, and the impacts that different climate change scenarios will have on these phenomena, is the implementation of predictive density-dependent groundwater flow and transport numerical models, like SEAWAT (Guo and Langevin, 2002; Langevin et al., 2007) and MODFLOW-2000 (Hill et al., 2000); such models are based on the commonly used groundwater code, MODFLOW, developed by the U.S. Geological Survey (Harbaugh et al., 2005; McDonald and Harbaugh, 1988). By means of such a comprehensive tool, based on field hydrodynamic and hydrogeochemical evidences, water managers will be enabled to better manage the surface/groundwater continuum, and to put in place prevention and/or mitigation measures to avoid water resources deterioration.
INTRODUCTION
5
1.2 Significance of the selected test site
The areas mostly prone to groundwater deterioration are the densely populated coastal plains, which more than other areas are exposed to anthropic perturbation and aftermath of climatic change. Among the issues that these areas have to face, the salinization of both surface and groundwater resources seem to be the more worrisome, especially in lowlands intensively farmed.
For this reason, the unconfined coastal aquifer of the Ferrara Province (Northern Italy), located in the Po River Delta lowland was selected to examine the extent of groundwater salinization, the mechanisms governing the salinization process, the response of the salinization rate to the expected impacts of climate change and the role of salinization on the mobilization of geogenic contaminants.
This territory has been widely studied in the last decades, and a large number of contributes from different disciplines allows achieving a robust knowledge of the geological and geomorphological evolution of the coastal aquifer of the Ferrara Province.
However, being the groundwater beneath the Po River Delta poorly exploited due to the abundant surface water resources, studies on the local aquifers are limited; thus, groundwater resources still need to be properly characterized and known in order to better manage the surface/groundwater continuum. To improve the understanding of the hydrological and hydrochemical aspects of the Ferrara coastal aquifer, since 2009 the Geological Survey of the Emilia Romagna Region developed a specific network of 30 monitoring wells as a mean of characterizing the saltwater intrusion along the Northern Adriatic coastal aquifer; 11 of these monitoring wells, falling within the coastal area of the Ferrara Province, together with 38 pre-existing monitoring wells, have been used to carry out the field activities required to improve the conceptual model of the study area.
Apart from the good level of detail with which this area has been investigated, other factors make it ideal for achieving the objective of the thesis: (i) the Ferrara coastal area is intensively farmed (Fig. 1.1) since its reclamation (late 1900), (ii) nowadays the drainage system is necessary to lower the water table because of the agricultural requirements, (iii) the stiffening of the hydrographic network due to reclamation activities has augmented land subsidence, (iv) the increasing difference in the elevation of the ground level and the sea level enhances seawater encroachment along the rivers, (v) the occurrence of present seawater intrusion and saline relict groundwater in the deepest part of the coastal aquifer has induced groundwater and soil salinization harming the agricultural productivity, (vi) the decrease in the availability of freshwater resources, especially in the summer period, poses a risk in the development of the tourist activities. All these factors make the area of the Ferrara Province ideal for conducting the study for the thesis.
The analysis of the results will help local authorities to properly manage coastal fresh water resources under increasing pressures, and eventually to identify reasonable countermeasures to decrease the salt load for the future. This thesis, however, only deals with the physical aspects of the territory and does not take into account the economic aspects, which are as
INTRODUCTION
6
important as the physical ones in the identification and implementation of sustainable adaptation initiatives. Nevertheless, the characterization protocol employed in this study could be successfully applied in many other similar coastal low lying areas worldwide, suffering from the same issues that are stressing the Ferrara coastal aquifer.
Figure 1.1 – Wheat fields in the Ferrara lowland (www.estense.com)
1.3 Objectives of the thesis
Because of the potentially irreversible impact of groundwater quality deterioration in the Ferrara coastal aquifer, answers concerning the assessment of the extent of the salinization problem, the understanding of the mechanisms governing salinization processes, and the sustainability of the current water resources management are urgent.
INTRODUCTION
7
Characterization of the lowland coastal aquifer of Ferrara: hydrology, hydrochemistry and evolution of the system
The actual hydrogeochemistry and the geological evolution of the unconfined coastal aquifer of Ferrara have been addressed in order to understand the drivers of groundwater salinization. Physical aquifer parameterization was performed to infer the presence of a vertical hydraulic gradient due to the drainage system. Seepage of relict seawater, trapped within low permeability sediments during the Holocene transgression, was found to be responsible for groundwater salinization. The hydrogeochemical investigation allows also distinguishing between the role of seepage and water–sediment interactions (such as NaCl solution, ion-exchange, calcite and dolomite dissolution/precipitation, oxidation of organic matter, and sulphate bacterial reduction) in the evolution of groundwater chemistry.
The importance of data acquisition techniques in saltwater intrusion monitoring
A detailed vertical characterization of the Ferrara coastal aquifer is unavoidable to properly monitor salinity distribution. Physical-chemical depth-dependent logs were obtained by different techniques: Open-Borehole Logging (OBL), Integrated-Depth Sampling (IDS), and Multi-Level Sampling (MLS) via straddle packers. The OBL led to a satisfactory reconstruction of the extent of the fresh-saltwater interface, but provided a misleading characterization of the distribution of redox environments within the aquifer. The IDS conceptual model recalls the phenomenon of actual seawater intrusion, with Cl
-concentration never exceeding that of seawater and the absence of hypersaline groundwater all over the study area. On the contrary, good fits between sedimentological, stratigraphycal and physical-chemical data were obtained using the MLS. In the MLS-derived conceptual model the lower portion of the unconfined aquifer shows hypersaline groundwater, leading to necessarily consider salinization processes other than seawater intrusion, like the water/sediment interaction or the geochemical evolution of groundwater due to evapo-concentration. Results demonstrate the need to use MLS in reconstructing a reliable conceptual model, especially in areas where the density contrast between fresh and saline groundwater is large.
Predicting salinization trends in the lowland coastal aquifer
A conceptual model based on detailed topography and bathymetry, stratigraphyc information from analysis of well logs, well driller’s reports and pumping tests was developed to quantify the possible impacts of climate change on the whole coastal groundwater system in the Ferrara Province. On the basis of such a conceptual model, a three-dimensional variable-density groundwater flow model coupled with solute transport was developed; it was calibrated using highly parameterized inversion techniques with MODFLOW-2000 to ensure that the model is a reasonable representation of the physical
INTRODUCTION
8
system. The calibrated model was employed to constrain a two-dimensional numerical simulation, using SEAWAT, capable of investigating the interactions between the coastal unconfined aquifer and the canals network, and to quantify the possible future effects of climate change on groundwater salinization with a multiple scenario approach: (i) increase in evapotranspiration induced by temperature increase; (ii) increase in the frequency of extreme high rainfall events; (iii) extreme drought conditions; (iv) and canal dewatering due to salinization of the water courses. The results show that the Ferrara coastal area will experience a significant salinization and that the major cause is autonomous salinization via seepage of saline groundwater.
Ammonium occurrence in a salinized lowland coastal aquifer
Impacts induced by climate change may consist in the modification of water/sediment interaction. A detailed characterization concerning the spatial distribution and the possible sources of nitrate and ammonium concentrations in the Ferrara coastal aquifer was completed to understand if salinization processes may play a role in the mobilization of nitrogen species. Ammonium is the prevalent nitrogen inorganic species in groundwater, and its concentration increases with depth and salinity. Very high ammonium concentrations are found in coincidence with peaty sediments in the salinized anoxic aquifer and in the low-lying aquitard. The results from this study show that the elevated ammonium concentration derives from the mineralization of organic matter present in fine sediments deposited in paleo-marsh environments.
Trace elements mobility in a saline coastal aquifer
The effect of elevated salinity on the mobility of trace elements (TE) was studied. The use of intensive depth profiles gave insights into groundwater and sediment matrix interactions. The total concentration of TE within the aquifer matrix was higher in the fine sediments, since usually TE concentrate in the clay fraction, while groundwater concentrations generally increased with the ionic strength of the solution. Still, some TE did not follow this trend, being probably released by fertilizers leaching. Thus, the results from this study highlight the need to distinguish between the release of TE due to alteration of water/soil interaction equilibrium induced by groundwater salinization and the release of TE in groundwater due to anthropogenic activities.