2016
Publication Year
2020-06-29T11:00:08Z
Acceptance in OA@INAF
The ALMA Spectroscopic Survey in the Hubble Ultra Deep Field: Implications for
Spectral Line Intensity Mapping at Millimeter Wavelengths and CMB Spectral
Distortions
Title
Carilli, C. L.; Chluba, J.; DECARLI, ROBERTO; Walter, F.; Aravena, M.; et al.
Authors
10.3847/1538-4357/833/1/73
DOI
http://hdl.handle.net/20.500.12386/26267
Handle
THE ASTROPHYSICAL JOURNAL
Journal
833
THE ALMA SPECTROSCOPIC SURVEY IN THE HUBBLE ULTRA DEEP FIELD:
IMPLICATIONS FOR SPECTRAL LINE INTENSITY MAPPING AT MILLIMETER WAVELENGTHS
AND CMB SPECTRAL DISTORTIONS
C. L. Carilli1,2, J. Chluba3, R. Decarli4, F. Walter1,4, M. Aravena5, J. Wagg6, G. Popping7, P. Cortes8,9, J. Hodge10, A. Weiss11, F. Bertoldi12, and D. Riechers13
1
National Radio Astronomy Observatory, P.O. Box 0, Socorro, NM 87801, USA;[email protected] 2
Astrophysics Group, Cavendish Laboratory, JJ Thomson Avenue, Cambridge CB3 0HE, UK
3Jodrell Bank Centre for Astrophysics, University of Manchester, Oxford Road, M13 9PL, UK 4
Max-Planck Institute for Astronomy, D-69117 Heidelberg, Germany
5
Nucleo de Astronomia, Facultad de Ingenieria, Universidad Diego Portales, Av. Ejercito 441, Santiago, Chile
6
Square Kilometre Array Organisation, Lower Withington, Cheshire, UK
7
European Southern Observatory, Karl-Schwarzschild-Strasse 2, D-85748, Garching, Germany
8
Joint ALMA Observatory—ESO, Av. Alonso de Cordova, 3104, Santiago, Chile
9
National Radio Astronomy Observatory, 520 Edgemont Rd, Charlottesville, VA, 22903, USA
10
Leiden Observatory, Leiden University, Niels Bohrweg 2, NL2333 RA Leiden, The Netherlands
11
Max-Planck-Institut für Radioastronomie, Auf dem Hügel 69, D-53121 Bonn, Germany
12
Argelander Institute for Astronomy, University of Bonn, Auf dem Hügel 71, D-53121 Bonn, Germany
13
Cornell University, 220 Space Sciences Building, Ithaca, NY 14853, USA
Received 2016 May 6; revised 2016 August 9; accepted 2016 August 11; published 2016 December 8
ABSTRACT
We present direct estimates of the mean sky brightness temperature in observing bands around 99 and 242 GHz due to line emission from distant galaxies. These values are calculated from the summed line emission observed in a blind, deep survey for spectral line emission from high redshift galaxies using ALMA(the ALMA spectral deep field observations “ASPECS” survey). In the 99 GHz band, the mean brightness will be dominated by rotational transitions of CO from intermediate and high redshift galaxies. In the 242 GHz band, the emission could be a combination of higher order CO lines, and possibly[CII] 158 μm line emission from very high redshift galaxies
(z∼6–7). The mean line surface brightness is a quantity that is relevant to measurements of spectral distortions of the cosmic microwave background, and as a potential tool for studying large-scale structures in the early universe using intensity mapping. While the cosmic volume and the number of detections are admittedly small, this pilot survey provides a direct measure of the mean line surface brightness, independent of conversion factors, excitation, or other galaxy formation model assumptions. The mean surface brightness in the 99 GHZ band is: TB=0.94±0.09 μK. In the 242 GHz band, the mean brightness is: TB=0.55±0.033 μK. These should be interpreted as lower limits on the average sky signal, since we only include lines detected individually in the blind survey, while in a low resolution intensity mapping experiment, there will also be the summed contribution from lower luminosity galaxies that cannot be detected individually in the current blind survey.
Key words: cosmic background radiation– dark ages, reionization, first stars – galaxies: formation – molecular data– radio lines: general – techniques: imaging spectroscopy
1. INTRODUCTION
Intensity mapping of the cumulative CO and other millimeter and submillimeter line emission from early galaxies has been proposed as a new means to probe very large-scale structures in the distant universe(Carilli2011; Gong et al.2011,2012; Yue et al.2015). Intensity mapping entails low spatial and spectral
resolution imaging of the sky to obtain the mean brightness due to the cumulative emission from myriad discrete cosmic sources. While interferometric arrays like ALMA, the JVLA, and NOEMA, can detect CO and[CII] 158 μm (and in cases of
high luminosity sources, other lines), from individual galaxies at high redshift, the fields of view are very small, and the integration times are long. These telescopes are inadequate for measuring the galaxy distribution on the very large scales relevant to cosmological questions, such as the baryon acoustic oscillations at intermediate redshifts, or the large-scale distribution of galaxies that reionize the universe. The latter is of particular interest for cross correlation studies with very widefield, low-resolution HI21 cm images of the intergalactic medium during cosmic reionization(Lidz et al.2011).
The integrated millimeter and submillimieter line emission from early galaxies has also been recognized as a possible significant contaminant of measurements of the spectral and spatial fluctuations of the cosmic microwave background (CMB; Righi et al. 2008a, 2008b; Chluba & Sunyaev 2012; de Zotti et al. 2015; Mashian et al. 2016). For example,
modeling suggests(Mashian et al.2016) that the integrated CO
line emission could be significantly higher than the primordial spectral distortions due to other cosmological effects (e.g., Chluba & Sunyaev 2012; Sunyaev & Khatri 2013; Tashiro
2014), and may be measurable with next generation
instru-ments like the Primordial Inflation Explorer (PIXIE; Kogut et al.2014).14
Numerous calculations have been done to predict the mean sky brightness due to emission lines from CO at intermediate and high redshift, and [CII] 158 μm emission at very high
redshift(see Section2). These predictions are based on either
© 2016. The American Astronomical Society. All rights reserved.
14
PIXIE is a space observatory concept to map the CMB over the frequency range 30 GHz to 6THz, one goal of which is to constrain the average CMB energy spectrum with much greater accuracy than FIRAS.
empirical estimates using proxies for the line emission, such as the cosmic star formation rate density, or large scale cosmological simulations of galaxy formation, with recipes to relate proxy measurements or simulated properties to line luminosities.
In this paper, we present direct measurements of the summed line luminosity from individual sources in bands around 99 and 242 GHz. These measurements are based on the ALMA spectral deep field observations (ASPECS) program, corresponding to a broad band spectral line deep field of the UDF at 1.25 and 3 mm (Aravena et al. 2016a; Decarli et al.
2016a; Walter et al.2016). From these measurement, we derive
the mean brightness temperature at a given observing frequency due to high redshift galaxies. As a pilot study with ALMA, the fields are necessarily small, and the number of galaxies few. However, the measured quantity is direct: line emission from early galaxies. Hence, no modeling or conver-sion factors are required.
2. MODEL PREDICTIONS FOR THE LINE BRIGHTNESS The dominant contribution to the integrated line brightness from high redshift galaxies in the 99 GHz band is due to rotational transitions of CO from galaxies at intermediate to high redshift. Other molecular tracers, such as high dipole moment molecules like HCN and HCO+, are typically 10 times, or more, fainter than CO, while the atomicfine structure lines would be from galaxies at improbable redshifts (z∼20; see Carilli & Walter 2013). At 242 GHz, the integrated line
brightness will be some combination of higher order CO lines from intermediate and high redshift galaxies, plus a possible contribution from[CII] 158 μm line emission from galaxies at
z∼6 to 7, and other fine structure lines at lower redshift. We consider each in turn.
Considering CO in the 99 GHz band, predictions of the mean CO sky brightness from early galaxies have taken two approaches. First is an empirical use of the measured evolution of the cosmic star formation rate density, and/or the cosmic far-infrared (FIR) background, converted to CO luminosity by adopting a CO-to-FIR or star formation rate conversion factor (Righi et al. 2008a, 2008b; Lidz et al. 2011; de Zotti et al.
2015). A related calculation is to consider the star formation
rate density required to reionize the neutral intergalactic medium at high redshift, subsequently converted to CO luminosity using said conversion factors (Carilli 2011; Gong et al. 2011). While based on celestial measurements, these
methods involve significant uncertainties inherent in both the determination of the cosmic star formation rate density, and more importantly, the assumed “star formation law” relating CO luminosity to FIR luminosity, or to star formation rate (Kennicutt & Evans 2012; Carilli & Walter 2013). The latter
may entail a dual conversion of star formation rate to total gas mass, then total gas mass to CO luminosity. There is the additional uncertainty in the assumed gas excitation when modeling the contribution to the mean brightess at a given observing frequency from different CO transitions from galaxies at different redshifts.
The second method for predicting the mean CO sky brightness is through cosmological numerical simulations (Gong et al. 2011; Li et al.2016; Mashian et al. 2016). Such
simulations can be normalized to e.g., an observed galaxy luminosity function at a given redshift, although ultimately, even the most detailed simulations rely on recipes to convert
from simulated to observable quantities. This is particularly difficult in the case of tracer molecules, such as CO, while also including their excitation state.
In summary, the predictions at around 100 GHz for the mean brightness from CO lines from intermediate and high redshift galaxies range from 1.5μK (Righi et al.2008a,2008b) to about
10μK (Marshian et al.2016).
Two recent observations have set upper limits to the CO brightness from distant galaxies using CO intensity mapping. The first entailed a cross correlation of WMAP images with maps of very large-scale structures from the SDSS, namely the photometric quasar sample and the luminous red galaxy sample (Pullen et al. 2013). The cross correlation technique removes
numerous systematic errors. Pullen et al. estimate upper limits to the mean brightness temperature of CO 1-0 or 2-1 of about 10μK in the 30–90 GHz range. The second was an interfero-metric measurement of the brightness fluctuations at 30 GHz using the Sunyaev–Zel’dovich Array (Keating et al. 2015).
Keating et al. quote an upper limit to the CO 1-0 mean brightness of ∼5 μK from z∼3 galaxies. Since both these measurements rely on modeling of the spatial structure in the signal, they depend on the assumed underlying structural parameters.
Considering the 242 GHz band, predictions also vary considerably. The most detailed modeling to date, including analysis of lines from CO,[CII], and [CI], is presented in Yue
et al. (2015). They use large scale cosmological simulations,
plus physically motivated conversion factors (Pallottini et al.
2015; Vallini et al.2015), to derive the line luminosities from
early galaxies. They predict a [CII] 158 μm brightness of
∼0.05μK around 242 GHz from z∼6.5 galaxies. At this frequency, they obtain a similar contribution from the [CI]
lines at rest frame frequencies of 492 and 809 GHz, from lower redshift galaxies. The dominant line contribution to the mean brightness at 242 GHz in their models comes from CO emission from galaxies at intermediate to high redshift, for which they derive a mean brightness of∼0.45 μK. Note that, in their models, the [CII] contribution increases rapidly with
increasing observing frequency, to ∼0.4μK at 316 GHz (comparable to CO), due to galaxies at z∼5. Conversely, Gong et al. (2012) perform an analytic calculation of the
expected[CII] surface brightness based on interstellar medium
physics and halo statistics, and predict a substantially larger contribution of[CII] at 242 GHz of ∼0.3 μK.
3. ASPECS: A BLIND SEARCH FOR MILLIMETER LINE EMISSION FROM HIGH REDSHIFT GALAXIES The ASPECS results are described in Walter et al.(2016),
Aravena et al. (2016a), Decarli et al. (2016a). In brief, we
surveyed a ∼1 arcmin2 field in the UDF to a 3-σ depth of ∼0.05 Jy km s−1(assuming line widths of 200 km s−1) over the frequency range 84–115 GHz (3 mm), and of ∼0.13 Jy km s−1 over the frequency range 212–272 GHz. In the analysis below, we adopt the mean frequencies for each band, which are 99 and 242 GHz.
The observations are sensitive to galaxies over a wide range in redshift, depending on CO transition. The typical CO luminosity limits are∼2×10⁹K km s−1pc2at 3 mm and 6× 10⁸K km s−1pc2at 1 mm at 1<z<3. The implied gas mass limits will depend on which CO transition is being considered, at which redshift, and depend critically on assumed CO excitation, in particular for the high order transitions, since the
total gas mass is derived by extrapolation to low order. For reference, at the typical redshifts and transitions of the detected galaxies, these limits imply galaxies with gas masses of 3 to 10×109Me, for a Galactic conversion factor of CO 1-0 luminosity to total molecular gas mass. We discuss this point further in Section5.1. For[CII] at very high redshift (z∼6.5),
our observations are sensitive to galaxies with star formation rates 10Meyr−1, using the de Looze et al. (2011)
conversion.
Line emitting galaxies were identified using multiple three-dimenional search algorithms, and a series of tests were made for completeness andfidelity (Walter et al.2016). Once a line
candidate was identified, a search was made for an optical or near-IR(NIR) counterpart. Decarli et al. (2016a) discuss how a
given line is identified as a specific CO transition. In some cases, the detection (or the lack of detection) of multiple CO transitions over the broad frequency range constrains the redshift determination. If an optical/NIR counterpart is present, literature information on the redshift of the source (via spectroscopy or SEDfitting of the photometry) was also used. The lack of an optical counterpart is used to rule out low redshift interpretations in some cases. Ultimately, for some sources there can be ambiguity as to the transition in question, and therefore the redshift. This is dealt with via a bootstrapping approach(see Decarli et al.2016a). However, in the context of
the analysis below, this is not an issue, since we simply sum all the lines detected in the blind survey in a give observing band, independent of what transition and redshift the line happens to be.
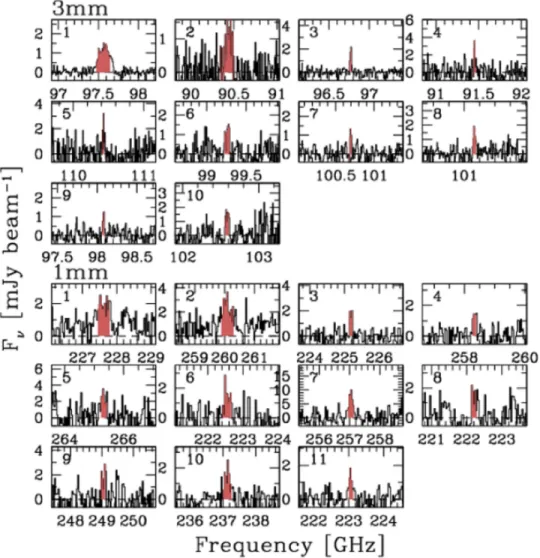
For completeness, Figure 1 shows a compilation of all the candidate line detections in the survey, as presented in Walter et al.(2016). There are a total of 21 candidate lines above 5σ.
In six cases, line identifications are unequivocally confirmed, through detection of other CO transitions, and/or an optical galaxy with a spectroscopic redshift. For the rest of the lines, extensive quantitative tests are made, and we only include lines with a >60% “fidelity” rating. See Decarli et al. (2016a) for
more details on the statistical analysis, and Walter et al.(2016)
for total intensity CO images, and optical images, of all the candidates. At thisfidelilty level, we expect to have roughly as many spurious detections as sources missing from the survey due to noise fluctuations (Decarli et al.2016a).
4. MEAN BRIGHTNESS TEMPERATURES The mean line brightness temperatures are calculated using an empirical approach of summing the lines detected in the blind survey. The process is simple. Table2 in Walter et al. (2016) lists the lines detected according to the blind search
criteria outlined in Section3. We sum the totalflux from all the lines detected in a given band, in Jy km s−1, which is equivalent dimensionally to Jy Hz or erg s−1cm−2. We then divide by the total bandwidth covered in the blind survey, which results in a meanflux density over the full band and over the fullfield, Sν, in Jy. The mean brightness temperature at the observed wavelength, λobs, is then derived using the angular area of the field employed in the blind search, Ωf, under the Rayleigh–Jeans appoximation: TB~1360Sn lobsW-f K
2 1 ,
where λobsis in centimeters andΩfis in arcsec2.
For the 99 GHz band, the totalflux for the 10 lines detected in the band is 2.53±0.25 Jy km s−1= (8.3±0.08)× 105Jy Hz. The total bandwidth is 31 GHz, so the meanflux density across the band isSn =(2.70.27)´10-5 Jy. Thefield covered by
the survey was 3600 arcsec2. Hence, the mean brightness temperature, TB=0.94±0.09 μK.
For the 242 GHz band, the totalflux for the 11 lines detected in the band is 6.93±0.42 Jy km s−1= (5.6±0.34) ×106
Jy Hz. The total bandwidth is 60 GHz, so the meanflux density across the band is Sn =(9.30.6)´10-5 Jy. The field covered by the survey was also 3600 arcsec2. Hence, the mean brightness temperature, TB=0.55±0.033 μK.
5. DISCUSSION 5.1. Limits
As a pilot ALMA study, we reemphasize that the volumes in question are small, as are the number of detections. Hence, our conclusions and uncertainties are dominated by cosmic variance and simple shot noise (Poisson statistics). Aravena et al. (2016b) consider the issue of cosmic variance in the
context of our particular field. Based on the drop-out galaxy counts, and the bright sub-mm source counts, this bias might be as large as a factor two(low). On the other hand, consideration of the contribution of faint sub-mm continuum sources to the cosmic IR background, based on our deeper ASPECS ALMA data, suggests a factor closer to unity(Aravena et al. 2016b).
Regardless, since this is a direct survey of the observable in question, namely, mean brightness due to line emission from distant galaxies at a given observing frequency, the results remain of interest in general progress toward millimeter line intensity mapping, and a factor two uncertainty is incon-sequential for our analysis in Section5.2.
Our measurements are also lower limits, since we only sum lines detected. We do not extrapolate to, e.g., lower or higher luminosity galaxies using an assumed luminosity function. Considering CO (the dominant contributor at 99 GHz, certainly, and likely at 242 as well), our detection threshold was set in order to reach what may be the“knee” in the CO luminosity function at the primary redshifts to which our survey is most sensitive(z∼1–3). This estimation was based on both numerical simulations and extrapolations of CO emission properties of high redshift galaxies from, e.g., measures of dust luminosities or star formation rates (see Decarli et al. 2016a for more details). If the CO luminosity function is relativelyflat at low luminosities, and steep at high luminosities, then galaxies around the knee of the curve dominate the overall luminosity. For example, using the Popping et al.(2016a) and Lagos et al. (2012) CO luminosity
functions and our limits at 99 GHz, we estimate that we should be detecting between 40% and 70% of the total CO luminosity (Decarli et al.2016a) in this dominant redshift range.
5.2. Comparison to Predictions and CMB Spectral Distortions As stated in Section 1, millimeter line intensity mapping experiments will have broad impact, from studies of galaxy formation to the baryon acoustic oscillations. In this section we consider in some detail our results in the context of one topical area that has seen considerable attention recently, namely, spectral distortions of the CMB.
In Section 2, we reviewed the predictions for the line brightness at 99 and 242 GHz based on phenomenological calculations using proxies for the line luminosity (such as the cosmic star formation density), or numerical simulations of galaxy formation. Predictions vary significantly, but range from ∼1μK to 10 μK, in the frequency ranges being considered. To
within the uncertainties inherent in small volume surveys, our direct measurements of TB=0.94 0.09 Km at 99 GHz and TB=0.55±0.033μK at 242 GHz, argue for the faint end of these predictions, although we again emphasize that these should be treated as lower limits.
How do our measurements then compare to, for instance, the expected distortions in the CMB spectrum due to early energy release, and to the expected sensitivity of planned CMB spectral distortion experiments? As a benchmark for exper-imental sensitivity, we adopt the current parameters being considered for PIXIE (Kogut et al. 2011, 2014), using the
15 GHz spectral resolution for the proposed experiment. Considering the expected sky brightness contributions, we focus on the more cosmologically relevant predictions, relating to recombination and reionization.
We note that there are other potentially significant fore-grounds, in particular, Galactic and extragalactic thermal emission from warm dust, and synchrotron emission. Kogut et al. (2014) review the relative magnitudes of these
contributions. The thermal emission from warm dust, in particular, is calculated to be an order of magnitude, or more, stronger than the summed millimeter line emission considered herein. However, the spectral behavior of the dust emission is considered to be well understood, and should be well modeled, and removed, using spectral fitting algorithms over a broad
frequency range. Herein, we focus on the millimeter and sub-millimeter line emission, given that this is our measured quantity, and compare it to the predicted cosmological signals. Additional discussion of foregrounds can be found in, e.g., de Zotti et al.(2015).
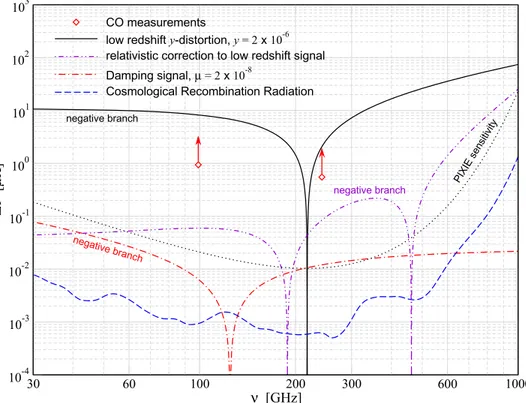
In Figure 2, we show a comparison of various distortion signals, along with the line limits derived herein. We focus on guaranteed distortions within ΛCDM (see Chluba 2016, for most recent overview), some of which should be detectable with future experiments, at least in terms of raw sensitivity (Kogut et al.2011). A wider range of energy release processes
(e.g., decaying particle scenarios) is discussed in Chluba (2013)
and Chluba & Jeong(2014).
The largest CMB expected spectral distortion is created at low redshift by the reionization and structure formation process (Sunyaev & Zeldovich1972; Hu et al.1994a). This signal is
close to a pure Compton-y distortion (Zeldovich & Sunyaev
1969) caused through partial up-scattering of CMB blackbody
photons by hot electrons yielding a y-parameter y;2×10⁻⁶ (e.g., Refregier et al.2000; Hill et al.2015). Contributions from
the hot gas(;1keV) residing in low mass halos also give rise to a noticeable relativistic temperature correction, which could be used to constrain the average temperature of baryons at low redshifts (Hill et al. 2015). While the relativistic correction
signal requires removal of the integrated CO emission, the
non-Figure 1. Montage of all the >5σ line candidates from the ASPECS blind survey (Walter et al.2016). The red areas show the spectral region over which the
signal-to-noise was calculated(see Decarli et al.2016a).
relativistic y-distortion contribution should be less affected and separable using multi-frequency capabilities of future experiments.
Another inevitable distortion is created by the dissipation of small-scale fluctuations in the primordial photon-baryon plasma (Sunyaev & Zeldovich 1970; Daly 1991; Hu et al.
1994b; Chluba et al.2012b) due to Silk damping. We illustrate
the μ-distortion (Sunyaev & Zeldovich 1970) contribution of
this signal using μ=2×10⁻⁸, which is close to the value expected for the ΛCDM cosmology (Chluba 2016). A
μ-distortion can only be created in dense and hot environments present in the early universe at z5×104 (Burigana et al. 1991; Hu & Silk 1993). By detecting this signal one
can probe the amplitude of perturbations at scales far smaller than those seen in the CMB anisotropies, delivering another independent way to test different inflation models (e.g., Chluba et al.2012a,2012b; Dent et al.2012; Clesse et al.2014).
Finally, we show the cosmological hydrogen and helium recombination radiation emitted at z;103 (Peebles 1968; Zeldovich et al. 1968; Dubrovich 1975; Kholupenko et al.
2005; Chluba & Sunyaev 2006; Rubiño-Martín et al. 2006),
which was computed using CosmoSpec (Chluba & Ali-Haïmoud 2016). This signal could provide an independent way to constrain cosmological parameters and directly map the recombination history (Sunyaev & Chluba 2009). It is
unpolarized and its unique spectral variability is very hard to mimic by other foregrounds or instrumental effects.15
The latter two effects cause fractional spectral distortions in the range of 10−9–10−8, implying observed brightness temperature perturbations DTB3 nK 30 nK– , well below the contribution of the mean line brightness measured herein. Thus, beyond doubt, extraction of these primordial distortions will be very challenging, requiring sophisticated foreground removal techniques, unprecedented control of systematics, broad spectral coverage, and high sensitivity multi-frequency capabilities. To successfully remove the integrated millimeter and submillimeter line emission, it will be advantageous to exploit the synergies between future CMB distortion measure-ments and observations similar to those presented here. Given the importance of the primordial distortion signals to studies of early-universe physics, this direction is highly relevant.
As ALMA attains full capability, spectral deep fields will become more efficient and effective, eventually encompassing areas of tens of square arcminutes. Our pilot studies have already shown the impact of such measurements over a broad range of problems in modern astrophysics and cosmology. In parallel, the Jansky Very Large Array is exploring similar deep spectral searches at 30 GHz (e.g., Lentati et al. 2015; D. Riechers et al. 2016, in preparation), while the advent of high frequency spectral cameras on the Green Bank Telescope provides a sensitive platform for wide field spectral searches (Sieth et al. 2016). In the long term, a “Next Generation Very Large Array,” operating between 20 and 115 GHz with octave, or broader, bandwidth receivers and 10 times the collecting area of ALMA and the JVLA, has the potential to revolutionize blind searches for molecular gas in the early universe(Carilli et al.2015; Casey et al.2015).
We thank the referee for useful comments that improved the paper. FW acknowledges support through ERC grant COSMIC–
Figure 2. Comparison of different CMB distortion signals (negative branches of the signals are marked) with the millimeter line limits reported in this paper. The low-redshift distortion created by reionization and structure formation is close to a y-distortion withy2´10-6. Contributions from the hot gas in low mass halos give
rise to a noticeable relativistic temperature correction. For the damping signal, we plot aμ-distortion with m = ´2 10-8. The cosmological recombination radiation
was computed usingCosmoSpec. The estimated effective sensitivity (D »In 5 Jy sr-1) of PIXIE is shown for comparison (dotted line).
15
The expected distortions due to annihilating dark matter (McDonald et al. 2001; Chluba2010; Chluba & Sunyaev2012; Chluba2013) and the
differences in the cooling of baryons relative to CMB photons during cosmic expansion(Chluba2005; Chluba & Sunyaev2012) were not illustrated here.
DAWN. MA acknowledges partial support from FONDECYT through grant 1140099. Support for RD was provided by the DFG priority program 1573 “The physics of the interstellar medium.” DR acknowledges support from the National Science Foundation under grant number AST-#1614213 to Cornell University. FB acknowledges support by the Collaborative Research Council 956, sub-project A1, funded by the Deutsche Forschungsgemeinschaft (DFG). This paper makes use of the following ALMA data: ADS/JAO.ALMA#2013.1.00146.S and ADS/JAO.ALMA#2013.1.00718.S. ALMA is a partner-ship of ESO(representing its member states), NSF (USA), and NINS (Japan), together with NRC (Canada), NSC and ASIAA (Taiwan), and KASI (Republic of Korea), in cooperation with the Republic of Chile. The Joint ALMA Observatory is operated by ESO, AUI/NRAO, and NAOJ. The National Radio Astronomy Observatory is a facility of the National Science Foundation operated under cooperative agreement by Associated Universities, Inc.
REFERENCES
Aravena, M., Decarli, R., Walter, F., et al. 2016a,ApJ, 833, 68(Paper II) Aravena, M., Decarli, R., Walter, F., et al. 2016b,ApJ, 833, 71(Paper V) Burigana, C., Danese, L., & de Zotti, G. 1991, A&A,246, 49
Carilli, C. 2011,ApJL,730, L30
Carilli, C. L., McKinnon, M., Ott, J., et al. 2015, arXiv:1510.06438
Carilli, C. L., & Walter, F. 2013,ARA&A,51, 105
Casey, C., Hodge, J., Lacy, M., et al. 2015, arXiv:1510.06411
Chluba, J. 2005, PhD thesis, Ludwig Maximilians Univ. Chluba, J. 2010,MNRAS,402, 1195
Chluba, J. 2013,MNRAS,436, 2232
Chluba, J. 2016,MNRAS,460, 227
Chluba, J., Erickcek, A. L., & Ben-Dayan, I. 2012a,ApJ,758, 76
Chluba, J., & Jeong, D. 2014,MNRAS,438, 2065
Chluba, J., Khatri, R., & Sunyaev, R. 2012b,MNRAS,425, 1129
Chluba, J., & Sunyaev, R. 2012,MNRAS,419, 1294
Clesse, S., Garbrecht, B., & Zhu, Y. 2014,JCAP,10, 046
Daly, R. A. 1991,ApJ,371, 14
de Looze, I., Baes, M., Bendo, G., Cortese, L., & Fritz, J. 2011, MNRAS,
416, 2712
de Zotti, G., Negrello, M., Castex, G., Lapi, A., & Bonato, M. 2015, arXiv:1512.04816
Decarli, R., Walter, F., Aravena, M., et al. 2016a,ApJ, 833, 69(Paper III) Dent, J. B., Easson, D. A., & Tashiro, H. 2012,PhRvD,86, 023514
Dubrovich, V. K. 1975, SvAL,1, 196
Gong, Y., Cooray, A., Silva, M. B., et al. 2011,ApJL,728, L46
Gong, Y., Cooray, A., Silva, M. B., et al. 2012,ApJ,745, 49
Hill, J. C., Battaglia, N., Chluba, J., et al. 2015,PhRvL,115, 261301
Hu, W., Scott, D., & Silk, J. 1994a,ApJL,430, L5
Hu, W., Scott, D., & Silk, J. 1994b,PhRvD,49, 648
Hu, W., & Silk, J. 1993,PhRvD,48, 485
Keating, G., Bower, G., Marrone, D., et al. 2015,ApJ,814, 140
Kennicutt, R., & Evans, N. 2012,ARA&A,50, 531
Kholupenko, E. E., Ivanchik, A. V., & Varshalovich, D. A. 2005, GrCo,
11, 161
Kogut, A., Chuss, D., Dotson, J., et al. 2014, SPIE, 9143, ID91431E Kogut, A., Fixsen, D. J., Chuss, D., et al. 2011,JCAP,7, 25
Lagos, C., Bayet, E., Baugh, C., et al. 2012,MNRAS,426, 2142
Lentati, L., Wagg, J., Carilli, C., et al. 2015,ApJ,800, 67
Li, T. Y., Wechsler, R., Devaraj, K., & Church, S. 2016,ApJ,817, 169
Lidz, A., Furlanetto, S., Oh, S.-P., et al. 2011,ApJ,741, 70
Mashian, N., Loeb, A., & Sternberg, A. 2016,MNRAS,458, L99
McDonald, P., Scherrer, R. J., & Walker, T. P. 2001,PhRvD,63, 023001
Pallottini, A., Ferrara, A., Pacucci, F., et al. 2015,MNRAS,453, 2465
Peebles, P. J. E. 1968,ApJ,153, 1
Popping, G., van Kampen, E., Decarli, R., et al. 2016,MNRAS,461, 93
Pullen, A., Chang, Z., Dore, O., & Lidz, A. 2013,ApJ,768, 15
Refregier, A., Komatsu, E., Spergel, D. N., & Pen, U.-L. 2000,PhRvD,61, 123001
Righi, M., Hernández-Monteagudo, C., & Sunyaev, R. A. 2008a, A&A,
478, 685
Righi, M., Hernandez-Monteagudo, C., & Sunyaev, R. A. 2008b, A&A,
498, 489
Rubiño-Martín, J. A., Chluba, J., & Sunyaev, R. A. 2006,MNRAS,371, 1939
Sunyaev, R. A., & Chluba, J. 2009,AN,330, 657
Sunyaev, R. A., & Khatri, R. 2013,IJMPD,22, 1330014
Sunyaev, R. A., & Zeldovich, Y. B. 1970,Ap&SS,7, 20
Sunyaev, R. A., & Zeldovich, Y. B. 1972, A&A,20, 189
Tashiro, H. 2014,PTEP, 2014, 06B107
Vallini, L., Gallerini, S., Ferrara, A., et al. 2015,ApJ,813, 36
Walter, F., Decarli, R., Aravena, M., et al. 2016,ApJ, 833, 67(Paper I) Yue, B., Ferrara, A., Pallottini, A., Gallerani, S., & Vallini, L. 2015,MNRAS,
450, 3829
Zeldovich, Y. B., Kurt, V. G., & Sunyaev, R. A. 1968, ZhETF,55, 278
Zeldovich, Y. B., & Sunyaev, R. A. 1969,Ap&SS,4, 301