UNIVERSITA’ DEGLI STUDI DI VERONA
DIPARTIMENTO DI
Neuroscienze, Biomedicina e Movimento
SCUOLA DI DOTTORATO DI
Scienze della Vita e della Salute
DOTTORATO DI RICERCA IN
Neuroscienze, Scienze Psicologiche e Psichiatriche
CICLO XXX /ANNO 2014
TITOLO DELLA TESI DI DOTTORATO
Bioenergetics, Training and Performance in Distance Running
S.S.D. M-EDF/02
Coordinatore: Prof. Leonardo Chelazzi
Firma __________________________
Tutor: Prof. Federico Schena
Firma __________________________
Dottorando: Dott. Luca Festa
Quest’opera è stata rilasciata con licenza Creative Commons Attribuzione – non commerciale
Non opere derivate 3.0 Italia . Per leggere una copia della licenza visita il sito web: http://creativecommons.org/licenses/by-nc-nd/3.0/it/
Attribuzione Devi riconoscere una menzione di paternità adeguata, fornire un link alla licenza e indicare se sono state effettuate delle modifiche. Puoi fare ciò in qualsiasi maniera ragionevole possibile, ma non con modalità tali da suggerire che il licenziante avalli te o il tuo utilizzo del materiale.
NonCommerciale Non puoi usare il materiale per scopi commerciali.
Non opere derivate —Se remixi, trasformi il materiale o ti basi su di esso, non puoi distribuire il materiale così modificato
Index
List of abbreviations ...5 Overview ...7 Chapter 1...9 Introduction ... 9 Chapter 2... 11The Determinants of Endurance Performance ... 11
Chapter 3... 15
Maximum Oxygen Uptake (V’O2max) ... 15
Training strategies to improve V’O2max ... 23
Chapter 4... 26
Running Economy ... 26
Training strategies to improve running economy ... 32
Chapter 5... 45
Percentage of Maximum Oxygen Uptake ... 45
Training strategies to improve percentage of V’O2max ... 49
Chapter 6... 51
Experimental purpose ... 51
Chapter 7... 54
Effects of flywheel strength training on the running economy of recreational endurance runners ... 54
Chapter 8... 69
Effects of a Focused Training Model on Recreational Runners ... 69
Chapter 9... 80
Discussion ... 80
Chapter 10 ... 83
List of abbreviations
V’O2max = maximum oxygen uptake RE = running economy
FM = full marathon HM = half marathon
V’O2 = oxygen consumption % V’O2max = percentage of V’O2max vV’O2max= velocity at V’O2max O2 = oxygen
COPD = chronic obstructive pulmonary disease Q’ = cardiac output
SDH = succinate dehydrogenase SV = stroke volume
EMG =
GRF = ground reaction force HIT = high intensity training SSC = stretch shortening cycle NO3- = nitrate
NO2- = nitrite
LT = lactate threshold CP = critical power
% V’O2max = percentage of V’O2max 1RM = 1 repetition maximum FST = flywheel strength training LIT = low intensity training VT = ventilatory threshold vVT1 = velocity at VT1 vVT2 = velocity at VT2 RV = reference velocity TRIMP = training impulse
TID = training intensity distribution MLSS = maximal lactate steady state
RCT = rate of compensation POL = polarized
FOC = focused
SD = standard deviation
PET = polarized endurance training FET = focalized endurance training RPE = rate perceived effort
ATP = adenosine triphosphate ADP= adenosine biphosphate
Overview
Recreational athletes represent the largest proportion of participants in several endurance sport events such as marathons, cycling races, triathlons and cross-country ski marathons; and their number continues to grow year after year. However, running seems to be the most suitable activity for people of any age, sex, experience and technical ability; it does not require too much time, equipment or a particular environment. Most of these athletes approach the practice of running just for health maintenance and then transforming this practice into a challenge with themselves. At that point they begin to train for the improvement of performance, often improvising their training programs.
Studies on running have dealt with the determinants of performance and training strategies to improve the performance of elite and well-trained athletes; but there is still little knowledge about the performance and training of recreational athletes. If determining factors are the same for any level of performance, the training strategies usually used by elite and well-trained athletes are not suitable for recreational athletes because they require a lot of time, structures and technical skills that they do not have.
The aim of this project was to define optimal training strategies for recreational runners to:
1) improve running economy (RE), the most important determinant in long distance running performance;
2) optimize the training time/performance ratio (time dedicated to practice is a limitation for recreational athletes);
Chapter 1
Introduction
Over the past decades, a steady increase in the number of participants in long distance running events such as full marathons (FM) and half marathons (HM) has been reported both in the USA and Europe (www.runningusa.org/statistics; www.maximaratona.it). In the United States, there were 30,400 running events in 2016, from 5Km runs to ultramarathons; 17,000,000 crossed the finish line. Five-point-three percent of the population participated in races. In Italy, the number of participants in marathons has doubled in the last ten years with a positive year-by-year trend, whereas in Germany the number of full marathoners steadily increased up to 2006 with a slow decline thereafter (www.marathonbestenliste.de). In recent years, half-marathon (HF) running enjoyed greater popularity than full marathon (FM) running according to participation trends of long-distance runners in the USA (www.runningusa.org/statistics). A continuous increase in the number of half marathoners since 1990 has been recorded in the USA. The highest number was reached in 2011 with a total of 1,600,000 starters corresponding to an increase of 16.2% in runners compared to the previous years. This increase was less than the historic ones -24% in both 2008 and 2009 - but still higher than in 2010 with an increase of 6.4%. In the past years, the number of full marathoners in the USA increased only slightly, in contrast with the rising numbers of half marathoners. When there was an increase of 9.9% and 8.9% in 2009 and 2010, respectively, the number of full marathoners only rose by 2.2% from 2010 to 2011. In Switzerland, the number of half marathon runners increased remarkably from 12,497 in 2000 to 48,061 in 2014. No similar data are available to date for half marathoners in Italy. These increased levels of participation have led to an increased range of abilities in participating runners, from amateur to elite levels (Ogueta-Alday and García-López, 2016). Consequently, the interest of the scientific community in studying different factors that affect performance (i.e., anthropometry, training methods, physiology and biomechanic components) has grown (Ogueta-Alday and García-López, 2016).
marathons - the one in New York City. In 2011, more than one third of the full marathoners in the USA were older than 40 years; in half marathons this age group rose to 40% (www.runningusa.org/statistics). The increase in full and half marathoners in the USA is most probably due to an higher number of runners older than 40 years and an increase in female runners (www.runningusa.org/statistics). Similarly, in Germany, the number of male and female full marathoners in age group 50-59 years was almost 10% higher than in age group 20-29 years. In 2016, about 75% of men and 67.5% of women marathoners in Italy were over 40 years of age, and 73% of total FM runners were 40-60 years old. This analysis showed that running is very popular among middle-aged people. It is well known that aerobic activity is one of the most important prevention tools for the most common diseases (obesity, hypertension, cardiovascular disease and metabolic problems). Aerobic activity has shown great potential in terms of health, psychological and sociological aspects and consequently of one’s quality of life (Lee et al., 2014)
The definition of an adequate and optimal preparation for an endurance event in recreational runners is therefore crucial and realized not yet. It must tent to avoid sport failure and injuries, requiring a time commitment that allows people to train and compete regularly, following a detailed and structured training program compatible with their numerous job and family commitments belonging to a non-professional athlete.
Several studies on training strategies for long distance running have been done on elite or well-trained athletes. These strategies avoid errors or a waste of time in training programs if a trainer understands the specific importance of different performance determinants in a recreational athlete. Specific research in this area allows trainers to focus on their strategies to maximize improvement and reduce the number of unsatisfied athlete drop-outs.
An in-depth analysis of the physiological and functional determinants of endurance performance and the studies on their improvement strategies (training) has been carried out.
Chapter 2
The Determinants of Endurance Performance
In exercise, performance can be evaluated by the amount of time required to complete a given amount of work (power) or by the length of time that a given work rate can be maintained (capacity). The relationship between work load and work capacity is affected, however, by a complicated interaction of several factors, internal as well as external, which must be taken into consideration.
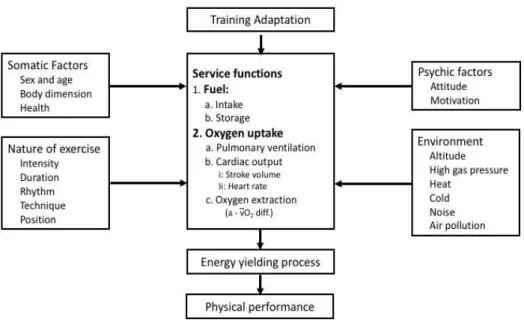
Figure 1 - Factors affecting physical performance. From Textbook of Work Physiology, Astrand
The ability to perform physical work basically depends on the capacity of the muscle cells to transform the chemically bound energy of food to mechanical energy for muscular work, that is, into the energy-yielding processes in muscle cells. This in turn depends on the capacity of the service functions that deliver fuel and oxygen to the working muscle fiber; for instance, it depends on nutritional properties, nature and quality of food ingested, frequency of meals, oxygen uptake including pulmonary ventilation, cardiac output and oxygen extraction, and the
nervous and hormonal mechanisms that regulate these functions. Many of these functions depend on somatic factors, which may be partially genetically endowed such as sex, age, and body dimensions. In addition, we should remember the role of psychological factors such as motivation, attitude toward work, and the will to mobilize one’s resources in order to accomplish the task requirement. As shown in Figure 1, physical performance may also, directly or indirectly, be greatly influenced by factors in the external environment such as pollution, cold and heat, as well as by the type of work.
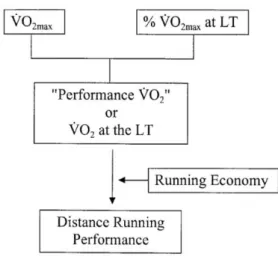
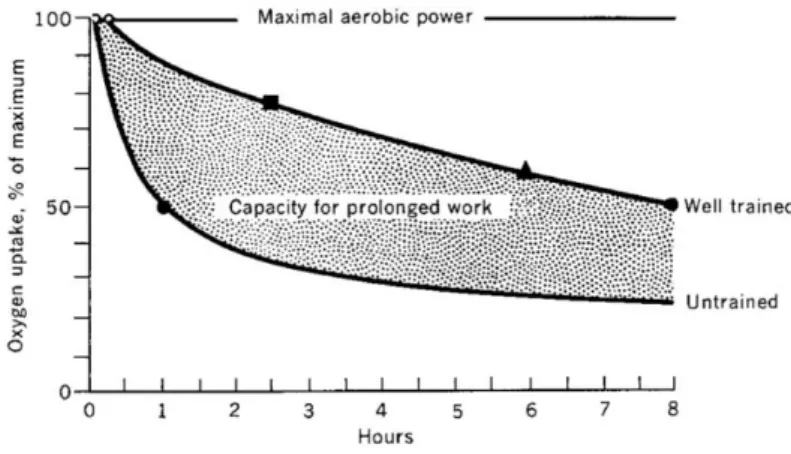
Focusing our attention on running bioenergetics, in order to maintain a specific work rate or running velocity over a long distance, ATP must be supplied to the cross bridge as fast as it is used. In other words, we can say that the rate at which oxygen is used during prolonged submaximal exercise is a measure of the rate at which ATP is generated. Over the years, a lot of criticism has been directed at this physiological model, but in light of several studies, the model has been confirmed as being able to explain endurance performance (Bassett & Howley, 1997). Figure 2 shows that oxygen consumption (V’O2) maintained during an endurance run, called “performance V’O2” by Coyle (Coyle, 1995), is equal to the product of the runner’s V’O2max and the percentage of V’O2max that can be maintained during the run.
Figure 2 - Simplified diagram of the linkage between maximal aerobic power (V˙O2max), the percentage of
maximal aerobic power (% V˙O2max) and running economy as they relate to distance running performance.
From Basset DR et al 2000
The percentage of V’O2max is related to the V’O2 measured at the lactate threshold (LT), so in endurance events, metabolic performance is closely linked to the V’O2 at LT. V’O2max is limited primarily by cardiovascular factors (central), whereas the percentage of V’O2max that can be maintained is linked primarily to adaptations in muscles (peripheral) resulting from prolonged training (Holloszy & Coyle, 1984). The actual running speed obtained by the rate of oxidative ATP generation (V’O2 performance) is determined by the individual’s ability to convert energy (e.g., running economy) into performance (Coyle, 1995; Daniels, 1985). One of the best descriptions of how V’O2max and running economy interact to affect running velocity was provided by Daniels (J. T. Daniels, 1985) in his description of “velocity at V’O2max” (vV’O2max).
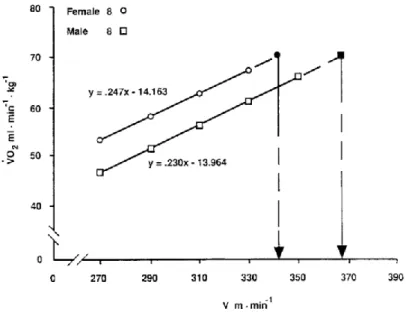
Figure 3 - Comparison of male and female runners of equal V’O2max. The males are significantly favored in
economy and vV’O2max (P < 0.05).
Figure 3 shows the relationship between V’O2 and running velocity for male and female runners - equal in terms of V’O2max, but different in terms of running economy (J. Daniels & Daniels, 1992). A line was drawn through the series of points used to construct an economy-of-running line, and was extrapolated to the subject’s V’O2max. A perpendicular line was then drawn from the V’O2max value to the x-axis to estimate the velocity that that subject would have achieved at V’O2max (vV’O2max). This is an estimation of the maximal speed that can be maintained by oxidative phosphorylation. In this example, the difference in running economy
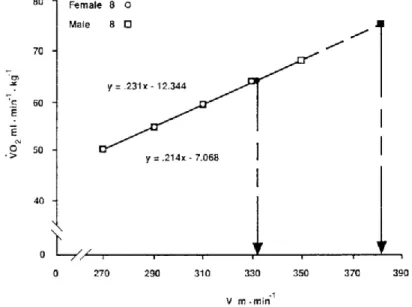
produced a clear difference in the speed that could be achieved if that race were run at V’O2max. In like manner, Figure 4 shows the impact of different V’O2max in vV’O2max in groups with similar running economy values. The 14% difference in V’O2max resulted in a 14% difference in the vV’O2max. Consequently, it is clear that V’O2max and running economy interact to set the upper limit of running speed that can be maintained by oxidative phosphorylation. However, if the distance races are not run at vV’O2max, the ability of the athlete to run at a high percentage of V’O2max has a significant impact on running performance (Costill, Thomason, & Roberts, 1973).
Figure 4 - Comparison of male and female runners of equal V’O2max. The males are significantly favored in
Chapter 3
Maximum Oxygen Uptake (V’O2max)
Maximum oxygen uptake (V’O2max) is defined as the highest rate at which oxygen can be taken and utilized by the body during strenuous exercise. It is one of the main variables in the field of exercise physiology, and it is frequently used to indicate the cardiorespiratory fitness of an athlete.
As previously shown in endurance running, performance is positively correlated with maximal oxygen consumption (V’O2max)(Costill, Branam, Eddy, & Sparks, 1971). Costill et al.’s data were presented to show an inverse correlation (r 0.91) between V’O2max and time in a 10-mile run. These investigators used subjects with a wide range of V’O2max values (54.8 to 81.6 mL kg-1 min-1) to study this relationship. This was an appropriate research design to see whether a correlation existed between these two variables in that such a relationship must be evaluated over an appropriate range of values. When the range of V’O2max is narrow, as in highly trained athletes, the correlation between V’O2max and performance is not as satisfactory as one would like it to be. Indeed, Conley and Krahenbuehl (D L Conley & Krahenbuhl, 1980) found only a poor correlation (r = -0.12) between V’O2max and running time in a group of 12 first-class 10Km runners. This state of affairs can be easily understood by considering, for small intersubject differences in V’O2max, other factors like running economy, or the fraction of V’O2max exploited throughout the race, which may become crucial (D L Conley & Krahenbuhl, 1980; Costill et al., 1971, 1973; Maughan & Leiper, 1983). V’O2max is directly linked to the rate of ATP generated and maintained during a distance race, even though distance races are not run at 100% V’O2max. The rate of ATP generation depends on the V’O2 (mL kg-1 min-1) that can be maintained during the run, which is determined by the subject’s V’O2max and the percentage of V’O2max at which the subject can perform (Fig. 10). For example, to complete a 2h and 15’ marathon, a V’O2max of about 60 mL kg-1 min-1 must be maintained throughout the race. Consequently, in a theoretical marathon run at 100% V’O2max, the runner would need a V’O2max of 60 mL kg-1 min-1. However, a marathon is typically run at about 80–85% of V’O2max - the V’O2max values needed for that performance; in this case that would be 70.5–75
mL kg-1 min-1. This way V’O2max sets the upper limit for energy production in endurance events but does not determine final performance. As claimed by Bassett et al. (Bassett & Howley, 1997), there is no question that runners vary in running economy (RE) as well as in the percentage of V’O2max maintained in a run; both have a dramatic impact on the speed that can be maintained in an endurance race.
The O2 pathway from the atmosphere to the mitochondria contains a series of steps, each of which could represent a potential impediment to O2 delivery:
1) pulmonary diffusing capacity; 2) maximal cardiac output;
3) oxygen carrying capacity of the blood; 4) skeletal muscle characteristics.
The first three factors can be classified as “central” factors; the fourth is termed a “peripheral” factor.
The pulmonary system
Modern researchers have verified that the pulmonary system may limit V’O2max in certain circumstances. Dempsey et al. (Dempsey, Hanson, & Henderson, 1984), for example, showed that elite athletes are more likely to undergo arterial O2 desaturation during maximal work compared with normal individuals. Trained individuals have a much higher maximal cardiac output than untrained individuals (40 vs 25 L min-1). This leads to a decreased transit time of the red blood cells in the pulmonary capillary. Consequently, there may not be enough time to saturate the blood with O2 before it exits the pulmonary capillary. This pulmonary limitation in highly trained athletes can be overcome with O2-enriched air. Powers et al. (Powers, Lawler, Dempsey, Dodd, & Landry, 1989) performed two V’O2max tests (Fig. 5) on highly and normally trained subjects. In one case the subjects breathed room air and in the second they breathed a 26% O2 gas mixture. With hyperoxic gas, the highly trained group had an increase in V’O2max from 70.1 to 74.7 mL kg-1 min-1 and an increase in arterial O2
saturation (SaO2) from 90.6% to 95.9% during maximal work.
Figure 5 - Effects of hyperoxia on maximum oxygen uptake (V ̇ O2max) in normal and highly trained individuals. The highly trained subjects had an increase in V ̇ O2max when breathing oxygen-enriched air, showing the presence of a pulmonary limitation in these subjects under normoxic conditions. From Powers, S. K., J. Lawler, J. A. Dempsey, S. Dodd, and G. Landry. Effects of incomplete pulmonary gas exchange on V ̇O2max.
None of these changes were observed in normal subjects (V’O2max 56.5 mL kg-1 min-1). Pulmonary limitations are evident in people who exercise at moderately high altitudes (3,000–5,000 m) (J. Daniels & Oldridge, 1970; Faulkner, A, & Kollias, 1968). Individuals with asthma and other types of chronic obstructive pulmonary disease (COPD) suffer from a similar problem (a reduction in arterial PO2). Under these conditions, the ability to exercise can be increased with supplemental O2, which increases the “driving force” for O2 diffusion into the bloodstream (Davidson, Leach, George, & Geddes, 1988; Rooyackers, Dekhuijzen, Van Herwaarden, & Folgering, 1997). The ability to increase exercise capacity in this manner shows the presence of a pulmonary limitation.
Hill et al. (Hill & Lupton, 1923) suggested that maximal cardiac output was the primary factor that explains individual differences in V’O2max. This was a major insight given the state of knowledge in 1923. Einthoven had only discovered electrocardiography a decade earlier. Hill used this new technique to measure maximal heart rates of around 180 beats min-1. However, it was not until around 1930 that trained subjects were shown to have a lower heart rate at a fixed, submaximal work rate, providing evidence of increased stroke volumes. Other
methods of cardiac imaging for endurance athletes (x-rays and ultrasound) were not available until 1940–1950. Given the level of technology in 1923, it is incredible that Hill et al. (Hill & Lupton, 1923) were able to deduce that endurance athletes have hearts with superior pumping capacities. In 1915, Lindhard measured the 20 l/min of average cardiac output in subjects during exercise and demonstrated the strong, linear relationship between cardiac output and V’O2. Hill and Lupton (Hill & Lupton, 1923) speculated that maximal cardiac output values of 30-40 L min-1 were possible in trained athletes. These speculations were based on knowledge of Fick’s equation and assumed values for V’O2max, arterial oxygen content, and mixed venous oxygen content. Today, we know that the normal range of V’O2max values (L min-1) observed in sedentary and trained men and women of the same age is principally due to variation in maximal stroke volume, given that a considerably less variation exists in maximal HR and systemic oxygen extraction. During maximum exercise, almost all of the available oxygen is extracted from blood that perfuses the active muscles. The oxygen content of arterial blood is approximately 200 mL O2 L-1; in venous blood draining maximally working muscles, it falls to about 20–30 mL O2 L-1. This shows that there is low oxygen concentration in blood that has not yet been extracted from the circulatory system during heavy exercise. Hence, the dominant mechanism to increase V’O2max with training must be an increase in blood flow (and O2 delivery). It is estimated that 70–85% of the limitation of V’O2max is linked to maximal cardiac output (Cerretelli & Di Prampero, 1971). Longitudinal studies have shown that a training-induced increase in V’O2max results primarily from an increase in maximal cardiac output rather than from a broadening of the systemic a-v O2 difference (Fig. 6).
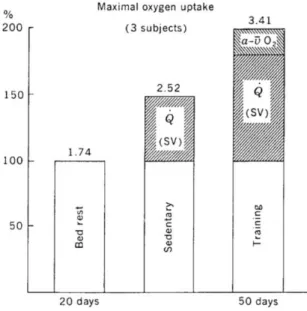
Saltin et al. (B Saltin et al., 1968) examined V’O2max in sedentary individuals after 20 days of bed rest and after 50 days of training. The difference in V’O2max between the deconditioned and trained states resulted mostly from a difference in cardiac output. In a similar study, Ekblom et al. found that 16 weeks of physical training increased V’O2max from 3.15 to 3.68 L min-1. This improvement in V’O2max
showed an 8.0% increase in cardiac output (from 22.4 to 24.2 L min-1) and a 3.6% increase in a-v O2 difference (from 138 to 143 mL L-1).
Figure 6 - Summary of changes that occur in maximum oxygen up-take (V ̇O2max) following bed rest and physical training. The higher V ̇ O2max under sedentary conditions compared with that under bed rest results from an increased maximal cardiac output. The further increase after training results from an increase in cardiac output and, to a lesser extent, an increase in the a-v O2 difference. From Åstrand, P.-O. and K. Rodahl. Textbook of Work Physiology. New York: McGraw-Hill, 1970. Used with permission. Data from reference 71. Saltin, B., B. Blomquist, J. H. Mitchell, R. L. Johnson, K. Wildenthal, and C. B. Chapman. Response to submaximal and maximal exercise after bed rest and after training.
One way to greatly decrease cardiac output is with beta-blockade. Tesch (Tesch, 1985) wrote an authoritative review of 24 studies detailing the cardiovascular responses to beta blockade. Beta-blockers can decrease maximal heart rate (HR) by 25–30%. In these studies, maximal cardiac output decreased by 15–20%, while stroke volume increased slightly. The reduced cardiac output was partially compensated by an increased a-v O2 difference, with consequent V’O2max declining by 5–15%. Tesch (Tesch, 1985) concluded that the decline in V’O2max seen with cardio-selective beta-blockade was caused by diminished blood flow and oxygen delivery.
Another method of altering O2 transport to working muscles is by changing the hemoglobin (Hb) content of the blood (Ekblom, 1976). Blood doping is the practice of artificially increasing a person’s volume of total red blood cells through removal, storage, and subsequent reinfusion. Gledhill (Gledhill, 1982, 1985) completed
comprehensive reviews of 15–20 studies that examined the effects of blood doping. Reinfusion of 900–1,350 mL blood elevates the oxygen carrying capacity of the blood. This procedure has shown a 4–9% increase in V’O2max in well designed, double-blind studies (Gledhill, 1982, 1985). No improvement was observed in sham-treated individuals infused with a small volume of saline solution (Buick, Gledhill, Froese, Spriet, & Meyers, 1980). Once again, these studies provide evidence of a cause-and-effect link between O2 delivery and V’O2max. The evidence that V’O2max is limited by cardiac output, the oxygen carrying capacity, and in some cases by the pulmonary system is undeniable. This statement pertains to healthy subjects performing whole-body, dynamic exercise.
Honig et al. (Honig, Connett, & Gayeski, 1992) presented evidence of a peripheral O2 diffusion limitation in red canine muscle. According to their experiments and a mathematical model, the principal site of resistance to O2 diffusion occurs between the surface of red blood cells and the sarcolemma. They reported a large drop in PO2 over this short distance. Honig et al. (Honig et al., 1992) concluded that O2 delivery per se is not the limiting factor. They found that a low cell PO2 relative to blood PO2 is needed to maintain the driving force for diffusion and thus to enhance O2 conductance.
The experimental model of Honig et al. (Honig et al., 1992) is quite different from human exercise. Simply increasing blood flow into an isolated muscle is not sufficient to cause an increase in V’O2. The isolated muscle must also undergo contractions so that the mitochondria consume O2 (drawing down the intracellular PO2). Without a peripheral diffusion gradient, oxygen uptake will not increase. Their overall conclusion was that V’O2max is a distributed property, dependent on the interaction of O2 transport and mitochondrial O2 uptake (Honig et al., 1992). However, this model did not determine which of these two factors limits V’O2max in the intact human performing maximal exertion.
The mitochondria in muscle fibers are the sites where O2 is consumed in the final step of the electron transport chain. In theory, doubling the number of mitochondria should double the number of sites for O2 uptake in muscle. However, human studies show that there is only a modest increase in V’O2max (20–40%) despite a 2.2-fold
increase in mitochondrial enzymes (Bengt Saltin, Henriksson, Nygaard, Andersen, & Jansson, 1977). This is consistent with the view that V’O2max, measured during whole-body dynamic exercise, is limited by oxygen delivery (not muscle mitochondria). Holloszy and Coyle (Holloszy & Coyle, 1984) suggested that, as a consequence of the increase in size and number of the mitochondria content of skeletal muscle, exercise at the same work rate elicits smaller disturbances in homeostasis in trained muscles. Two metabolic effects of an increase in mitochondrial enzymes are i) muscles adapted to endurance exercise will oxidize fat at a higher rate (thus sparing muscle glycogen and blood glucose), and ii) there is less lactate produced during exercise. These muscle adaptations are important to explain the improvement in endurance performance that occurs with training. The main effect of increased mitochondrial enzymes is improved endurance performance rather than increased V’O2max. Holloszy and Coyle (Holloszy, 1973; Holloszy & Coyle, 1984) noted that even in individuals with nearly identical V’O2max values, there can be a two-fold range in mitochondrial enzymes. Furthermore, low-intensity training may elicit small changes in mitochondrial enzymes without any changes in V’O2max, and vice versa (Henriksson & Reitman, 1977; Klausen, Andersen, & Pelle, 1981; Orlander, Kiessling, Karlsson, & Ekblom, 1977). On the other hand, there is some evidence that the increase in mitochondria density plays a permissive role in allowing V’O2max to increase. Holloszy and Coyle (Holloszy & Coyle, 1984) noted that the lowest value for succinate dehydrogenase (SDH) activity in elite runners studied by Costill (Costill, Fink, & Pollock, 1976) was still 2.5-fold greater than that found for untrained individuals in the same study. The increase in muscle mitochondria content (number, size and enzymes) may allow a slightly greater extraction of O2 from the blood in working muscles, thus contributing in a minor way to higher V’O2max (Holloszy & Coyle, 1984).
In 1977 Andersen and Henriksson (Andersen & Henriksson, 1977) showed that capillary density increases with training. Other studies reported a strong relationship between the number of capillaries per fiber in the vastus lateralis and V’O2max (mL kg-1 min-1) measured during a cycle ergometery test (Bengt Saltin et al., 1977). The main significance of increased capillary density induced by training is not to accommodate blood flow but rather to maintain or extend the mean transit
time (B Saltin, 1985). This enhances oxygen delivery by maintaining oxygen extraction (a-v O2 difference) even at high rates of muscle blood flow. The ability of skeletal muscle to adapt to training in this way is far greater than observed in the lung (Dempsey, 1986).
Longitudinal changes in V’O2max in well-trained runners, reported in the literature, have mostly been small or no change occurred at all (Berg, Latin, & Hendricks, 1995; Ekblom, 1968; A. M. Jones, 1998; D. E. Martin, Vroon, May, & Pilbeam, 1986). No significant changes in V’O2max occurred in three well-trained runners during 5 years of training, or in seven university track and cross-country runners during 1 year of training (Berg et al., 1995) . Experimentally, it is difficult to ascertain whether a runner has reached his or her trainable limit for V’O2max enhancement. Laursen and Jenkins (Paul B Laursen & Jenkins, 2002b) suggested that all cardiorespiratory adaptations that could be elicited by submaximal training have probably already occurred in distance runners competing at a relatively high level. It is possible that sufficient volumes of high intensity training are not included in the training programs of many well-trained runners in order for them to reach their trainable limit for V’O2max enhancement. Basset et al. (Basset, Chouinard, & Boulay, 2003) reported that the well-trained long-distance runners used in their study invariably trained at running speeds below vV’O2max (the minimal running velocity that elicits V’O2max during incremental running to volitional exhaustion) (V. Billat, Renoux, Pinoteau, Petit, & Koralsztein, 1994). Robinson et al. (Robinson, Robinson, Hume, & Hopkins, 1991) reported that 17 nationally ranked distance runners performed <4% of high-intensity interval training during their training sessions, with one-third doing no interval training. Average training intensity was 64% V’O2max. A retrospective study by Hewson and Hopkins (Hewson & Hopkins, 1995) found that most of the 123 distance-running coaches surveyed favored long slow-distance training, with limited time allocated to either ‘hard’ continuous training or high-intensity interval training. Favoring training duration over intensity is also reflected in the long weekly training distances reported for well-trained distance runners (V. Billat, Demarle, Paiva, & Koralsztein, 2002; V. L. Billat, Demarle, Slawinski, Paiva, & Koralsztein, 2001; Boileau, Mayhew, Riner, & Lussier, 1982). Studies reporting changes in the V’O2max of elite
and well-trained runners in response to high-intensity training (Table I) suggest that the V’O2max values of these runners had not reached a plateau and were responsive to high-intensity training, even during relatively short training periods. However, valid inferences cannot be made from these studies due to several methodological limitations. Only one of these studies reported statistically significant increases in V’O2max (V. Billat et al., 2002). Other studies demonstrated meaningful but statistically insignificant increases in V’O2max of 2–5% (V. L. Billat, Flechet, Petit, Muriaux, & Koralsztein, 1999; Laffite, Mille-Hamard, Koralsztein, & Billat, 2003; Mikesell & Dudley, 1984; T. Smith, Coombes, & Geraghty, 2003). The small sample sizes used in these studies and the associated statistical power of <30% (Power and Precision, Biostat, NJ, USA) in all but one of these studies was probably a major cause of the statistical insignificance (Cohen, 1992). Several studies (V. L. Billat et al., 1999; Laffite et al., 2003; T. Smith et al., 2003; T. P. Smith, McNaughton, & Marshall, 1999a) reported changes in relative V’O2max but did not report whether any changes in body mass occurred. It is therefore not possible to quantify how much of the increase in relative V’O2max was due to changes in cardiorespiratory fitness or how much was due to any changes in body mass.
Training strategies to improve V’O2max
Characterizing the physiological response to increased exercise intensity and how this response may elicit physiological adaptations that are associated with the enhancement of V’O2max may provide a physiological rationale for recommending a particular training intensity to enhance the V’O2max in distance runners.
Training-induced increases in cardiac output (Q’max) are due to increased maximal stroke volume (SVmax), because maximal heart rate either decreases or remains the same (B Saltin et al., 1968). The main stimulus for myocardium morphological adaptation associated with SVmax enhancement is mechanical overload imposed by a volume overload-induced increase in ventricular diastolic stretch and increased
resistance to ventricular emptying due to greater afterload (Clausen, 1977; Cooper, 1997). Neuroendocrine factors such as thyroxine, testosterone, angiotensin II, and catecholamines stimulate myocardial growth (Cooper, 1997; George, Wolfe, & Burggraf, 1991). Threshold intensities exist for the release of these hormones, and once surpassed, their rate of release increases curvilinearly with the increasing intensity of exercise (Hartley et al., 1972; Kotchen et al., 1971). Although training intensities above the anaerobic threshold appear obligatory to benefit from their potentiating effects, exercise intensity and duration interactions relating to hormone release and effects on physiological myocardial hypertrophy require further empirical research. Several study demonstated the effect of high intensity training on SVmax and accordingly VO2max in a period of 5 to 12 weeks in both untrained and active people(T. A. Astorino et al., 2017; Todd A Astorino et al., 2018; Bacon, Carter, Ogle, & Joyner, 2013; Daussin et al., 2007).
Plasma volume, erythrocyte mass and blood volume increase in response to endurance training (B Saltin et al., 1968; D. E. R. Warburton et al., 2004). Sawka et al. (Sawka, Convertino, Eichner, Schnieder, & Young, 2000), following a review of 18 studies, underscored that plasma volume expansion plateaus increased after approximately 15 days of training and that total erythrocyte mass increased after approximately 30 days. Consequently, under normal physiological conditions, significant changes in blood volume occur only in poorly conditioned individuals, with little change in the already well-trained (Oscai, Williams, & Hertig, 1968). Even if a particular training strategy could increase blood volume in trained runners, it is unlikely to enhance SVmax to any significant extent. The SVmax of nine elite cyclists increased very little in response to an experimental 547mL increase in blood volume (D. E. R. Warburton et al., 2004), probably because trained endurance athletes are at or near their diastolic reserve capacity (Hopper, Coggan, & Coyle, 1988; D. E. Warburton, Gledhill, Jamnik, Krip, & Card, 1999).
Skeletal muscle capillarization increases in response to endurance training (Andersen & Henriksson, 1977; Ingjer, 1979) and has been considered a major physiological adaptation in the enhancement of V’O2max (B Saltin & Rowell, 1980). The main stimulus for inducing capillarization is increased shear stress, and
capillary pressure results from a critical increase in blood flow velocity (Hudlicka, Brown, & Egginton, 1992). Since cardiac output and blood flow increase with increasing exercise intensity up to V’O2max, there should be an intensity-dependent increase in capillary shear stress and stimulus for capillarization up to V’O2max. Physiological structures or processes that demonstrate substantial long-term plasticity should be the target of training-induced adaptations for the longitudinal enhancement of a distance runner’s V’O2max. Myocardial morphological adaptations that increase SVmax would appear most important. Other important adaptations include increased capillarization of skeletal muscle and increased oxidative capacity of type II skeletal muscle fibers. The strength of the stimuli that elicit adaptations is exercise intensity dependent up to V’O2max, indicating that training at or near V’O2max may be the most effective intensity to enhance V’O2max in well- trained distance runners. However, Moffatt et al. suggested that as V’O2max is approached, the differentiation between stimuli decreases. (Moffatt, Stamford, Weltman, & Cuddihee, 1977).
Research is therefore needed to understand the chronic adaptive effects elicited by different training intensities in the range of 90–100% V’O2max. Furthermore, the effects of such intensities on recreational athletes remain to be verified.
Highlights
• V’O2max is defined as the highest rate at wich oxygen can be taken and utilized by the
body during strenuous exercise
• V’O2max is positively correlated with endurance running performance
• V’O2max is affected by central (Pulmunary Diffusing Capacity, Maximal cardiac output
and oxygen delivering), and peripheral ( skeletal muscle caratheristics and functionality) factor
• The individual differences between trained/untrained subject and man/woman with same
age, is principally due to variation in cardiac output
• To improve, V’O2max in well-trained and SV in recreational athletes, the most effective
Chapter 4
Running Economy
Efficient utilization of available energy facilitates optimum performance in any endurance running event. Efficiency refers to the ratio of work done to energy expended (J. T. Daniels, 1985). RE is energy expenditure expressed as the submaximal V’O2max at a given running speed (Anderson, 1996; D L Conley & Krahenbuhl, 1980; Morgan & Craib, 1992). The energy cost of running reflects the sum of both aerobic and anaerobic metabolism, and the aerobic demand (measured by the V’O2 in L/min) at a given speed does not necessarily account for the total energy cost of running, which is measured in joules or kilojoules of work done (J. T. Daniels, 1985). Runners with good RE use less oxygen than runners with poor RE at the same steady-rate speed, and RE can vary among runners with a similar V’O2max by as much as 30% (J. T. Daniels, 1985). Data from Conley and Krahenbuhl (D L Conley & Krahenbuhl, 1980) were used to show a relatively strong correlation (r 0.82) between running economy and performance in a 10K run in a group of runners with similar V’O2max but with a range of 10-km times of 30.5– 33.5 min. When they reduced the evaluation to the four fastest runners (10 km in 30.5–31 min), there was considerable variability in the economy of running (45–49 mL kg-1 min-1 at 268 m min-1), which suggests a lack of association between the variables. As mentioned for V’O2max, this is an expected result. A correlation coefficient will approach zero as the range of values for one of the variables (in this case, performance times ranging from 30.5 to 31 min) approaches zero. There is little point in looking at a correlation unless the range of values is sufficient to determine whether a relationship exists. There is a linear relationship between submaximal running velocity and V’O (mL kg-1 min-1) for everyone. However, there is considerable variation among individuals regarding how much oxygen it takes to run at a given speed, that is, running economy.
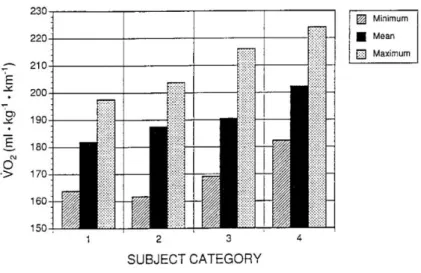
Figure 5 shows a bar graph of the variation in running economy (expressed in mL kg-1 min-1) measured at different relative speed among trained and untrained subject stratified by performance capability (Morgan et al., 1995a). The group of elite runners had better running economy than the other groups of runners, and all running groups were better than the group of untrained subjects. However, one of
the most revealing aspects of this study was the within-group variation; there was a 20% difference between the least and most economical runner in any group (Morgan et al., 1995a).
Figure 5 – Minimum, mean, and maximum aerobic demand running economy values for elite runners (Category 1), subelite runners (Category 2), good runners (Category 3), and untrained subjects (Category 4).
From Morgan, D.W., D.R. Bransford, D.L. Costill, 1995
In support of this data, the study of Daniels et al. showed that RE can vary among runners with similar V’O2max by as much as 30% (J. T. Daniels, 1985). In elite or near-elite runners with a similar V’O2max, RE is a better predictor of performance than V’O2max (Costill et al., 1973; Morgan, Baldini, Martin, & Kohrt, 1989). Weston compared the RE and performance of Kenyan and Caucasian distance runners. Despite their 13% lower V’O2max, Kenyans had similar 10K race times compared with Caucasians thanks to their 5% better RE. The Kenyan runners also completed the 10K race at a higher percentage of their V’O2max but with similar blood lactate concentration levels compared with Caucasian runners. In their study, Tam et al. (Tam et al., 2012) found that top-level Kalenjin marathon runners were characterized by high, but not very high, V’O2max (64.9 ± 5.8 vs. 63.9 ± 3.7 ml kg-1 min-1) compared with Europeans, an extremely high fraction of V’O2max (0.825 ± 0.050 in KA and 0.836 ± 0.062 in Europeans) and a low cost of running (Cr) (3.64 ± 0.28 vs. 3.63 ± 0.31 J kg-1 m-1). However, the dominance of Kenyan marathon runners over Caucasians cannot be explained by differences in the energetics of running since the small functional differences highlighted in this study do not fully justify the differences in performance.
Despite this controversial result, it follows that substantial improvements in RE could facilitate improved performance in elite distance runners.
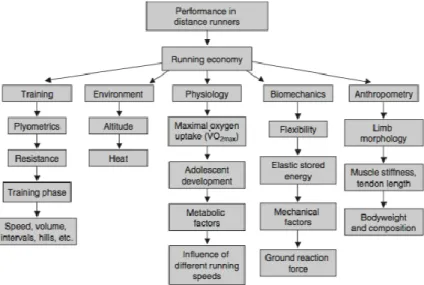
In summary, the relationship between RE and performance is well documented, with many independent reports demonstrating a strong relationship between RE and distance running performance (D L Conley & Krahenbuhl, 1980; Costill et al., 1973; P E Di Prampero et al., 1993). RE is likely to be influenced by several factors (training, altitude, heat) (Fig. 6) that can reduce the oxygen cost over a range of running speeds and conceivably lead to enhanced performance.
Figure 6 - Factors affecting running economy from Saunders P.U., Pyne D.B. Telford R.D. and Hawley J.A. Factors Affecting Running Economy in Trained Distance Runners, Sport Med. 2004; 34 (7); 465-485
Running involves the conversion of muscular forces translocated through complex movement patterns that utilize all the major muscle joints in the body. High performance running relies on skill and precise timing in which all movements have purpose and function (Anderson, 1996). An intuitive link exists between running technique and economy, since performing mechanical patterns with non-productive movements and applying forces of appropriate magnitude in the right directions with precise timing will result in less energy consumption at a given running speed (Anderson, 1996). In this regard several investigators attempted to explain the inter-individual variations in RE through differences among runners in the biomechanical patterns of their running style. The first descriptor of running style that was related to the energy requirement of running was stride length. Several studies (P R
Cavanagh & Williams, 1982; Hogberg, 1952; Minetti, Ardigò, & Saibene, 1994; Powers, Hopkins, & Ragsdale, n.d.) showed that runners self-select the optimal stride length for a given speed, and RE tends to increase curvilinearly as stride length changes (lengthened or shortened). Cavanagh (P R Cavanagh & Williams, 1982) reported that there is little need to dictate stride length for well-trained athletes since they already tend to display near optimal stride lengths. He suggested two mechanisms to explain this phenomenon. Firstly, runners naturally acquire an optimal stride length and stride rate over time based on perceived exertion. Secondly, runners may adapt physiologically through repeated training at a particular stride length/stride frequency combination for a given running speed (P R Cavanagh & Williams, 1982).
Several other discrete kinematic variables have been related to running economy. An early study by Cavanagh (Peter R. Cavanagh, Pollock, & Landa, 1977) indicated that economic elite runners had less vertical oscillation and were more symmetrical compared to less economic athletes. In a study carried out on elite male distance runners, Williams (Williams & Cavanagh, 1987) compared 3 groups of runners divided according to their RE at 3.6 m·s-1
(low, medium and high VO2) and found that better RE was associated with a higher shank angle with the vertical at the foot strike, less plantarflexion at toe-off and more flexed knee in the mid-support. Less amplitude of arm movements was also associated with better economy (Anderson, 1996; Williams & Cavanagh, 1987). A more recent research study (KYR??L??INEN, BELLI, & KOMI, 2001) related RE to several three-dimensional kinematic and kinetic parameters and EMG activity at different speeds. None of the considered kinematical indices (angular displacements between the ankle, knee and hip joints, joint angular velocities) was, taken alone, a good predictor of RE. Although significant differences and trends have been observed between economic and non-economic runners in some kinematical parameters, the relationships appear weak and inconsistent among studies. This is due to the complex interrelationships among the multitude of discrete mechanical descriptors of running technique that globally influence RE as also demostrated by Lussiana et al. (Lussiana et al., 2017) that found that different running patterns were associated with similar RE. Therefore, definitive conclusions cannot be confirmed on the basis
of present data, and further studies using proper statistical analyses to deal with multiple variables are necessary.
Numerous studies have related descriptors of ground reaction forces (GRF) to RE. Williams (Williams & Cavanagh, 1987) found that more economical runners showed significantly lower first peaks in the vertical component of the GRF and tended to have smaller horizontal and vertical peak forces. Based on these results, they suggested that differences in kinematics, especially before the foot strike, may affect muscular demand and thus RE. Heise (Heise & Martin, 2001) investigated the support requirements during foot contact of trained male runners. Higher total and net vertical impulses were shown in the less economical athletes, indicating wasteful vertical motion. The combined influence of vertical GRF and the time course of the force application explained 38% of the inter-individual variability in RE. However, other GRF characteristics like medial-lateral or horizontal moments were not significantly correlated with RE. Kyrolainen (KYR??L??INEN et al., 2001) found that the rate of force production increased with increasing running speed and that the horizontal (braking) component of the GRF was related to RE. They suggested that increasing the pre-landing and braking activity of the leg hamstring muscles might prevent unnecessary yielding of the runner during the braking phase, with an enhancement of muscular-tendon stiffness, and a resulting improvement in RE. In summary, relationships between RE and GRF characteristics have been repeatedly shown, although the inherent mechanisms need to be more clearly understood. Insights to analyzing the inter-individual variations in RE in competitive athletes come from the field of comparative biology. Kram (Kram & Taylor, 1990) investigated the aerobic demand of locomotion in several animal species. He presented an inverse relationship between RE and contact time, indicating that the energy cost of running is determined by the cost of supporting the animal’s mass and time course of generating force (Kram & Taylor, 1990). Subsequent studies confirmed that the requirement to support body mass, expressed by vertical GRF, is the major metabolic cost of running (Chang & Kram, 1999; Farley & McMahon, 1992). However, experiments applying impending and assisting horizontal forces demonstrated that also the horizontal component of GRF significantly affects the metabolic cost of running (Chang & Kram, 1999; Cooke,
McDonagh, Nevill, & Davies, 1991). Finally, recent studies carried out on running animals and humans have clearly shown that the muscular force required to swing the limb also contributes to a significant amount of energy expenditure (Modica & Kram, 2005).
Anthropometric characteristics such as limb dimensions and proportions have been addressed as potential influences on RE. Assuming that leg length contributes to angular inertia and to the metabolic cost of moving the legs during running (Anderson, 1996), it should be an important factor in determining RE. However, Williams (Williams & Cavanagh, 1987) found no differences in leg length between economic and non-economic male distance runners. As for kinematic parameters, it is quite unlikely that a single anthropometric index may discriminate among different levels of RE, since RE is complexly affected by a multitude of interacting factors, and the effect of a single factor may be hidden by the others.
In contrast, there is some evidence that leg mass and leg mass distribution may influence RE. In studies where leg angular inertia was altered when weights were added to the extremities, it was demonstrated that increasing shoe weight by only 50 g increased RE by ∼1% (B. H. Jones, Knapik, Daniels, & Toner, 1986; P. E. Martin, 1985). Myers (Myers & Steudel, 1985) studied 4 athletes trained to run with additional weight on their trunks, upper thighs, upper shanks, and ankles. All limb loadings resulted in greater cost of running than when the same masses were attached to the waist, with cost increasing as the position of loads became more distal. Another study involving ankle and wrist loading revealed that RE was lowest in the unloaded condition, followed by ankle loading only, wrist loading only, and both wrist and angle loading. This research stream led to a claim that for a given body mass and a given speed, smaller and more proximally distributed limb mass results in lower kinetic energy required to accelerate and decelerate the limbs and thus a lower cost of running.
Several studies contend that flexibility affects RE (Craib et al., 1996; Gleim, Stachenfeld, & Nicholas, 1990; Godges, Macrae, Longdon, Tinberg, & Macrae, 1989). Godges (Godges et al., 1989) showed in college student athletes that RE improved with better hip flexion and extension. This finding reflected the empirical
belief that improved flexibility is desirable to increase RE and may be explained by an enhanced neuromuscular balance due to greater flexibility, which elicits lower V’O2. Contrarily, Gleim (Gleim et al., 1990) found that untrained subjects with the lowest flexibility were the most economical. This was explained by inflexibility in the transverse and frontal planes of the trunk and hip regions of the body that stabilizes the pelvis at foot strike. This may have the effect of reducing both an excessive range of motion and metabolically expensive stabilizing muscular activity. Craib et al. (Craib et al., 1996) examined the relationship between RE and selected trunk and lower limb flexibility in tests on trained male distance runners. Inflexibility in the hip and calf was associated with better RE by minimizing the need for muscle-stabilizing activity and increasing the storage of elastic energy. Another study (A M Jones, 2002) found that lower limb and trunk flexibility was negatively related to RE in elite male distance runners. The author interpreted his results stating that improved RE may reflect greater stability of the pelvis, reduced requirement for additional muscular activity at foot strike, and greater storage and return of elastic energy due to inflexibility of the lower body. Kyrolainen (KYR??L??INEN et al., 2001) found that stiffer muscles around the ankle and knee joints in the braking phase of running increased force expression in the push-off phase. Therefore, stiffer and more inflexible muscles in the legs and lower trunk could enhance RE via increased energy from elastic storage and return. According to a review by Saunders (Philo U. Saunders, Pyne, Telford, & Hawley, 2004), the findings of these studies taken together suggest that there is an optimal level of flexibility whereby RE can benefit, although a certain degree of muscle stiffness is also required to maximize elastic energy storage and return in the trunk and legs.
Training strategies to improve running economy
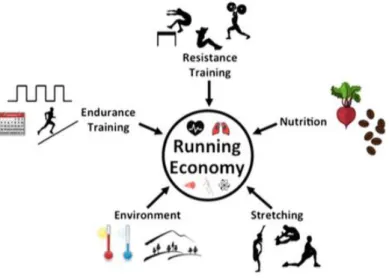
To date, a wide range of acute and chronic interventions have been investigated with respect to improving economy, including various forms of resistance training, endurance training and high-intensity interval training (HIT), altitude exposure, stretching, as well as nutritional supplements (Fig. 7).
Figure 7 - Diagram of strategies to improve running economy from K.R. Barnes K.R., Kilding A. E; Strategies to Improve Running Economy, Sports Medicine, 2014
Various physiological responses occur during endurance training in runners, and it is likely that the characteristics of training influence RE. Endurance training leads to increases in the morphology and functionality of skeletal muscle mitochondria (Holloszy, Rennie, Hickson, Conlee, & Hagberg, 1977; Philo U. Saunders et al., 2004). Specifically, an increase in the oxidative muscle capacity allows trained runners to use less oxygen per mitochondrial respiratory chain during submaximal running (Assumpção, Lima, Oliveira, Greco, & Denadai, 2013). Furthermore, adaptations such as improved skeletal muscle buffer capacity (Gore et al., 2001) and hematological changes (Burtscher, Nachbauer, Baumgartl, & Philadelphy, 1996; Levine & Stray-Gundersen, 1997) (i.e., increased red cell mass) have been observed following various training modalities. These adaptations could also invoke improvements in oxygen delivery and utilization that could improve an athlete’s RE. While training has been suggested to elicit a range of central and peripheral adaptations that improve the metabolic and cardiorespiratory efficiency of a runner (Green, 2000), many of these adaptations are largely governed by the training load, which can be manipulated for a given athlete by increasing the volume or intensity of running over time. Successful endurance runners typically undergo several years of training to enhance the physiological characteristics important to determining success in distance running events. Indeed, the number of years of running experience and high training volumes have been suggested as being
important to RE (Morgan et al., 1995b; R. C. Nelson & Gregor, 1976). Unfortunately, the few longitudinal studies that have examined this issue have yielded little consensus, with findings indicating no change (J. T. Daniels, Yarbrough, & Foster, 1978; Wilcox & Bulbulian, 1984), a slight increase, and varying degrees of reductions (1–15 %) in submaximal V’O2 among trained and untrained runners engaging in different combinations of years, distance, interval and uphill training (Balsom, Seger, Sjödin, & Ekblom, 1992; Douglas L. Conley, Krahenbuhl, & Burkett, 1981; Svedenhag & Sjödin, 1984). Midgley et al. (Midgley, McNaughton, & Jones, 2007) suggested that the most important factor in improving RE may be the cumulative distance a runner has run over years of training and not short-term (several weeks to months) bouts of high training volume per se. This may be due to continued long-term adaptations in metabolic, biomechanical and neuro-muscular efficiency (Midgley et al., 2007; R. C. Nelson & Gregor, 1976). Case study data from world-class runners also suggests that RE improves over several years of training (Douglas L Conley, Krahenbuhl, Burkett, & Millar, 1984; Ingham, Fudge, & Pringle, 2012; A. M. Jones, 1998; Andrew M. Jones, 2009); however, the role played by the interaction between training volume and consistency of training in such improvements over several years of training remains unclear.
The influence of training volume on RE is not well discussed in the literature, and unfortunately, no training studies to date have examined the implications of increased training volume while controlling for potential confounding variables like training intensity. However, in a cross-sectional investigation, Pate et al. (Pate, Macera, Bailey, Bartoli, & Powell, 1992) reported that training volume was not associated with better RE. Nevertheless, the importance of training volume should not be downplayed, as high-volume training plays a major role in inducing adaptations important to successful distance running (P. B. Laursen, 2010). Studies that incorporated flat overground HIT into the training programs of distance runners reported equivocal results in relation to improved RE. Jones and Carter (Andrew M. Jones & Carter, 2000) suggested that runners are typically more economical at the running speeds at which they habitually train. HIT at 93–120%
velocity at V’O2max (vVO2max) and continuous running at velocity at the onset of blood lactate accumulation (vOBLA) ] have both been shown to improve RE by 1– 7% (Kyle R Barnes, Hopkins, McGuigan, & Kilding, 2013; V. L. Billat et al., 1999; Franch, Madsen, Djurhuus, & Pedersen, 1998; Laffite et al., 2003; Sjödin, Jacobs, & Svedenhag, 1982). Other studies using similar training intensities reported no significant improvement (Kyle R Barnes et al., 2013; Franch et al., 1998; T. P. Smith, McNaughton, & Marshall, 1999b; Yoshida et al., 1990). Morgan et al. (Morgan, Martin, & Krahenbuhl, 1989) suggested that the type of training exerts a negligible effect on improved RE, based on the observation that several studies reported no differences in changes in RE despite the fact that runners engaged in different interval training programs. Franch et al. (Franch et al., 1998) compared interval training at 94, 106 and 132% vV’O2max and found that RE significantly improved in the 94% and 106% groups, but not in the group that trained at 132% vV’O2max. This suggests that very high-intensity running is not effective in improving RE, possibly because of a loss of running form at very high running speeds, or of an inability to complete a sufficient training volume to elicit a training effect (Midgley et al., 2007). Biomechanical changes could improve exercise efficiency following HIT. However, Lake and Cavanagh (Lake & Cavanagh, 1996) investigated the effects of 6 weeks of HIT on various biomechanical variables in a group of 15 males moderately trained runners ( and found no relationship between changes in performance, vV’O2max, RE and biomechanical variables at 3.36ms-1 on a treadmill. The authors concluded that improvements in performance following HIT were more likely to be due to physiological rather than biomechanical factors because there were no changes in biomechanical descriptors of running style that signaled changes in running economy.
Also, uphill running represents a frequently prescribed form of HIT in periodized training programs for distance runners. Moreover, references to its potential effectiveness as a movement-specific form of resistance training have appeared in several reviews (L. V Billat, 2001; Midgley et al., 2007; Philo U. Saunders et al., 2004). However, there are only anecdotal reports on and limited research investigations into the physiological responses to and potential improvements in performance with such training (Kyle R Barnes et al., 2013; Vukovich, 2013).
Unlike other modes of resistance training, where a transfer of learning would need to occur to improve RE, uphill running is movement specific and the mechanisms for improving RE are likely to directly affect one or more of the metabolic, biomechanical and neuromuscular systems.
Various forms of resistance training can be adopted, and several have been shown to improve RE in recreational (Taipale et al., 2010; Taipale, Mikkola, Vesterinen, Nummela, & Häkkinen, 2013), moderately trained (Albracht & Arampatzis, 2013; K. Barnes, 2014; Berryman, Maurel, & Bosquet, 2010; Guglielmo, Greco, & Denadai, 2009; Piacentini et al., 2013a; Støren, Helgerud, Støa, Hoff, 2008), and highly trained runners (Millet, Jaouen, Borrani, Candau, 2002; Sedano, Marín, Cuadrado, Redondo, 2013). Resistance training may improve RE through several mechanisms. Kyrolainen et al. (KYR??L??INEN et al., 2001) proposed that resistance training may improve RE through improved lower limb coordination and co-activation of muscles, thereby increasing leg stiffness and decreasing stance phase contact times, allowing a faster transition from the braking to the propulsive phase through elastic recoil (Cheng et al., 2012; Häkkinen et al., 2003; KYR??L??INEN et al., 2001; L. Paavolainen, Hakkinen, Hamalainen, Nummela, & Rusko, 2003; L. Paavolainen, Häkkinen, Hämäläinen, Nummela, & Rusko, 1999; Sale, 1988). Heavy resistance training may primarily cause hypertrophy of type IIA and IIB (fast twitch) fibers, but also type I (slow twitch) fibers (Staron et al., 1991, 1994), resulting in less motor unit activation to produce a given force (Moritani & deVries, 1979). Unfortunately, increases in body mass are an undesirable side effect to increases in muscle strength from resistance training that could be counter-productive to distance running performance. However, increased muscular strength might primarily come from neural adaptations without observable muscle hypertrophy since most studies have reported little or no changes in body mass, fat free mass, percentage body fat or girth measurements following heavy resistance training. Sale (Sale, 1988) reports that heavy resistance training induces changes in the nervous system which allow an athlete to increase activation of the working muscles, thus producing a greater net force with each stride. An increase in strength following heavy resistance training as a result of increased motor unit recruitment and motor unit synchronization may improve mechanical efficiency and motor
recruitment patterns (Kraemer, Fleck, & Evans, 1996; Sale, 1988). Greater muscular strength following heavy or strength-endurance resistance training has previously been shown to delay muscular fatigue, resulting in a smaller increase in oxygen consumption (decreased RE) at any given speed during sustained endurance exercise (Hayes, French, & Thomas, 2011). It is well documented that initial performance gains following heavy resistance training are a result of neuromuscular adaptations rather than within-muscle adaptations (e.g., hypertrophy) (Kraemer et al., 1996; Sale, 1988). Several studies (Guglielmo et al., 2009; Millet et al., 2002; STØREN et al., 2008; Taipale et al., 2010) have reported concomitant improvements in RE and maximal strength following heavy resistance training, indicating positive neuromuscular adaptations. Other studies (Kyle R. Barnes, Hopkins, Mcguigan, Northuis, & Kilding, 2013; Berryman et al., 2010; Cheng et al., 2012; Piacentini et al., 2013b; Sedano et al., 2013) have demonstrated that the combination of strength-endurance resistance training and endurance training improves running performance and enhances RE in moderately and highly trained runners. Regardless of whether strength gains occur at the muscular level, neural level, or both, available evidence suggests that if a more efficient recruitment pattern is induced, decreases in oxygen consumption at a given speed are likely to occur (Bransford & Howley, 1977; Morgan et al., 1995a); however, more research is necessary to support these assertions.
Improved RE may also be due to increases in strength that cause positive changes in mechanical aspects of running style (i.e., improved biomechanical efficiency) (E. Johnson, Quinn, Kertzer, & B. Vroman, 1997), thus allowing a runner to do less work at a given running speed. A number of biomechanical variables have been identified that relate to RE, thereby providing support for the hypothesis that the mechanical aspects of running style do have an influence on RE (Anderson, 1996). Another possible explanation for improved RE following heavy resistance training could involve muscle fiber-type conversion from less efficient fast twitch fibers (type IIB) to more efficient oxidative fibers (type IIA and type I), though existing data in athletes is conflicting (EDWARD F Coyle, Hemmert, & Coggan, 1986; Staron et al., 1990, 1991, 1994). For example, Staron et al. (Staron et al., 1990, 1991, 1994) found concomitant decreases in submaximal V’O2 and in type IIB
fibers, with a simultaneous increase in type IIA fibers following a heavy-resistance, low-velocity, lower body resistance training program in untrained men and women. Conversely, Coyle et al. (EDWARD F Coyle et al., 1986) reported that V’O2 remained unchanged for the same absolute submaximal intensity throughout a detraining period, despite a large shift from type IIA to IIB fibers when studying seven endurance-trained subjects 12, 21, 56 and 84 days after cessation of training, which suggested that muscle fiber conversion has little or no impact on RE. The concept of movement specificity suggests that the type of resistance training used by runners should closely simulate the movement that will be performed during training and competition (Jung, 2003). Plyometric and explosive resistance training are specific forms of strength training that aim to enhance the ability of muscles to generate power by exaggerating the stretch shortening cycle (SSC), using explosive exercises such as jumping, hopping and bounding (Turner, AM, Owings, M and Schwane, 2003). Plyometric training has the potential to increase the stiffness of the muscle-tendon system, which allows the body to store and utilize elastic energy more efficiently, resulting in decreased ground contact time and reduced energy expenditure (Anderson, 1996; P R Cavanagh & Kram, 1985; Mikkola et al., 2011; Spurrs, Murphy, & Watsford, 2003). Paavolainen et al. (L. Paavolainen, Häkkinen, et al., 1999) reported that 9 weeks of explosive resistance training improved 5K run performance (mean 3.1%) and RE (mean 8.1%) with no changes in VO2max in 22 moderately trained male runners. Furthermore, they observed significant improvements in velocity over a 20-m sprint (mean 3.4%) distance jumped (mean 4.6%) along with a concurrent decrease in stance phase contact times (L. Paavolainen et al., 2003). These variables are thought to represent indirect measures of the neuromuscular system’s ability to repeatedly produce rapid force during intense exercise and its capability to store and utilize elastic energy (L. Paavolainen, Häkkinen, et al., 1999; L. M. Paavolainen, Nummela, & Rusko, 1999; L. Paavolainen, Nummela, Rusko, & Häkkinen, 1999). The authors suggested that improved performance was a result of enhanced neuromuscular characteristics and biomechanical efficiency that were transferred into improved muscle power and RE (L. Paavolainen, Häkkinen, et al., 1999).