SMR-LR nuc/ear dep/oyment scenario definition and ana/ysis in the time horizon 2020-2030: Case Study /ta/y
F. Vettraino, ENEA-Bologna
Descrittori
Tipologia del documento: Rapporto Tecnico
Collocazione contrattuale: Accordo di Programma ENEA-MSE
Argomenti trattati: Energia Nucleare, Analisci di Scenario, Valutazioni Economiche
Sommario
The study, refers to the hypothesis of a possible nuclear deployment scenario based on a mixed fleet of SIV1R (Small Medium Reactors) and LR (Large Reactors) in Italy in the time horizon 2020-2030.
High and Low Cases, aimed at the supply of 25% electricity in Italy at 2030, are analysed in terms of material mass flows together with some economics features dealing with global investment and LCOE (Levelized Cost of Electricity) fram lRs and SMRs.
The study has made also a contribution to the l'AEA "Coordinated Case Studies on
Competitiveness of SMR in Different Applications" part of a IAEA collaborative praject on
"Common Technologies and Issues for SMRs".
Note
Lavoro riferito alla linea progettuale LP1-E del/'AdP ENEA MSE del 21/06/07, Tema 5.2.5. 8 "Nuovo Nucleare da Fissione", "Studio di uno scenario relativo ad un ipotetico impiego di reattori nucleari di diversa taglia sul territorio nazionale e relative valutazioni economiche" (Deliverables E.1/E.2)
Copia n. In carico a: 2 NOME FIRMA 1 NOME FIRMA
o
EMISSIONE ~b.9. 201 ONOME F. VETTRAINO R. TINTI ~. MONTI
FIRMA
AdP ENEA-MSE 2-a Annualità
LP1: Linea Progettuale 1 – Studi su nuovo nucleare e partecipazioni ad accordi internazionali/bilaterali sul nucleare da fissione. Funzione Advisor
E. Studio di uno scenario relativo ad un ipotetico impiego di reattori nucleari di diversa taglia sul territorio nazionale e relative valutazioni economiche” (Deliverables E.1/E.2)
SMR-LR Nuclear Deployment Scenario Definition and Analysis in the Time Horizon 2020-2030: Case Study Italy
The study, refers to the hypothesis of a possible nuclear deployment scenario based on a mixed fleet of SMR (Small Medium Reactors) and LR (Large Reactors) in Italy in the time horizon 2020-2030.
High and Low Cases, aimed at the supply of 25% electricity in Italy at 2030, are analysed in terms of material mass flows together with some economics features dealing with global investment and LCOE (Levelized Cost of Electricity) from LRs and SMRs.
The study has made also a contribution to the IAEA “Coordinated Case Studies on
Competitiveness of SMR in Different Applications” part of a IAEA collaborative project on
"Common Technologies and Issues for SMRs". F. Vettraino, ENEA-Bologna Dec. 2009
Table of Content
Executive Summary 1. Introduction
2. Scenario definition
3. Analysis of the 20 GWe LR-SMR deployment scenario (Case Study 2)
4. Analysis of the 15 GWe LR-SMR deployment scenario (Case Study 1)
5. Some economics evaluations and comparisons
6. Interface with POLIMI model
7. Conclusions 8. References 9. Appendix
Executive Summary
Urged by energy mix rebalance need as well as energy costs and security , and GHG limitation rules deriving from Kyoto and EU protocols, Italian government made up decision to reconsider the nuclear electric generation option.
To face different constraints in terms of desired nuclear electric fraction and electricity demand growth rate up to 2030, the deployment of some 15 to 20 GWe nuclear power is required.
The nuclear reactor fleet is out-looked to be based primarily on Generation III large LWRs like EPR and AP1000.
The national involvement in the IRIS Small Medium Reactor development together with the higher flexibility that SMRs provide in terms of staggered multi-modular NPP deployment for reaching anyway large capacities in a limited number of NPP locations as could be the case where a large interconnected electric grid is already available, have made it interesting to analyse also deployment scenarios based on mixed LR-SMR nuclear fleet.
The Case Study which is here considered entails an about 20 GWe Scenario deployment (High_variant) corresponding to an electricity demand growth rate of 2.5% up to 2030. The corresponding nuclear fleet will result in 8 EPR units (1600 MWe each) and 5 IRIS blocks (4 x335 MWe IRIS modules per block).
Main output of the scenario analysis is the materials mass flow especially in terms of required natural uranium, SWU, depleted uranium and spent fuel stocks arising from the nuclear park operation from 2020 to 2090.
Main results for the 20 GWe Scenario show that some 3000 Mt/y of natural uranium would be required, with a cumulated uranium requirement, for the 60 years operation lifetime, being close to 180000 Mt, and a total spent fuel stock of about 23000 Mt.
Due to the IRIS reactor characteristics (higher enrichment in the fuel, lower burn-up, longer fuel cycle length with no re-shuffling) with respect to EPR, the materials mass flow analysis shows that SMR part of the nuclear park requires, in relative terms (tU/GWe), more natural uranium, more SWU and produces more spent fuel with respect to LR in the same park.
On the economics side, an estimation attempt to compare LCOE (Levelized Cost of Electricity) from EPR and IRIS n-th of a kind units, has been performed. The evaluation made in a wide range of ovcc (overnight capital cost) and for different fuel cost values, referred to 5% and 10% discount rate, provides a 62-94 $/MWh LCOE high range for EPR and 56-83 $/MWh for IRIS. The higher competitiveness related to generating cost for IRIS appears mainly attributable, at this stage of the analysis, to a shorter construction time period which results in lower total investment cost (including interests during construction).
1. Introduction
Concerns about energy cost, mix rebalance, source diversification, security of supply and GHG limitation, have grown up more and more during last years in Italy, the only G8 country without its own nuclear power and largest electricity importer in the world, with electricity prices some 45 % above the EU average, so as to determine the re-consideration of nuclear option.
The country that was amongst pioneers of civilian nuclear era at the beginning of the ‘60s, decided to shutdown all its four NPPs on the aftermath of a referendum held in November 1987 one year after the Chernobyl accident.
The energy consumption growth has made Italy the largest energy importer country amongst big industrialized economies with its imports accounting for about 85% of primary energy at end 2008. And the same situation applies to electricity with a (11-16)% import range during last 5 years. Primary energy Imports concentrate on gas, oil and few coal, while over than 70% of electricity comes from same fossil sources, the rest being provided by renewables (mainly hydro) and imports which have even skyrocketed for some time up to 50 TWh, mostly nuclear power from France, equivalent to output of about 7 GWe of nuclear capacity at 80% load factor.
Table 1: Electricity status Italy in 2008
In 2004 a new Energy Law opened up the possibility of joint venture with foreign companies for building and operating NPPs and importing electricity from them.
-0,1 +0.003 339,5 319,0 NETWORK DEMAND CONSUMPTION 100,0 347,8 TOTAL AVAILABILITY -11.2 11,5 40,0 NET ELECTRICITY IMPORT
-0,1 86,9
307,1 TOTAL NET PRODUCTION
0,0 0,0 0,0 Nuclear +22,9 -0,9 +20,3 +395,2 13,4 1,5 1,4 0,0005 46,7 5,2 4,9 0,2 Hydro Geothermal Wind PV +1.9 71,9 250,0 Fossil % TWh change 2008/2007 % 2008
In 2005 EdF and Enel signed a cooperation agreement which gives Enel 12.5% stake in the Flamanville-3 EPR nuclear reactor (this means some 200 MWe available to Enel) with possibility to have another 1000 MWe from the next five such units to be built. In the same year Enel also bought 66% of Slovak Electric utility (SE) which operates six nuclear reactors, with commitment for completion of the Mochovce NPP (2 VVER units for about 1000 MWe) by 2011-12.
In May 2008 the new Italian government confirmed be willing to go on with re-establishing nuclear power generation in the country with the target of having 25% of its electricity from nuclear by 2030 and with construction of first unit to be launched in 2014. In parallel the Government passed in May 2009 a legislation package aimed at expedite the new plants licensing by re-building the Regulatory Authority, facilitate selection of locations, and proceed with reorganization of the national Agency for nuclear R&D activities.
The situation of the country is unique in that it belongs to the group of large industrial economies, with a good background nuclear culture, coming from past experience, R&D continuation and good university education, added to an high level of basic infrastructures suitable to restart an important nuclear energy programme. This gives also the opportunity to make use of best up-to-date available technology as to the reactor systems. Generation III/III+ reactors like EPR (1600 MWe) and AP1000 (1117 MWe) are the candidate large reactors for a nuclear power park whose dimension would range from 10 GWe to 20 GWe.
Interest in those two reactors has advanced in 2009 either at governmental level (Agreements with France and US) or at industrial level (Agreements EdF-Enel and Ansaldo Nucleare-W)
Besides, the particular geography of the country and the special engagement that has been devoted during last few years to SMRs development, namely the 335 MWe IRIS reactor, creates an interesting chance for those reactors to be considered in the context of the deployment scenarios. Also this interest relies on the participation to the international IRIS Consortium led by Westinghouse, where the national contribution from national institutions (ENEA, Industry and University) is particularly relevant.
The consideration of an SMR like IRIS as part of the “Case Study Italy”, gives an opportunity to evaluate the influence in terms of involved mass flows as well as the possible advantages coming from modularity and staggered deployment to achieve the desired nuclear electricity generation target devised for Italy. SMRs show more flexibility with respect to geo-physical constraints which for some locations may be an obstacle to install large reactors, e. g. limited grid capacity, cooling water availability, ground seismicity.
2. Scenario definition
According to the governmental energy strategy that sets nuclear energy to supply 25% of the electricity demand by 2030, three variants are envisaged according to the expected electricity demand growth rate in the period 2007-2030:
- High variant (2.5 % growth rate of electricity demand) - Mid variant (1.5 % growth rate of electricity demand) - Low variant (1.0% growth rate of electricity demand)
Figure 1: Electricity demand growth Italy (TWh)
Electricity demand in Italy at end of 2007 was 340 TWh (see Fig. 1), so that the 25% target at 2030 from nuclear, would mean a 106-146 TWh range according to the assumed electricity growth rates. This would correspond to some 15-21 PWRs 1GWe each, operated at a 80% capacity factor.
The assumption made in our scenarios is that the nuclear fleet will be based on Generation III Large Reactors (LR) and Small Medium Reactors (SMR).
Large Generation III reactors are those like EPR from Areva and AP1000 from Westinghouse, ready for installation and currently being built in Finland, France and China.
EPR and AP1000 reactors are both first priority interest in nuclear electric generation revival in Italy. In fact the governmental and industrial partnership that
have been already settled with France and US are in order to streamline the process which is preliminary to site selection and plant construction.
Small Medium Reactors (SMR) are those like IRIS (International Reactor Innovative and Secure) developed by an international consortium under the Westinghouse leadership, with Italy being one most important partner of the consortium. The perspective is that, based on the competitive features of IRIS, this reactor could be part of the national fleet with possible construction starting by 2020 on.
To the purpose of our study, EPR (1600 MWe) and IRIS (335 MWe) reactors are envisaged to install the needed power which complies with the above mentioned 25 % electricity demand criterion, with first unit expected to be online by 2020.
For EPR first units we assume a cautious construction time period of 7 years, that will drop down to 6 yrs for 3-rd unit and to 5 yrs from 4-th unit on.
Likewise we assume that first 4 units of IRIS reactor, ready for construction from 2020, will come online in 4 years, while from the 5-th unit on the construction time will be reduced to 3 years.
Given the above constraints, construction of first EPR unit is assumed to be started in 2014 in order it be connected to grid by 2020. Lifetime for all reactors is assumed to be 60 years, this meaning that operation time for the entire fleet will span from 2020 to 2090.
A NPP is assumed to host either 1 or 2 EPR units (1600-3200 MWe) or 2-4 twin-IRIS unit (1340-2680 MWe).
Though two sets of scenarios have been identified, Scenario 1 based only on a LR fleet and Scenario 2 based on a mixed LR+SMR fleet, here we refer to Scenario 2 only.
In the following Figures 3-4 the High, Mid and Low variants of Scenario2 are illustrated.
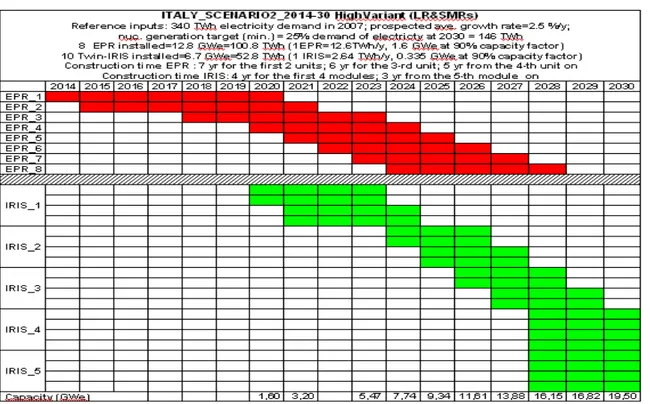
Scenario 2_High: depicts the deployment of 8 EPR units and 5 IRIS blocks (each
block consisting of 2 twin-IRIS modules). The total power accounts for 19.5 GWe consistent with the 2.5 % electricity growth rate and 25% electricity demand target at 2030, as above mentioned, for a nuclear electricity output close to 154 TWh.
Figure 2: Scenario 2-High
Scenario 2_Mid: depicts the deployment of 6 EPR units and 5 IRIS blocks (each
block consisting of 2 twin-IRIS modules). The total power accounts for 16.3 GWe consistent with the 1.5 % electricity growth rate and 25% electricity demand target at 2030, as above mentioned, for a nuclear electricity output of about 128 TWh.
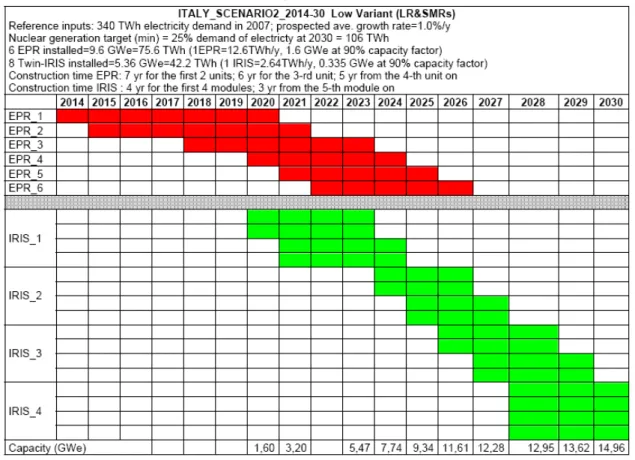
Scenario 2_Low: depicts the deployment of 6 EPR units and 4 IRIS blocks (each
block consisting of 2 twin-IRIS modules). The total power accounts for 14.96 GWe consistent with the 1.0 % electricity growth rate and 25% electricity demand target at 2030, as above mentioned, for a nuclear electricity output of 118 TWh.
Figure 4: Scenario 2-Low
2.1 Reactors
As mentioned above the reactors selected in our scenario study are EPR and IRIS reactors. The two reactors are both PWR (Pressurized Water Reactor), the most widespread and with largest consolidated experience category in the world.
EPR, a Large Reactor example, being already an official candidate due to the 2009 EdF-Enel agreement on nuclear power plants to be built in Italy, in addition the units which are already being built or planned in France in the next future (Flamanville and Penly).
IRIS (335 MWe) is an innovative PWR belonging to Small Medium Reactor class, which is under development by an international consortium led by Westinghouse, whit the participation of research institutions, university and national industry (ENEA, CIRTEN, Ansaldo Nucleare, Mangiarotti Spa), and expected to receive design certification from NRC by 2016.
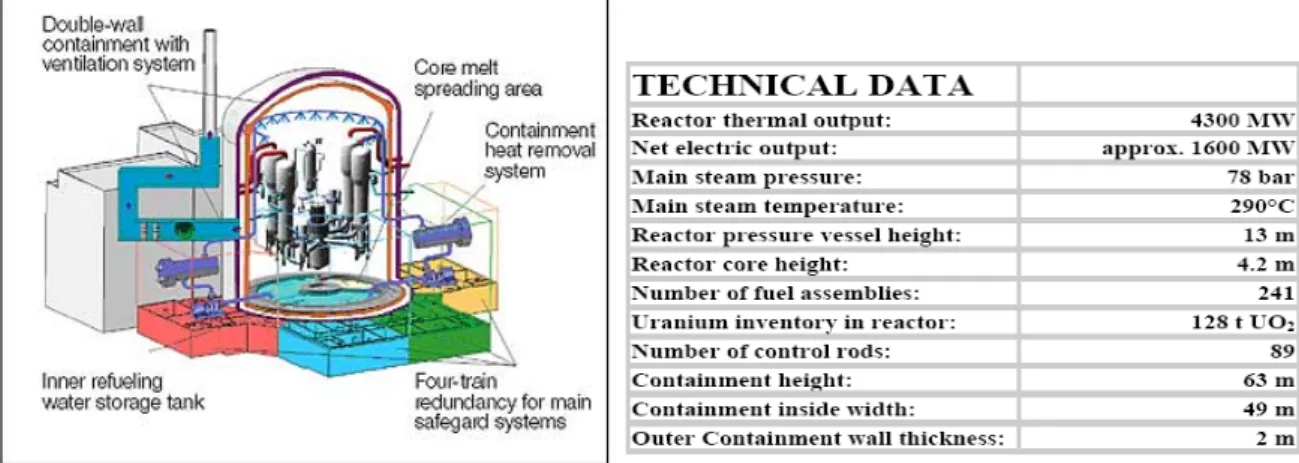
EPR (European Pressurized Reactor)
is a 1600 MWe (net power) PWR, developed by Areva, deriving from french N4 and german Konvoi reactors, with a 10% cost reduction objctive. EPR is designed also for a flexible operating mode (load following) and to be able to achieve a fuel burn-up level of 60 MWd/kg (45-50 MWd/kgis is the current Gen II PWRs level) with a 37% plant efficiency tanks also to an advanced turbo-generator which enables a gain of some 70 MWe capacity. The reactor core is designed to host either enriched UOX fuel (4.4% enriched) or MOX (Mixed-Oxide) plutonium bearing fuel up to 100% of the core loading. Operational targets in terms of efficiency, capacity factor (92%) and lifetime (60 yr) are among the highest achievable at moment.
Figure 5: EPR reactor
The EPR safety strategy relies on abut 1500 reactor-year experience of the
franco-german reactors and is based on a quadruple redundancy concept of the active safety systems and on a double-wall reinforced concrete containment structure strongly improved, 1 meter thickness with internal steel liner. As a consequence the reactor shows.
- CDF (core damage frequency) level less than 10-5 events/reactor.yr
- reduced severe accident effects and confined within the reactor containment thanks also to the core catcher system aimed at collecting and cooling down the corium in case of core melting
- reduced volume of spent fuel (about 30% vol.) at equal energy output - reduced dose to personnel and radioactive release (collective dose is 0.4
man.Sv against about 1 man.Sv for current western NPPs)
The quadruple redundancy safety concept (instead of double in current reactors) ensures for safe immediate reactor shutdown and core cooling, while keeping temperature and pressure in the containment system below the design limits. Adding to this is the reinforced protection of the sensitive buildings (reactor and control
room) against possible external aggressions and large aircraft impact, the just cited core catcher (under the reactor vessel) devoted to collect and safely isolate corium in case core melting should occur. EPR design complies with European Utility Requirements (EUR), the stringent rules set up by european utilities under the franco-german initiative during the ‘90s. An American version (US-EPR) of the reactor has been submitted to US-NRC for certification in 2007.
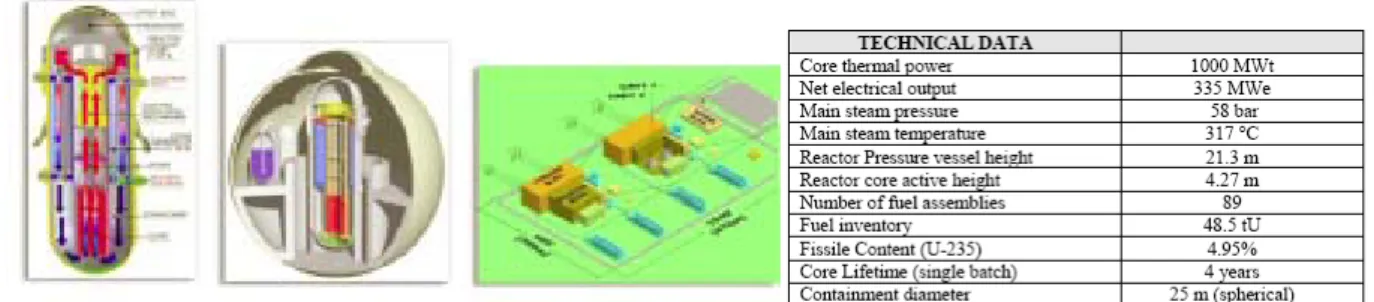
IRIS (International Reactor Innovative and Secure)
belongs to Gen III+ Near Term Deployment systems expected to be deployed in the next 10-15 years with a sort of forerunner role with respect to Gen IV systems. It is a modular Small Medium Size Reactor, PWR type, with a 335 MWe capacity under development by an international consortium of some 20 partners from 10 countries, led by Westinghouse. The reactor size has been selected so as to be deployed especially in developing countries, with small electric grids and able to provide combined electricity, heat and potable water supply, but also for deployment in developed countries as a multi-module NPP operated by a centralized control room. Safety by Design is the inspiring concept for IRIS, made explicit through a simplified , compact system configuration where all primary loop components (steam generators, pumps, pressurizer, control rods) are housed within the reactor vessel.
Figure 6: IRIS reactor
This enables eliminate the majority of pipes and valves of the primary loop (possible source of major accident leading to loss of coolant) and drastically reduce or mitigate higher class accidents (88% of Class IV accidents is outright eliminated). This results
in a CDF (Core Damage Frequency) as low as ~10-8, vs. 10-6-10-7of Advanced
PWRs, outages each 4 years with minor maintenances possible during operation, all leading to capacity factors higher than 90%. The absence of boron in the primary loop enables to avoid risk of stress corrosion fracture (see Davis Besse, 2002).
IRIS development programme started in 1999 and foresees the design certification release by NRC in 2016. The modularity of IRIS makes good potential for a strong economic competitiveness trough possibility of staggered investment for deployment of a stated capacity, with respect to Large Reactors which would require huge investment, in some case unaffordable, to be put all in advance.
3. Analysis of the 20 GWe LR-SMR deployment scenario (Case Study 2)
The objective of our Case Study is to analyse SMR potentialities and effects in terms of materials mass flows and electricity generation cost (LCOE) when introduced in a nuclear fleet of LRs. Therefore two enveloping situations were judged worth to be
analysed:
- Case Study 1 (Scenario 2_Low )
- Case Study 2 (Scenario 2_High)
Scenario 2_High refers to the max. electricity growth rate (2.5 %/yr) in the period 2014-2030, so as to require the reactor fleet to generate at least 146 TWh by 2030. This can be achieved by installing 8 EPR units which will provide a 12.8 GWe capacity equivalent to 100.8 TWh/yr of electricity at 90% capacity factor, and 10 twin-IRIS units providing 6.7 GWe capacity equivalent to 52.8 TWh electricity at 95% capacity factor. The total fleet capacity will be 19.5 GWe able to deliver a total 154 TWh/yr which is somewhat above the desired minimum target of 146 TWh/yr.
A cautious assumption is made for the construction time of different units. For first two EPR units a construction time of 7 years is considered, that drops down to 6 yrs for the 3-rd unit and finally to steady 5 yrs since the 4-th unit on, with the first unit coming on line at end 2020 and last at end 2028.
Likewise, for IRIS reactor a 4 yr construction time is assumed for the first 4 modules, while a 3 yr time is considered since the 5-th module on, with first unit coming on line at end 2023 and last at end 2030.
In terms of building effort that would mean a total average installation rate of some 1.15 GWe/yr which will peak up to 1.6 GWe/yr for EPR (1 equivalent unit) and 1.3 GWe/yr for IRIS (4 equivalent modules) during the deployment period. All this values are, however, well below the building effort of about 4 GWe/yr that characterized the construction of the majority of the French nuclear park during the second part of the ‘70s up to the end of ‘80s, by reaching a total installation of some 50 GWe in about 13 years.
Once-through cycle based on standard UOX (enriched Uranium oxide) fuel is assumed for the case.
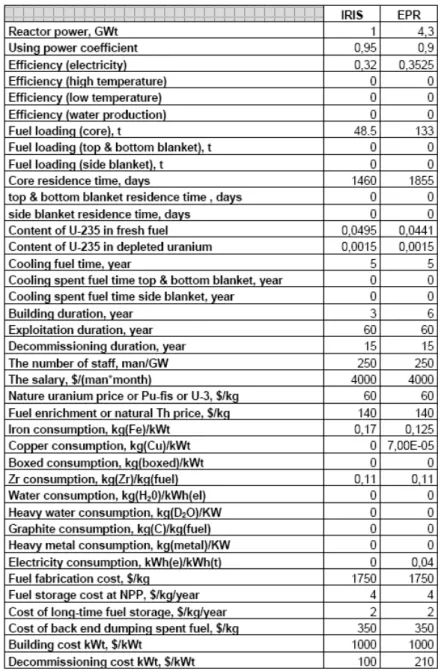
The analysis aimed at assessing the material mass flows (nuclear and non-nuclear) together with energy generated, resulting from the reactor fleet deployment, has been performed by means of the DESAE 2.1 code available in the context of the IAEA INPRO . The reactor data inputs used in DESAE are reported in Table 2 below.
Table 2: Reactor Input data for DESAE
In the following Figures (7-11) some of most relevant results such as power capacity and electricity production, power commissioning/decommissioning curves, natural uranium and SWU requirements, spent fuel and fission product build-up, from DESAE outputs are reported.
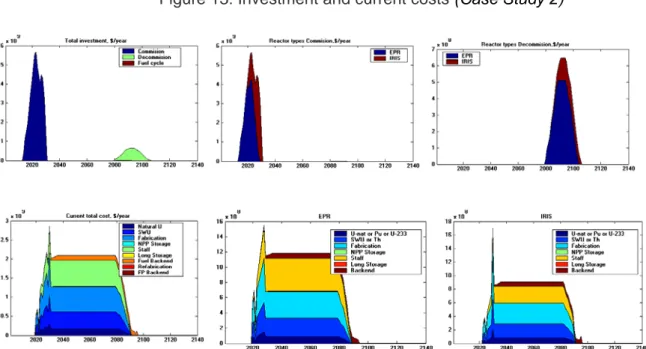
In Figure 12 also requirements of some other non nuclear materials (zirconium, steel, copper and service electricity) are reported. In Figure 13 the yearly investment and current costs are illustrated.
Figure 7: Power capacity and electricity output (Case Study 2)
Figure 8: Power capacity commissioning and decommissioning (Case Study 2)
Figure 10: Total natural uranium and SWU needs (Case Study 2)
Figure 12: Non nuclear materials (Case Study 2)
4. Analysis of the 15 GWe LR-SMR deployment scenario (Case Study 1) As referred above, Case Study 1 (Scenario 2_Low), refers to the low electricity
growth rate (1. %/yr) in the period 2014-2030, so as to require the reactor fleet to generate at least 106 TWh by 2030. This can be achieved by installing 6 EPR units which will provide a 9.6 GWe capacity equivalent to 75.6 TWh/yr of electricity at 90% capacity factor, and 8 twin-IRIS units providing 5.4 GWe capacity equivalent to 42.2 TWh electricity at 95% capacity factor. As shown in Figure 4, the total resulting fleet capacity is close to 15 GWe able to deliver a total 118 TWh/yr which is somewhat above the desired minimum target of 106 TWh/yr.
For the construction time of different units same assumptions as for Scenario2_High are made.
In terms of building effort that would mean a total average installation rate of some 0.88 GWe/yr which will peak up to 1.233 GWe/yr for EPR (less than 1 equivalent unit) and 0.893 GWe/yr for IRIS (less than 3 equivalent modules) during the deployment period. In terms of building effort all this values are well below than those for Case Study 2 (Scenario 2_High).
Once-through cycle based on standard UOX (enriched uranium oxide) fuel is assumed for this case also.
Alike Scenario 2_high (Case 2) the material mass flows analysis is performed with DESAE code under the same assumptions and reactor data inputs.
In the following Figures (14-18) some of the most relevant results such as power capacity and electricity production, power commissioning/decommissioning curves, natural uranium and SWU requirements, spent fuel and fission product build-up, from DESAE outputs are reported.
In Figure 19 also requirements of some other non nuclear materials (zirconium, steel, copper and service electricity) are reported, and in Figure 20 the yearly investment and current costs are illustrated as well.
Figure 15: Power capacity commissioning and decommissioning (Case Study 1)
Figure 16: Yearly natural and depleted uranium mass (Case Study 1)
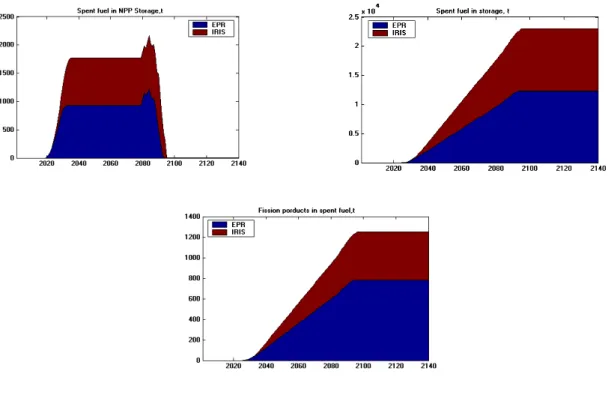
Figure 18: Spent fuel and fission products (Case Study 1)
5. Some economics evaluations and comparisons
Based on the assumption of n-th of kind unit, a compared evaluation of the Levelized Cost of Electricity (LCOE) for EPR and IRIS reactors has been performed. Driving independent variable is the overnight capital cost (ovcc) for which a reasonably wide range of value is explored: 4500 $/kWe for IRIS and
2000-3500 €/kWe for EPRwith reference to twodifferent discount rate values, 5 % and
10% (see Table 3 and 4 below).
Table 3: Reactor inputs for LCOE (Levelized Cost of Electricity) evaluation - Case 5% d.r. -
IRIS EPR
Overnight capital cost range (ovcc) ^ 2000-4500 $/kWe 2000-3500 €/kWe Power 335 MWe 1600 MWe Construction period 3 yr 6 yr Plant Lifetime 60 yr 60 yr WACC (weighted average capital cost) 5 % * 5 % * Debt/equity ratio 80/20 80/20 Investment profile during construction uniform uniform Capacity factor 90% 90%
O&M cost 9.5 $/MWh)** 7.9 €/MWh)** Fuel cycle cost 7-9 $/MWh 5.8-7.5 €/MWh Decommissioning cost 500 $/kWe*** 500 €/kWe***
^ Includes owner, EPC and contingencies. Refurbishment and other important infrastructures
(e.g. new HV transmission lines, important viability works , etc,) excluded. Inflation not taken into account. (*) corresponding to a financial structure of 80/20 debt-equity ratio with debt rate=6% and equity rate=10%, (**) according to NEI White Paper, Aug. 2008
(***) some other source consider higher value (about 1/3 of ovcc) but given discounting to COD that has not much effect on LCOE
Table 4: Reactor inputs for LCOE (Levelized Cost of Electricity) evaluation - Case 10 % d.r. -
IRIS EPR
Overnight capital cost range (ovcc) ^ 2000-4500 $/kWe 2000-3500 €/kWe Power 335 MWe 1600 MWe Construction period 3 yr 6 yr Plant Lifetime 60 yr 60 yr WACC (weighted average capital cost) 10 % * 10 % * Debt/equity ratio 50/50 50/50 Investment profile during construction uniform uniform Capacity factor 90% 90%
O&M cost 9.5 $/MWh)** 7.9 €/MWh)** Fuel cycle cost 7-9 $/MWh 5.8-7.5 €/MWh Decommissioning cost 500 $/kWe*** 500 €/kWe***
^ Includes owner, EPC and contingencies. Refurbishment and other important infrastructures
(e.g. new HV transmission lines, important viability works , etc,) excluded. Inflation not taken into account. (*) corresponding to a financial structure of 50/50 debt-equity ratio with debt rate=8% and equity rate=15%, respectively.
(**) according to NEI White Paper, Aug. 2008
(***) some other source consider higher value (about 1/3 of ovcc) but given discounting to COD that has not much effect on LCOE
The simple equation for calculating LCOE is as following :
LCOE = (Tot. Capital cost + O&M cost +Fuel cost + Decomm.cost) / Total electricity production
Where each term is discounted forwards (capital cost) or backwards (O&M, fuel,
decommissioning costs, electricity production) according to WACC, at the commissioning plant date (COD) which corresponds to end of the construction time. Exact equation in the excel spreadsheet model used in calculations is:
Nc No Nc i Nc i i Nc i No Nc Nc i Nd No Nc No Nc i Nc i i Nc i i i Nc i i r E r CD r CF COM r C LCOE 1 ) ( 1 1 1 ) ( ) ( ) 1 ( ) 1 ( ) 1 ( ) 1 ( ) 1 (-
LCOE = Average lifetime levelized electricity generation cost-
Ci = Capital expenditures in the year i-
COMi= Operation&Maintenance expenditures in the year i-
CFi= Fuel expenditures in the year i-
CDi= Decommissioning expenditures in the year i-
Ei = Electricity generation in the year i (MWh)-
r = discount rate (WACC)-
Nc= construction time (yr)-
No = Operation Lifetime of the system (yr)-
Nd= decommissioning duration (yr)
Fuel cost estimation based on the values at end 2007 (95 $/kg U3O8 corresponding to 1/3 of the peak spot price of 130 $/lb U3O8), for a 50 MWd/kg burn-up, would lead to 7.50 $/MWh. The conservative hypothesis reported in the Table 5 below (130 $/lb U3O8) and for a 60 MWd/kg burn-up, would lead fuel cost to 9.10 $/MWh
Table 5: Once-through Fuel cycle cost of 1 kg UO2 fuel (4.5% U-235) for commercial LWR
Source: WNA, MIT, The Ux Consulting Co.)
As to O&M costs some more details are reported in the Table 7 at the end of the paragraph which synthetically gathers all most recent data from different sources on the nuclear costs.
LCOE (10% d.r. )
In the following Figures 21 and 22, LCOE for IRIS and EPR is reported as a
function of ovcc (overnight capital cost) together with different components. It can be noted that in the graph does not appear the decommissioning cost curve being this, as an effect of the long time discounting, negligible with respect to other components (Capital, O&M and Fuel).
Fig.21 - IRIS Levelized Cost of Electricity (LCOE)
Fig.22 - EPR Levelized Cost of Electricity (LCOE) Uranium 8. kg U3O8 x $278 2224 Conversion 8. kg U x $12 96 Enrichment 8. SWU x $150 1200 Fabrication per kg 300 Storage&disposal per kg 500
Total, approx: US$ 4320
335 MWe IRIS - Levelized Cost Of Electricity (LCOE) (3 yr construction time, 10% d.r., fuel 9.0 USD/MWh, O&M 9.5 USD/MWh)
0 10 20 30 40 50 60 70 80 90 100 110 2000 2500 3000 3500 4000 4500
Overnight Capital Cost (USD/kWe)
LC OE ( U S D /M W h ) LCOE-f9($/MWh) CC($/MWh) O&M($/MWh) Fuel($/MWh) Dec($/MWh)
335 MWe IRIS - Levelized Cost Of Electricity (LCOE) (3 yr construction time, 10% d.r., fuel 9.0 USD/MWh, O&M 9.5 USD/MWh)
0% 20% 40% 60% 80% 100% 2000 2500 3000 3500 4000 4500
Overnight Capital Cost (USD/kWe
LC
O
E
(%)
In Figure 23 a comparison of LCOE from IRIS and EPR, for a fuel cost variation from 7 to 9 $/MWh in IRIS and 5.8 to 7.5 Euro/MWh in EPR, is reported. It can be noted how the about 29% increment in fuel cost translates in only some about 4 %
increase at the maximum in LCOE value either for IRIS or EPR.
Fig. 23 - Levelized Cost of Electricity: IRIS and EPR
LCOE (5% d.r. )
In the following Figures 24-25, Levelized Cost of Electricity referred to a 5% d.r. is reported for IRIS and EPR reactors respectively with all other assumptions same as above.
LCOE-Levelized Cost Of Electricity - 1600 MWe EPR (6 yr construction time, 10% d.r., fuel 7.5 Euro/MWh)
0% 10% 20% 30% 40% 50% 60% 70% 80% 90% 100% 2000 2500 2600 3000 3500
Overnight Capital Cost (Euro/kWe)
LCO E ( % ) CC (%) O&M (%) Fuel (%)
Levelized Cost Of Electricity (LCOE) - 1600 MWe EPR (6 yr construction time, d.r. 10%; fuel=7.5 Euro/MWh)
0 10 20 30 40 50 60 70 80 90 2000 2200 2400 2600 2800 3000 3200 3400
Overnight capital cost (Euro/kWe)
LC OE ( E ur o/ MW h) LCOE_f7.5(€/MWh) CC(€/MWh) O&M(€/MWh) Fuel(€/MWh)
335 MWe IRIS - Levelized Cost Of Electricity (LCOE (3 yr construction time, 10% d.r., fuel 7-9 USD/MWh)
0 10 20 30 40 50 60 70 80 90 100 2000 2500 3000 3500 4000 4500
Overnight Capital Cost (USD/kWe)
LC O E (U S D /M W h ) LCOE_f7($/MWh) LCOE-f9($/MWh)
LCOE-Levelized Cost Of Electricity - 1600 MWe EPR (6 yr construction time, 10% d.r. , fuel= 5.8-7.5 Euro/MWh)
0 10 20 30 40 50 60 70 80 90 2000 2500 2600 3000 3500
Overnight Capital Cost (€/kWe)
LC OE (€ /M Wh) LCOE_f5.8(€/MWh) LCOE_f7.5(€/MWh)
Fig.24 - IRIS Levelized Cost of Electricity (LCOE)
335 MWe IRIS - Levelized Cost Of Electricity (LCOE) (3 yr construction time, 5% d.r., fuel 9.0 USD/MWh, O&M 9.5 USD/MWh)
0 10 20 30 40 50 60 70 80 90 100 110 2000 2500 3000 3500 4000 4500
Overnight Capital Cost (USD/kWe)
LC O E ( U S D /M W h ) LCOE-f9($/MWh) CC($/MWh) O&M($/MWh) Fuel($/MWh) Dec($/MWh)
335 MWe IRIS - Levelized Cost Of Electricity (LCOE) (3 yr construction time, 5% d.r., fuel 9.0 USD/MWh, O&M 9.5 USD/MWh)
0% 10% 20% 30% 40% 50% 60% 70% 80% 90% 100% 2000 2500 3000 3500 4000 4500
Overnight Capital Cost (USD/kWe
LCO E ( % )
CC (%) O&M (%) Fuel (%) Dec%
Fig.25 - EPR Levelized Cost of Electricity (LCOE)
Levelized Cost Of Electricity (LCOE) - 1600 MWe EPR (6 yr construction time, d.r. 5%; fuel=7.5 Euro/MWh)
0 5 10 15 20 25 30 35 40 45 50 2000 2200 2400 2600 2800 3000 3200 3400
Overnight capital cost (Euro/kWe)
LCO E (Euro/MWh) LCOE_f7.5(€/MWh) CC(€/MWh) O&M(€/MWh) Fuel(€/MWh)
LCOE-Levelized Cost Of Electricity - 1600 MWe EPR (6 yr construction time, 5% d.r., fuel 7.5 Euro/MWh)
0% 20% 40% 60% 80% 100% 2000 2500 2600 3000 3500 Overnight Capital Cost (Euro/kWe)
LC
O
E
(%)
CC (%) O&M (%) Fuel (%)
In Figure 26 a comparison of LCOE from IRIS and EPR, for a fuel cost variation from 7 to 9 $/MWh in IRIS and 5.8 to 7.5 Euro/MWh in EPR, same as in Figure 23, is reported. It can be noted that also in this case, the about 29% increment in fuel cost translates in only about 4 % increase, at the maximum, in LCOE value either for IRIS or EPR.
Fig. 26 - Levelized Cost of Electricity: IRIS and EPR
335 MWe IRIS - Levelized Cost Of Electricity (LCOE (3 yr construction time, 5% d.r., fuel 7-9 USD/MWh)
0 10 20 30 40 50 60 2000 2500 3000 3500 4000 4500
Overnight Capital Cost (USD/kWe)
L C O E ( U S D /M W h ) LCOE_f7($/MWh) LCOE-f9($/MWh)
LCOE-Levelized Cost Of Electricity - 1600 MWe EPR (6 yr construction time, 5% d.r. , fuel= 5.8-7.5 Euro/MWh)
0 5 10 15 20 25 30 35 40 45 50 2000 2500 2600 3000 3500
Overnight Capital Cost (€/kWe)
L C O E ( € /M W h ) LCOE_f5.8(€/MWh) LCOE_f7.5(€/MWh)
In the following Figure 27, the total EPR-IRIS reactors fleet overnight investment range is reported with reference to Scenario 2 (Low-High)
Figure 27 - Total overnight investment cost in $ for Scenario2 _Low-High range (based on ovcc 3000 $/kWe)
In the following Figure 28, total investment for the single IRIS and EPR units, is reported with reference to overnight cost, 5% d.r. and 10% d.r values.
Figure 28 - Total investment single unit IRIS and EPR
335 MWe IRIS - Total overnight investment simulation (interests during construction excluded)
0,00E+00 2,00E+08 4,00E+08 6,00E+08 8,00E+08 1,00E+09 1,20E+09 1,40E+09 1,60E+09 2000 2500 3000 3500 4000 4500
Overnight Capital Cost (USD/kWe)
USD
335 MWe IRIS - Total investment simulation (5 % d.r. interests during construction included, uniform yearly o.n. investment)
0,00E+00 2,00E+08 4,00E+08 6,00E+08 8,00E+08 1,00E+09 1,20E+09 1,40E+09 1,60E+09 1,80E+09 2000 2500 3000 3500 4000 4500 Overnight Capital Cost (USD/kWe)
US
D
3rd-yr 2nd-yr 1st-yr
335 MWe IRIS - Total investment simulation (10 % d.r. interests during construction included, constant yearly o.n. investment)
0,00E+00 2,00E+08 4,00E+08 6,00E+08 8,00E+08 1,00E+09 1,20E+09 1,40E+09 1,60E+09 1,80E+09 2,00E+09 2000 2500 3000 3500 4000 4500 Overnight Capital Cost (USD/kWe)
US
D
3rd-yr 2nd-yr 1st-yr
1600 MWe EPR - Total overnight investment simulation (interests during construction excluded)
0,00E+00 1,00E+09 2,00E+09 3,00E+09 4,00E+09 5,00E+09 6,00E+09 2000 2500 2600 3000 3500
Overnight capital cost (Euro/kWe)
Eur
o
s
1600 MWe EPR - Total investment simulation (5 % d.r. interests during construction included, constant yearly o.n. investment)
0,00E+00 1,00E+09 2,00E+09 3,00E+09 4,00E+09 5,00E+09 6,00E+09 7,00E+09 2000 2500 2600 3000 3500
Overnight capital cost (Euro/kWe)
Eu ro s 6th-yr 5th-yr 4th-yr 3rd-yr 2nd-yr 1st-yr
1600 MWe EPR - Total investment simulation (10 % d.r. interests during construction included, constant yearly o.n. investment)
0,00E+00 1,00E+09 2,00E+09 3,00E+09 4,00E+09 5,00E+09 6,00E+09 7,00E+09 8,00E+09 9,00E+09 2000 2500 2600 3000 3500
Overnight capital cost (Euro/kWe)
Eu ro s 6th-yr 5th-yr 4th-yr 3rd-yr 2nd-yr 1st-yr
Lastly in the folowing Tables 6a and 6b, a comparison of LCOE (values expressed in $) for both reactors is reported. Still from the Table in question, at equal ovcc value and for an assumed 1.2 Euro/$ ratio, it appears IRIS holds some competitive potential essentially due to shorter construction time and hence a relatively lower total investment cost (overnight plus interest during construction).
Table 6a: Levelized Cost of Electricity: LR–SMR comparison (10% d.r.)
Table 6b: Levelized Cost of Electricity: LR–SMR comparison (5% d.r.)
Table 7: Recent data on nuclear costs from different sources
Overnight capital cost
• 2500 €/kWe EdF (EPR-Flamanville, end 2008. Cost was 2060 €/kWe in 2005) • 1875 “ TVO (EPR_Olkiluoto, 2003 but escalation expected)
• 3500-4500 $/ kWe NEI (NEI_White Paper_aug.2008)) • 4000 “ MIT (May.2009)
• 1970-3380 €/kWe EC ( SEC_2008 2872, Nov. 2008)
Fuel cost • 7.5 $/MWh NEI_White Paper_aug.2008 • 7 “ MIT_May.2009 • 8 “ EPRI_Mar.2009 • 8.6 “ EIA-DOE_Mar.2009\nm b O/M • 9.5 $/MWh NEI_White Paper_aug.2008 • 8 “ MIT_May.2009 • 15 “ EPRI_Mar.2009 • 11.5 “ EIA-DOE_Mar.2009 Decommissioning
• 500 $/kWe NEA_2006 (max)
LCOE
• 54 €/MWh EdF_Flamanville_2008 (for the 2-nd EPR: 55-60 €/MWh ed) • 64-76 $/MWh NEI_White Paper_aug.2008
• 84 “ MIT_May.2009 • 73 “ EPRI_Mar.2009 • 102 “ EIA-DOE_Mar.2009
• 55-90 €/MWh EC (SEC_2008 2872, Nov. 2008. Values are for High Fuel Price Scenario and cover ions over the period 2007-2030)
6. Interface with POLIMI model
Inputs from Case Studies such as defined at par. 2 are used by POLIMI in order to the investment analysis by means of its INCAS model under development within this same IAEA context.
In the Appendix at par. 9 a cross-check with the POLIMI model on LCOE evaluations, as described above, is also reported.
7. Conclusions
7.1 Scenario assessment
The 20 GWe scenario is likely feasible in the outlooked timeframe (2014-2030). It will mean a reasonable effort to build around 1.6 GWe/yr at the peak point during deployment, as pointed out at par. 3 above.
The mixed LR-SMR fleet deployment will require the IRIS reactor be ready to built for 2020
From the involved materials flow standpoint it appears that IRIS fraction of the park, requires, in relative terms, higher natural Uranium and higher SWU, produces higher depleted uranium and spent fuel, due to higher U-235 enrichment and lower burn-up (at least on basis of the considered inputs which foresees in IRIS a 4 yr straight burn cycle length).
Most relevant figures on mass flow materials involved with High and Low scenario here analysed are:
- yearly uranium requirements: 2200 Mt/y (Low Case), 3000 Mt/y (High Case) - cumulated uranium requirements: 145000 Mt (Low Case), 180000 Mt (High Case)
- cumulated spent fuel: 18000 Mt (Low Case), 23000 Mt (High Case) IRIS fraction in the mass flows above appears to be somewhat higher with respect to EPR, compared to power fraction in the park, due to the fact that IRIS fuel requires an higher enrichment and delivers a relatively lower burn-up.
The advantages like higher flexibility on plant location, which may help ease limits on site capability and geo-physical features (e.g. seismics, water availability, etc.), proximity to inhabitated areas, cannot be made evident through the present analysis. Here the POLIMI model is necessary. 7.2 Economics
At least on the basis of the present assumptions, i.e. in the hypothesis of the
n-th of a series SMR, when all positive features are fully developed (learning
curve, short construction time, design and installation simplicity, multiple units, etc. ), it looks like SMRs can achieve competitive cost of electricity compared to LRs.
For the case here analysed the main reason for a lower LCOE from IRIS with respect to EPR, appears mainly to lie in a shorter construction time period (lower TCIC).
All the above is especially evident when discount rate increases from 5% to 10% as shown in the study.
8. References
[1] F. Vettraino: “ SMR-LR deployment scenario definition and preliminary analysis – Case Study Italy in the time horizon 2020-2030”, IAEA-Technical Meeting to
“Cooordinate Case Studies on Competitiveness of SMRs in Different applications”,
IAEA Headquarters, Vienna, June 23-26, 2009.
[2] S. Boarin^, M. Cerini^, M. Ricotti^, F. Vettraino: “ Studi di Scenario ed Estensione del
Modello Economico-Finanziario per la Realizzazione di un Parco-Reattori Nucleari in Italia nell’orizzonte 2020-2030”, Dic. 2008 (ENEA-POLIMI document)
[3] V. Tsibulskiy, S. Subbotin, M. Khroshev, F. Depisch, “DESAE (Dynamic Energy System- Atomic Energy) Integrated computer model for performing Global Analysis in
INPRO Assessment Studies”, Proc. 14th Int. Conf. on Nuclear Engineering, Miami,
Florida, USA, July 17-20, ASME, 2006, ICONE14-10270.
[4] “Approaches to assess competitiveness of Small and Medium Sized Reactors (SMRs)”, to be published in 2009 – IAEA, NUCLEAR ENERGY SERIES REPORT, par.4.6 “Scenario codes”
[5] S. Boarin, G. Locatelli, M. Mancini, P. Trucco, M. Ricotti ; “INCAS: a tool for the selection of the suitable SMRs deployment strategy at country level for a private/public investor -investment Model: status, application & development –“, IAEA-Technical Meeting to “Cooordinate
Case Studies on Competitiveness of SMRs in Different applications”, IAEA
Headquarters, Vienna, June 23-26, 2009.
[6] “The Cost of New Generating Capacity in Perspective”, White Paper, NEI, Aug. 2008
[7] Commission of the European Communities, Second Strategic Energy Review: “An EU Energy Security and Solidarity Action Plan: Energy Sources, Production Costs and Performance of Technologies for Power Generation, Heating and Transport”, SEC (2008)2872, Nov. 2008
[8] MIT-2003, The Future of Nuclear Power (An interdisciplinary MIT Study) [9] UC-2004, The Economic Future of Nuclear Power Plants
[10] The New Economics of Nuclear Power (WNA Report, Dec. 2005)
9.Appendix
Under this same project, Polytechnic of Milano (POLIMI) has been developing the INCAS code that is still undergoing its finalization work, while a “trial version” is ready and able to elaborate a set of key financial indicators.
As said at par. 5, trial testing with INCAS has been run on scenario simulation by assuming the boundary conditions as defined in the ENEA Case Study Italy.
The code has also been used to make a cross-checking on Levelized Cost Of Electricity (LCOE) with reference to values calculated at par. 5 (Table 6a-6b). To this purpose, though one INCAS main capability is to calculate LCOE referred to the entire installed fleet, the comparison has been done on n-th of a kind reactor (independently from specified deployment pattern and timing), same as for the ENEA case.
Levelized Cost of Electricity
In the following tables the different specific inputs assumed in the calculation are reported.
Table 9.1 - Reactor-specific inputs
reactor type EPR IRIS
power output (MWe) 1600 335
capacity factor 90% 90%
O&M cost (€/MWh) 7,90 7,90
Fuel cycle cost (€/MWh) 7,50 7,50
Decommissioning cost (€/MWh) 1,06 0,88
expected construction period fot nth unit 6 years 3 years
operating life 60 years 60 years
design saving factor on capital costs 100% 80%
cumulated capital expenditure profile S' curve S' curve
Table 9.2 - Country-specific inputs
inflation rate 0%
electricity price increase rate 0%
corporate tax rate 35%
cost of equity cost of debt
financing mix: D/(D+E) debt amortization period
depreciation period for fixed assets escalation rate for capital costs overnight capital cost (€/kWe)
10 years 12.5 years 0% min 2000 €/kWe max 3500 €/kWe 15% 8% 50% 80% 10 years 12.5 years 0% 10% 6%
(*) with 1.2 exchange rate EUR/$.
Simulation results
According to the assumptions about the overnight capital costs and the cost of capital (debt and equity) 4 sub-cases are identified. The following Table 9.4 resumes the LCOE calculation with INCAS for each of the 4 sub-cases, with included corresponding ENEA values.
Table 9.4 – LCOE evaluation with INCAS
Cost of debt 6% and equity 10%, with debt/equity=80/20, corresponds to d.r.= 5%
Cost of debt 8% and equity 15%, with debt/equity=50/50, corresponds to d.r.= 10%
As done in ENEA calculations, a single reactor plant representing the n-th of a kind, stand alone unit, either for EPR or IRIS, is considered in INCAS with same assumptions on:
Construction costs,
operating costs (O&M, fuel cycle and decommissioning),
plant lifetime, construction period, cost of debt, cost of equity,
EPR
avg. OCC cost of equity (%) 10% 15% 10% 15% cost of debt (%) 6% 8% 6% 8% Financing mix: Debt/(Debt+Equity) (%) 80% 50% 80% 50% LCOE €/MWh 31,33 52,47 42,48 79,48 LCOE $/MWh 37,60 62,96 50,98 95,38 ENEA LCOE $/MWh 38,00 62,00 52,00 94,00IRIS
avg. OCC cost of equity (%) 10% 15% 10% 15% cost of debt (%) 6% 8% 6% 8% Financing mix: Debt/(Debt+Equity) (%) 80% 50% 80% 50% LCOE €/MWh 28,60 52,44 37,85 64,27 LCOE $/MWh 34,32 62,93 45,42 77,12 ENEA LCOE $/MWh 36,00 56,00 50,00 83,00 2000€/Kwe 3500€/Kwe 2000€/Kwe 3500€/Kwe debt-equity ratio,
tax rate,
plant capacity factor
It is worth to be highlighted that the LCOE calculation from INCAS may be based on Free Cash Flows to the shareholders, or on Unlevered Cash Flows to the firm. The former are calculated as the net cash flows to the shareholders investors, as follows:
(-) SHAREHOLDERS’ INVESTMENT ON CAPITAL EXPENDITURES (+) EBIT
(+) DEPRECIATION (-) TAX
(-) INTEREST EXPENSES (+) INTEREST EARNINGS
(-) DEBT PRINCIPAL AMORTIZATION (=) FREE CASH FLOWS
We consider the investment cost share on total capital expenditures, that is born by shareholders, based on the financing mix assumption. We split the cash inflows in order to retain only the specific earnings of shareholders: i.e. we subtract taxes and interest expenses + debt principal obligations that represent debt-holders’ earnings. The resulting cash flows are called “cash flows to the shareholders” or “free cash flow”.
Unlevered Cash Flows represent the net cash flows before any debt obligations (interest expenses and principal repayment). Shareholders and Lenders (i.e. Banks) are considered as a whole investor group. Thus, the NPV calculation consider all the net cash inflows that come from the , before the distribution between the two different investor categories of their specific earnings (debt interest and principal to lenders; free cash flows to shareholders).
Essentially, NPV is calculated on the operating income generated by the (cash flow from operations).
(-) CAPITAL EXPENDITURES (+) EBIT
(+) DEPRECIATION (-) TAX ON EBIT
(=) UNLEVERED CASH FLOWS TO THE FIRM
If NPV calculation is based on unlevered cash flows, high consistency is found between INCAS’ results and ENEA’s, as shown in Table 9.4 above.
This means that the LCOE calculation methodology which determines the
“levelized”, all lifetime averaged, cost of electricity (able to break-even all incurred costs) used by ENEA, is somewhat equivalent to Unlevered Cash Flow calculation in INCAS.
Otherwise, where NPV calculation is based on the Free Cash Flows, an higher LCOE value will come out due to the specific distribution criteria of the earnings between the two different investors categories. Assumptions about debt amortization, dividend payout, etc. may be more or less in favour to one of the two categories and in particular, may be more or less “efficient” for shareholders.
If LCOE from Free Cash Flows is higher than from Unlevered Cash Flows, this is an indicator of a “not efficient” agreement for shareholders toward lenders. Such an agreement may translate in a early debt and interest repayment in spite of shareholders remuneration, with a shift forward of cash inflows for shareholders. In a few words, LCOE that breaks even the whole investor group may or may not satisfy the shareholders group, depending on the cash flows distribution agreement between the two investors’ categories.
Further explanations about these aspects of INCAS calculation capabilities are given in more detail in the report expected to be contributed by POLIMI.
Acknowledgements
Acknowledgements are due to Sara Boarin from Polytechnic of Milano, for her contribution on LCOE calculations with INCAS and related comments reported in the Appendix above.