Research Article
Alpha-Synuclein Preserves Mitochondrial Fusion and Function in
Neuronal Cells
Gaia Faustini
,
1Elena Marchesan,
2Laura Zonta,
2Federica Bono,
3Emanuela Bottani,
1Francesca Longhena
,
1Elena Ziviani,
2Alessandra Valerio,
1and Arianna Bellucci
1,3 1Department of Molecular and Translational Medicine, University of Brescia, Viale Europa, 11, 25123 Brescia, Italy 2Department of Biology, University of Padova, Via Ugo Bassi, 58b, 35131 Padova, Italy3Laboratory of Preventive and Personalized Medicine, University of Brescia, Viale Europa, 11, 25123 Brescia, Italy
Correspondence should be addressed to Arianna Bellucci; [email protected]
Received 23 July 2019; Revised 12 September 2019; Accepted 28 October 2019; Published 23 November 2019
Guest Editor: Roberta Cascella
Copyright © 2019 Gaia Faustini et al. This is an open access article distributed under the Creative Commons Attribution License, which permits unrestricted use, distribution, and reproduction in any medium, provided the original work is properly cited.
Dysregulations of mitochondria with alterations in trafficking and morphology of these organelles have been related to Parkinson’s disease (PD), a neurodegenerative disorder characterized by brain accumulation of Lewy bodies (LB), intraneuronal inclusions mainly composed of α-synuclein (α-syn) fibrils. Experimental evidence supports that α-syn pathological aggregation can negatively impinge on mitochondrial functions suggesting that this protein may be crucially involved in the control of mitochondrial homeostasis. The aim of this study was to assay this hypothesis by analyzing mitochondrial function and morphology in primary cortical neurons from C57BL/6JOlaHsdα-syn null and C57BL/6J wild-type (wt) mice. Primary cortical neurons from mice lackingα-syn showed decreased respiration capacity measured with a Seahorse XFe24 Extracellular Flux Analyzer. In addition, morphological Airyscan superresolution microscopy showed the presence of fragmented mitochondria while real-time PCR and western blot confirmed altered expression of proteins involved in mitochondrial shape modifications in the primary cortical neurons of α-syn null mice. Transmission electron microscopy (TEM) studies showed that α-syn null neurons exhibited impaired mitochondria-endoplasmic reticulum (ER) physical interaction. Specifically, we identified a decreased number of mitochondria-ER contacts (MERCs) paralleled by a significant increase in ER-mitochondria distance (i.e., MERC length). These findings support that α-syn physiologically preserves mitochondrial functions and homeostasis. Studyingα-syn/mitochondria interplay in health and disease is thus pivotal for understanding their involvement in PD and other LB disorders.
1. Introduction
The pathological aggregation of α-synuclein (α-syn) and
its deposition in proteinaceous inclusions named Lewy bodies (LB) is the key pathological hallmark of LB disorders such as Parkinson’s disease (PD). This is the most common neurodegenerative movement syndrome and is character-ized by a progressive loss of dopaminergic neurons of the nigrostriatal system.
The aggregation of pathologicalα-syn is thought to be the
major agent of PD pathophysiology [1], but mitochondrial
deficits have been largely described as crucial pathogenic
events in the pathogenesis of PD [2]. Indeed, a bidirectional
interplay betweenα-syn and mitochondrial dysfunction has
been described, sinceα-syn aggregates may negatively impinge
on mitochondrial homeostasis and dynamics, while
mito-chondrial dysfunctions severely affect α-syn deposition [3].
It has been reported that a fraction of soluble α-syn
directly interacts with mitochondria-associated endoplas-mic reticulum (ER) membranes (MAM) [4], influencing
mitochondrial fusion andfission. Interestingly, α-syn
aggre-gation produces mitochondrial fragmentation or mitochon-drial respiration failure and death in cell-based models of PD [5–7]. Furthermore, mitochondrial protein import and
protein degradation may impact onα-syn and mitochondrial
physiological functions, but their reciprocal modulation is still to be elucidated [8]. On the other hand, a protective role ofα-syn was identified in neurons exposed to oxidative stress
Volume 2019, Article ID 4246350, 11 pages https://doi.org/10.1155/2019/4246350
[9], while the effect of several neurotoxins on mitochondria deficiency is thought to be mediated, at least in part, by
α-syn aggregation [3, 10]. For instance, elevated levels of
α-syn promote the toxic action of 1-methyl-4-phenyl-1,2,3,6-tetrahydropyridine (MPTP), which inhibits mitochondrial
complex I [11], that is deficient in PD brains [12, 13].
Con-trariwise,α-syn-deficient mice exposed to rotenone exhibited
a pronounced degeneration of dopamine neurons exceeding that observed in wild type (wt) mice [14], even if silencing
α-syn was reported to prevent neuron degeneration in an
in vitro model [15]. These findings fit with the hypothesis
that alterations of α-syn may contribute to bioenergetics
defects inducing mitochondrial dysfunctions and PD onset.
This notwithstanding,α-syn deficiency per se may also
nega-tively impinge on mitochondrial homeostasis [16], support-ing that the metabolism and function of healthy neurons may depend on the expression levels and conformation of
α-syn and on the critical interplay between α-syn and
mito-chondria, with imbalances in their reciprocal modulation leading to neuronal impairment [3].
The aim of this study was to assay the relevance ofα-syn
function on mitochondrial homeostasis by assessing whether primary cortical neurons, produced from C57BL/6JOlaHsd
mice carrying a spontaneous deletion ofα-syn locus (α-syn
null) [17], may present alterations of mitochondrial function and morphology when compared to those of C57BL/6J wt animals.
The Oxygen Consumption Rate (OCR) of cortical
neu-rons from wt or α-syn null mice was evaluated by a
Seahorse-based analysis both in basal condition and after exposure to the Complex I inhibitor rotenone. Mitochondria morphology was studied by using both Airyscan superre-solution microscopy on mito-YFP-transfected neurons and transmission electron microscopy (TEM). Finally, the expression of proteins mediating mitochondria fusion and fission was also evaluated by real-time polymerase chain reaction (PCR) and western blotting (WB). These studies
revealed a reduced mitochondrial respiration of α-syn null
neurons and an increased susceptibility to rotenone adminis-tration. These cells also exhibited an increased mitochondrial fragmentation and alterations in the key proteins
mediat-ing mitochondrial fission and fusion, such as mitofusin
(Mfn1) and the dynamin-like GTPase Opa1. Finally, TEM
studies showed that the primary cortical neurons from
α-syn null mice exhibited a decreased number of mitochon-dria-ER contacts (MERCs) and a significant increase in ER-mitochondria distance.
Our findings strongly support that, by orchestrating
mitochondrial fusion and functions and preserving MERCs,
α-syn physiologically acts as a determining regulator of
mito-chondrial homeostasis.
2. Materials and Methods
2.1. Animals. C57BL/6J wt (Charles River, Wilmington, MA) and C57BL/6JOlaHsd (Harlan Olac Bicester, UK) mice were bred in our animal house facility at the Department of Molecular and Translational Medicine of University of Bre-scia, BreBre-scia, Italy. Animals were maintained under a 12 h
light-dark cycle at a room temperature (rt) of 22°C and had
ad libitum food and water. All experiments were made in accordance to Directive 2010/63/EU of the European Parliament and of the Council of 22 September 2010 on the protection of animals used. All experimental and surgical procedures for the preparation of primary cortical neuronal cell cultures from 18-day embryos were conformed to the National Research Guide for the Care and Use of Laboratory Animals and were approved by the Animal Research Com-mittees of the University of Brescia (Protocol Permit 719/2015-PR). All achievements were made to minimize ani-mal suffering and to reduce the number of aniani-mals used. 2.2. Primary Cortical Neurons. Primary cortical neurons were dissected from C57BL/6J wt control mice and
C57BL/6JO-laHsd α-syn null mice, carrying a spontaneous deletion
of theα-syn locus [17], at embryonic day 18 according to
pre-viously described protocols [18]. After dissociation with Accumax (Sigma-Aldrich, Milan, Italy), the single cells were resuspended in a Neurobasal medium (Thermo Fisher Sci-entific, Massachusetts, USA) containing 100 μg/ml
penicil-lin, 100μg/ml streptomycin (Sigma-Aldrich, Milan, Italy),
2 mM glutamine (EuroClone, Milan, Italy), and 1% B27 sup-plement (Thermo Fisher Scientific) and then centrifuged. Cell counts and viability assays were performed using the Trypan Blue exclusion test. Neurons were seeded onto glass coverslides in 24-well plates for imaging analyses, Seahorse XFe24-well plates for energetic analyses, 24-well plates for
TEM analyses or Petri dishes coated with 10-12μg/ml
poly-D-lysine for quantitative analyses. Cells were maintained at
37°C under a humidified atmosphere of 5% CO2in the
Neu-robasal medium for 8-10 days in vitro (DIV).
2.3. Cortical Neuron Respirometry Analysis. Seahorse XF Cell Culture Microplates (Seahorse Biosciences, Agilent Technologies, USA) were used to seed 45,000 cortical neu-rons per well. At day 8, cells were treated with 100 nM rote-none, which was directly added in the cell culture media for 1 h and analyzed the following day. The medium was replaced with freshly prepared Seahorse XF Base Media (25 mM glucose, 0.25 mM sodium pyruvate, and 1 mM
L-glutamine, pH 7.4) in a non-CO2incubator for 1 h prior to
the assay, then loaded on a Seahorse XF24 Extracellular Flux Analyzer (Seahorse Biosciences). The XF Cell Mito Stress Test (Agilent technologies) was performed, after 3 cycles of
basal condition, sequentially injecting 1μM oligomycin,
0.5μM carbonyl
cyanide-4-(trifluoromethoxy)phenylhydra-zone (FCCP), and 0.5μM rotenone plus 0.5 μM antimycin
A. Oxygen Consumption Rate and Extracellular Acidifica-tion Rate (ECAR) were measured every three cycles of 3 min mix after the injection.
Normalization was performed by using the Bio-Rad DC™ protein assay kit (Bio-Rad Laboratories, California, USA).
Basal respiration was measured as the last rate before the first injection minus the nonmitochondrial respiration rate deriving from the rotenone/antimycin injection. Maximal respiration was considered the maximum rate measurement after the FCCP injection minus the nonmitochondrial respi-ration rate. The ATP-linked respirespi-ration was calculated as the
subtraction of the last measurement before oligomycin injec-tion and the minimum rate after oligomycin injecinjec-tion. 2.4. Mitochondrial Isolation and Seahorse Analysis. Liver, cortex, and midbrain tissues were explanted from
two-month-old mice after cervical dislocation. Afterfive washes
with MIB1 buffer (210 mM D-mannitol, 70 mM sucrose, 5 mM HEPES, 1 mM EGTA and 0.5% free fatty acid BSA), tissues were homogenate and centrifuged at 600g for 10 min
at 4°C. The supernatant was then centrifuged at 7000g for
10 min at 4°C. After washing the pellet with MIB1 by
centri-fugation at 7000g for 10 min at 4°C, the pellet was
resus-pended in MAS1 (220 mM D-mannitol, 70 mM sucrose, 2 mM HEPES, 1 mM EGTA, 0.2% free fatty acid BSA,
10 mM KH2PO4, 5 mM MgCl2, 10 mM glutamate, 5 mM
malate, and 10 mM succinate, pH 7.2).
The total mitochondrial extract was quantified by using
the Bio-Rad DC™ protein assay kit and 7 μg per well was
loaded in the 24-well Seahorse plate and centrifuged at
600g for 20 min at 4°C.
The XF Cell Mito Stress Test was performed, after one cycle of basal condition, sequentially injecting 4 mM ADP, 2.5μg/ml oligomycin, 4 μM FCCP, and 4 μM rotenone plus 4μM antimycin A.
Basal respiration was measured as the first basal rate
minus the nonmitochondrial respiration rate deriving from the rotenone/antimycin injection. State III was calculated as the measurement after the ATP injection minus the
nonmi-tochondrial respiration rate, State IV0 as the measurement
after oligomycin minus the last rate, and State IIIu as the
measurement after FCCP injection minus the last rate. 2.5. Mito-Yellow Fluorescent Protein (YFP) Transfection and
Immunofluorescence Staining. For imaging analysis, 80,000
primary cortical neurons were seeded onto
poly-D-lysine-coated glass coverslides in 24-well plates. At 8 days of di
ffer-entiation, neurons were transfected with pEYFP-Mito (Cata-log #6115-1, Clontech) by using Lipofectamine 3000 (Life Technologies, California, USA), according to the manufac-turer’s instructions.
Fixed neurons were permeabilized in PBS 0.1 M supple-mented with 20% methanol and 0.1% Triton X-100, incu-bated for 1 h at rt in blocking solution (2% Normal Goat Serum (NGS), 3% Bovine Serum Albumin (BSA), and 0.1% Triton-X100 in PBS 0.1 M), and then with the primary anti-body (Microtubule-Associated Protein 2 (MAP-2), Merck Millipore, Burlington, Massachusetts, USA) in blocking
solu-tion overnight at 4°C. Neurons were washed with 0.1% Triton
X-100 PBS 0.1 M and incubated with the
fluorochrome-conjugated secondary antibody (goat anti-mouse cy3, Jack-son ImmunoResearch, Cambridge, UK) in 0.1% Triton X-100 PBS 0.1 M plus 1 mg/ml BSA for 1 h at rt. After three washes in 0.1% Triton X-100 PBS, cells were mounted onto superfrost slides using a VECTASHIELD mounting medium
forfluorescence (Vector Laboratories, Burlingame, CA) and
observed by means of a Zeiss confocal laser microscope LSM 880 (Carl Zeiss, Oberkochen, Germany) with Airyscan
superresolution andz-stack with the height of the sections
scanning≅ 1 μm. Images (1024 × 1024 pixels) were then
reconstructed using Zen lite 2.3 (Carl Zeiss).
2.6. Quantification of Mitochondrial Morphology. The num-ber of mitochondria and the total area of mitochondria per neuron were analyzed by using the macro of ImageJ Soft-ware designed by Dagda et al. [19] with minor modification to differentially analyze cell bodies and dendrites. All the
z-stack images were processed to maximum intensity
projec-tion. The acquisition parameters during confocal imaging were maintained constant for all the image settings used for the analysis.
The interconnectivity between mitochondria was ana-lyzed using the mitochondrial network analysis (MiNA) toolset [20].
2.7. Real-Time PCR. Total RNA was extracted from wt and α-syn null cortical neurons using an RNA extraction kit (RNeasy Mini Kit, Qiagen, Hilden, GE) according to the manufacturer’s recommendations. Two micrograms of RNA was retrotranscribed by using a QuantiTect Reverse
Transcription Kit (Qiagen) according to the manufacturer’s
instructions. Real-time PCR was performed by using a SYBR Green Master Mix (Applied Biosystems, Foster City, USA) and the following primer pairs: Mfn1 for ACAAGCTTGCT GTCATTGGG Mfn1 rev TCGACACTCAGGAAGCAGTT; Mfn2 for ATATAGAGGAAGGTCTGGGCCG, Mfn2 rev CCGCATAGATACAGGAAGAAGGG; Opa1 rev GTCATT GTCGGAGCAGGAATC, Opa1 for TTCACTAAGGATTG GCAGACTT; and GAPDH for TCAACAGCAACTCCAC TCTT, GAPDH rev CCAGGGTTTCTTACTTACTCCTTGG. The ViiA7 Real-Time PCR system (Life Technologies,
Grand Island, NY, USA) was used for 40 cycles of 95°C for
15 s and 60°C for 1 min. mRNA expression was normalized
to glyceraldehyde 3-phosphate dehydrogenase (GAPDH) gene expression.
2.8. Western Blot Analysis. Total proteins were extracted with a Radioimmunoprecipitation Assay (RIPA) buffer made up with 50 mM Tris-HCl pH 7.4, 150 mM NaCl, NP-40 1%, sodium deoxycholate 0.1%, sodium dodecyl sulfate (SDS)
0.1%, 1 mM NaF, and 1 mM NaVO4 plus complete
prote-ase inhibitor mixture (Roche Diagnostics, Mannheim, Ger-many). Protein concentration in the samples was measured by using the Bio-Rad protein assay kit. Equal amounts of
proteins (30μg) were run on 10% polyacrylamide gels and
transferred onto polyvinylidenefluoride (PVDF) membrane.
Densitometric analysis of the bands was performed by using ImageJ software and all bands were normalized to Tom20 levels as a control of equal loading of samples in the total pro-tein extracts. For densitometry analysis of bands, each exper-imental condition was performed in quadruplicate and the resulting data were subjected to statistical analysis. The pri-mary antibodies used for western blot analysis were the fol-lowing: Opa1 (1 : 1000; Abcam; ab42364), Mfn2 (1 : 1000; Abnova; H00009927-M03) and Tom20 (1 : 1000; Santa Cruz; sc-11415). Secondary antibodies used were sheep anti-mouse or donkey anti-rabbit HRP (GE Healthcare, Chicago, USA).
2.9. Transmission Electron Microscopy Ultrastructural Morphological Analysis. For ultrastructural morphological
analysis, cortical neurons werefixed with Immunofix
(BioOp-tica, Milan, Italy) for 1 hour. After rinsing in 0.1 M cacodylate
buffer with 1% tannic acid, samples were postfixed in 1 : 1 2%
OsO4 and 0.2 M cacodylate buffer for 1 h. Samples were
rinsed, dehydrated in ethanol and embedded in Epon resin. Ultrathin sections were imaged on a Tecnai-20 electron microscope (Philips-FEI).
2.10. Analysis of TEM Mitochondria-ER Contacts. The number of mitochondria-ER contacts has been analysed for ultrastructure in a minimum of 250 contacts per condi-tion. Morphometric measurements were carried out using ImageJ. For calculations of the mitochondria-ER distance,
n > 5 mitochondria per image in 60 images per condition
were considered and a minimum distance of ER located in a 40 or 10 nm radius from the considered mitochondria was computed.
3. Results and Discussion
The aggregation of α-syn has been repeatedly associated
with mitochondrial dysfunctions [16], but the
physiologi-cal role of α-syn in mitochondrial function still needs to
be elucidated in order to achieve extensive comprehension of α-syn/mitochondria interplay.
To probe whether α-syn can physiologically influence
mitochondrial function, we examined both mitochondrial respiration and morphology in primary cortical neurons
derived from C57BL/6J wt and C57BL6JOlaHsd α-syn
null mice.
In particular, mitochondrial respiration of murine
pri-mary cortical neurons of wt and α-syn null mice was
analyzed by using the Seahorse XFe24 Extracellular Flux Analyzer measuring the OCR and the ECAR (Figure 1(a)). The ATP synthase inhibitor oligomycin, the mitochondrial oxidative phosphorylation uncoupler FCCP and the Com-plex I inhibitor rotenone plus the comCom-plex III inhibitor antimycin A were sequentially injected to evaluate basal respiration, ATP production and maximal respiration of primary neuronal cells.
Interestingly, we found thatα-syn null neurons exhibited
a significant decrease in basal respiration when compared to that of wt control cells. Maximal respiration (i.e., mito-chondrial energetic reserve capability) and ATP
produc-tion were also reduced in the cortical neurons lackingα-syn
(Figure 1(b)). Thesefindings support that the absence of
α-syn compromises the OCR both in basal conditions and in response to FCCP, which, by stimulating the respiratory chain to run at maximum capacity, allows estimating the energetic reserve capability of the cell.
By analyzing OCR, we also found that theα-syn null
neu-rons, which were subjected to 1 h rotenone pretreatment, exhibited a significant decrease in basal respiration, maximal respiration and ATP production after the 24 h washout,
when compared to untreatedα-syn null neurons. This
find-ing is in line with evidence supportfind-ing thatα-syn-deficient
mice are more sensitive to rotenone and show a more marked
degeneration of dopaminergic neurons upon exposure to this neurotoxin (Dauer et al., PNAS, 2002). Conversely, the OCR profile of wt neurons was not affected by 1 h rotenone pre-treatment, supporting that these cells displayed a better resil-ience within our experimental paradigm. This observation
supports that in α-syn null neurons, the functional activity
of mitochondria resulted in more vulnerability to the 1 h Complex I inhibition achieved by rotenone pretreatment.
We examined the ECAR profile, an indirect but reliable
index of cellular glycolytic rate [21], in basal conditions and in response to mitochondrial respiratory chain inhibitors in
wt andα-syn null neurons (Figure 1(a)). We found that the
absence of α-syn reduced the basal and
oligomycin-stimulated ECAR profile when compared to that of wt neu-rons, regardless of rotenone pretreatment.
While rotenone is known to inhibit neuronal OCR and enhance ECAR when measured during its infusion [22], we
found that 1 h rotenone pretreatment per se did not affect
ECAR and OCR in wt neuronal cells. This could be explained by the recovery of neuronal bioenergetic capacity during the 24 h washout period. The combined evaluation of the OCR and ECAR parameters in basal conditions, as shown in the energy map (Figure 1(a)), indicated that wt neurons have
higher bioenergetics capacity, whereas α-syn null neurons
have a more quiescent metabolic phenotype.
Finally, we analyzed mitochondrial OCR also in mito-chondria purified from liver, cortices, and midbrain of adult
wt andα-syn null mice, but we did not detect any difference
in respiration or ATP production (Figures 1(c) and 1(d)).
This may possibly be ascribed to the fact that α-syn is
enriched in neurons. Therefore, α-syn absence would not
affect mitochondrial respiration in peripheral tissues and its effect may be hardly detectable in brain mitochondrial preparations due to the presence of mitochondria deriving from glial cells, which do not normally express the protein
[23–25]. Contrariwise, the expression of α-syn in neurons is
elevated, especially at synaptic sites [26], where mitochondria
are also abundant [27]. This supports thatα-syn may affect
mitochondrial homeostasis and impinge on respiration exclusively in neuronal cells.
Collectively, thesefindings support that α-syn null
neu-rons exhibit a reduced respiration and are also less energetic,
thus supporting thatα-syn plays a relevant role in
orchestrat-ing mitochondrial functions and energy production.
It has been found that, in the presence of α-syn
aggre-gates, neurons show fragmented mitochondria [28, 29].
Considering that α-syn aggregation may mimic a loss of
function of the protein [30], we analyzed the morphology of mitochondria in the MAP-2-immunolabelled cortical
neurons from wt andα-syn null mice which had been
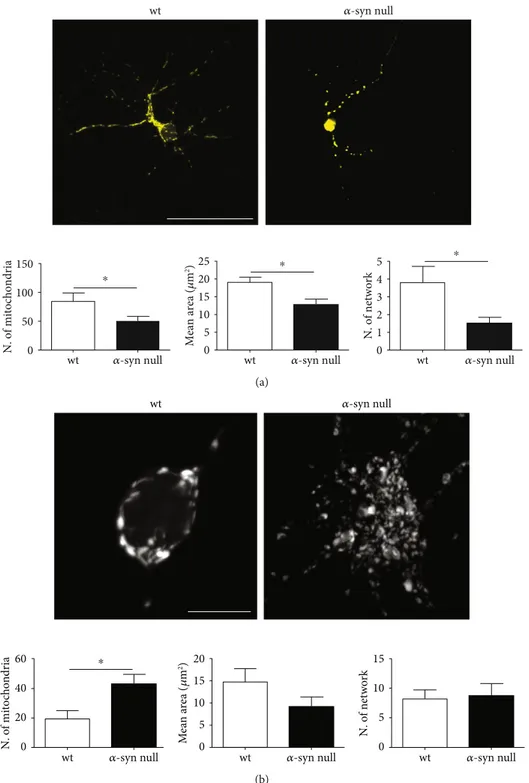
trans-fected with mito-YFP construct (Supplementary Figure 1) to discriminate mitochondria within the cell soma and dendrites (Figure 2). These areas were separately examined, as dendrites were acquired by standard confocal microscopy, while cell somas were acquired by Airyscan superresolution microscopy to allow a better visualization of mitochondrial morphology.
By analyzing the dendrites of α-syn null neurons, we
OCR 0 200 400 600 800 Oligomycin FCCP Time (min) 1,38 9,90 18,46 27,12 35,65 44,21 52,84 61,40 69,93 78,59 87,15 95,68 pmol/min/ 𝜇 g Rotenone+ actimycin 1,38 9,90 18,46 27,12 35,65 44,21 52,84 61,40 69,93 78,59 87,15 95,68 ECAR 0 20 40 60 80 100 Time (min) pH/min/ 𝜇 g Oligomycin FCCP Rotenone+ actimycin 0 100 200 300 400 500 0 20 40 60 OCR Aerobic Energetic Glycolytic Quiescent ECAR wt
wt rotenone pretreated 𝛼-syn null𝛼-syn null rotenone pretreated
(a) Basal respiration 0 50 100 150 200 250 ⁎⁎ ⁎⁎⁎ ⁎ pm ol /m in /𝜇 g Untreated Rotenone pretreated Maximal respiration 0 100 200 300 400 500 ⁎⁎⁎ ⁎⁎ ⁎ Untreated Rotenone pretreated p m o l/min/ 𝜇 g ATP-linked respiration 0 50 100 150 200 250 Untreated Rotenone pretreated ⁎⁎⁎ ⁎⁎⁎ ⁎⁎ p m o l/min/ 𝜇 g wt 𝛼-syn null (b) 0 100 2 6 10 14 19 24 200 300 400 500 Time (min) ADP FCCP Rotenone+ actimycin OC R Liver Oligomycin 0 100 2 6 10 14 19 24 200 300 400 500 Time (min) ADP FCCP Rotenone+ actimycin OCR Cortex Oligomycin 2 6 10 14 19 24 0 200 400 600 Time (min) OCR Midbrain ADP FCCP Rotenone+ actimycin Oligomycin wt 𝛼-syn null (c) Figure 1: Continued.
exhibited a reduction in the mean area when compared to those of wt neurons (Figure 2(a)). This is in line with previ-ous studies showing increased mitochondrial fragmentation
afterα-syn silencing in HeLa cells [31]. Moreover, the
num-ber of interconnections between mitochondria, analyzed by using the MiNA toolset, was also significantly decreased in
α-syn null neurons. The reduction of mitochondrial contacts
and mitochondrial mean area may be indicative of
mito-chondrial fission/reduced fusion [32, 33] occurring in the
absence ofα-syn.
Interestingly, when we analyzed mitochondria number
and morphology in the cell bodies, we found thatα-syn null
neurons exhibited an increased number of mitochondria, whose mean area only showed a trend toward size reduction, which however did not show significant results with respect
to wt cells (Figure 2(b)). Moreover, the absence of α-syn
did not result in a decrease of mitochondria interconnections
in cell bodies. Thesefindings suggest that α-syn null neurons
may present an impairment of mitochondrial transport along
processes, which may show mitochondrialfission as a
conse-quence of this process [34, 35].
Mitochondrial fragmentation may be associated with
changes in the expression of fusion and fission proteins
[35]. While mitochondrial fusion is considered a prosurvival
mechanism [36],fission/fragmentation is often an index of
mitochondria damage.
We thus analyzed the expression levels of genes involved in mitochondrial shape modifications: Mfn1, Mfn2, Opa1,
and Drp1 (Figure 3(a)). In the cortical neurons of α-syn
null mice, we observed decreased levels of Mfn1, which is involved in the fusion of the outer mitochondrial membrane,
but no changes in the expression of thefission protein Drp1
or in Opa1 and Mfn2. Thisfinding supports that, by
mod-ulating Mfn1 expression, α-syn may ensure mitochondrial
fusion but does not seem to affect proteins controlling the
fission, stability, or formation of these organelles. This is
in line with evidence indicating that α-syn aggregation
inhibits mitochondrial fusion through a Drp1-independent pathway [37].
The absence of Mfn2 changes was confirmed by western blot analysis (Figure 3(b)), which showed an interesting increase in the ratio between the short and long forms of Opa1, which is crucially involved in control of mitochondrial morphology. This observation supports that the absence of
α-syn can promote mitochondrial fission also by reducing
long Opa1, which is relevant for conferring fusion compe-tences [38]. On the other hand, an increased short Opa1 gen-eration can promote fragmentation [39].
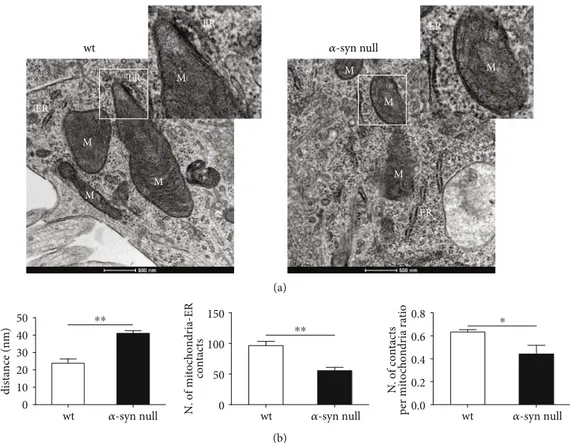
Since the presence of wtα-syn was previously observed
in MAM [4] and mitofusins are known to be involved in mediating MERCs [40–42], we also analyzed mitochondria-ER interactions by TEM (Figure 4). Indeed, Mfn2 is known to have a key role in the mitochondria-ER tethering but is also known to form homo- or heterodimerization with
Mfn1. By localizing to MAM [4], α-syn absence could
modify Mfn2 localization, thus consequently influencing
mitochondria-ER interaction. The results of this part of the
study showed a decreased number of MERCs in the α-syn
null neurons when compared to that of wt neurons that still significantly decreased when normalized on the number of mitochondria. In parallel, we observed an increased dis-tance between mitochondria and the ER. MERCs are rele-vant for ensuring mitochondrial biogenesis, dynamics, and
inheritance and Ca2+ release from ER at MERC controls
Liver 100 0 200 300 400 OCR
Basal State III State IV0 Stato IIIu 100 0 200 300 400 OCR
Basal State III State IV0 Stato IIIu Cortex 100 0 200 300 400 OCR
Basal State III State IV0 Stato IIIu wt
𝛼-syn null
Midbrain
(d)
Figure 1: Seahorse-based mitochondrial respiration assay on primary cortical neurons or mitochondria purified from wt or α-syn null mice. (a) The two graphs show time-dependent changes in OCR and ECAR measured sequentially injecting oligomycin, FCCP, and rotenone plus antimycin A on primary cortical neurons of wt andα-syn null mice in basal conditions or after rotenone exposure. Basal OCR and ECAR values (before oligomycin injection) were plotted in the energy map to illustrate the difference in the cell metabolic profile. (b) Basal respiration (first injection minus the rotenone/antimycin injection), maximal respiration (rate after the FCCP injection minus the nonmitochondrial respiration rate), and ATP production (measurement before oligomycin injection and after the oligomycin injection) showed a decreased respiration of α-syn null cortical neurons that are significantly affected by rotenone treatment. (c) OCR of mitochondria purified from the liver, cortices, and midbrains was measured sequentially injecting ADP, oligomycin, FCCP, and rotenone plus antimycin A. Note the absence of changes between C57BL/6J wt and C57BL/6JOlaHsdα-syn null mice. (d) The basal respiration, the State III, the State IV0, and the State IIIudid not show differences in the OCR of liver, cortex, and midbrain extracts between wt and α-syn null mice.∗P < 0:05, ∗∗P < 0:01, and ∗∗∗P < 0:001, two-way ANOVA+Bonferroni’s postcomparison test. Data are presented as mean ± standard error of the mean (SEM) (n = 12).
mitochondrial function, division, and regulation of
apopto-sis [43]. Our data confirm and extend previous studies
showing alterations in MAM structure due toα-syn
muta-tions [4] and the disruption of ER-mitochondrial contacts
caused by α-syn overexpression [44], which may coincide
with a loss of α-syn function. Further research is required
to assess whether the reduction of MERCs and increased
mitochondria-ER distance observed in the α-syn null mice
might play a causal role in the altered mitochondrial func-tion and dynamics.
0 5 10 15 20 25 Mean area ( 𝜇 m 2) 𝛼-syn null wt ⁎ 0 50 100 150 N. of mitochondria 𝛼-syn null wt ⁎ 0 1 2 3 4 5 N. of network 𝛼-syn null wt ⁎ wt 𝛼-syn null (a) 0 5 10 15 N . of n et w or k 𝛼-syn null wt 0 20 40 60 N. o f mi to ch o n dr ia 𝛼-syn null wt ⁎ 0 5 10 15 20 𝛼-syn null wt M ean are a ( 𝜇 m 2) wt 𝛼-syn null (b)
Figure 2: Mitochondrial morphology in mito-YFP transfected primary cortical neurons of wt and α-syn null mice. (a) Representative images of maximum intensity projections of primary cortical neurons from wt andα-syn null mice transfected with mito-YFP construct at 8 DIV. The morphological analysis showed decreased number of mitochondria exhibiting also reduction in the mean area and in the number of interconnections in those of α-syn null mice when compared to wt neurons. (b) Maximum intensity projection of Airyscan superresolution microscopy showed an increased number of mitochondria in the cell body ofα-syn null neurons which did not exhibit reductions in the mean area or in their interconnections when compared to those of wt mice.∗P < 0:05, unpaired two-tailed t-test. Data are presented as mean ± SEM (n = 30). Scale bar: a = 50 μm and b = 10 μm.
4. Conclusions
Collectively, the results of this study support thatα-syn plays
a physiological and essential role in the control of mitochon-drial respiration capacity and homeostasis.
Alpha-synuclein aggregation and mitochondrial defects are believed to be central in the pathogenesis of neurodegen-eration in PD [3, 10, 45, 46]. This is clearly reinforced by the
fact that mutations of α-syn or mitochondria-associated
genes can cause the onset of familial early-onset parkinson-ism [47, 48]. Interestingly, recent evidence pointed out that
α-syn localizes in and affects MAM function [4, 16, 49] and
that the N-terminus ofα-syn, a region exhibiting high affinity
for biological membranes [50], can control mitochondrial
membrane permeability [51]. Moreover, α-syn can interact
with Complex I modulating its activity [52], while α-syn
overexpression induces mitochondrialfission by interacting
with mitochondrial membranes [5]. The α-syn-mediated
control of mitochondrial homeostasis, which is not altered by the A30P variant, is selectively disrupted by the A53T mutation [45]. Consistently, A53T transgenic mice show a
marked reduction of the Na+-Ca2+ exchanger 3 (NCX3)
accompanied by mitochondrial Ca2+overload, events which
have been proposed to be central for neurodegeneration of dopaminergic neurons in this mouse line [53]. These studies,
strongly supporting a role for α-syn in mitochondrial
homeostasis, fail to provide information on the physiological
role of α-syn on morpho-functional aspects of
mitochon-drial biology. In line with the Complex I deficit previously
described by Devi and colleagues [52], electron transport chain impairment, with no changes in mitochondrial
num-ber, has been demonstrated in mice lackingα-syn [54].
Nev-ertheless, a complete characterization of the physiological effects of α-syn on mitochondrial morphology and activity in pure neuronal preparations have never been investigated before, with the exception of a single study that however failed to detect differences in mitochondrial bioenergetics between
wt andα-syn ko mice [55].
Remarkably, our results are partially in line with those described by Pathak et al. as when we analyzed mitochondria
purified by cortical tissues, we also failed to detect functional
differences. Differently from their findings on primary
hip-pocampal neurons prepared from α-syn ko pups, when we
analyzed primary cortical neurons from α-syn null mouse
embryos, we found that they exhibited significant reduction in basal and maximal respirations as well as ATP production when compared to those from wt mouse embryos. Moreover,
α-syn null neurons resulted in more vulnerability to rotenone
treatment, supporting that the effect of this toxin is
influ-enced by the presence ofα-syn. The functional impairments
were accompanied by marked reduction of MERCs as well as by mitochondrial morphology alterations supportive of the occurrence of fragmentations within dendrites and reduction
of mitochondria transport. Remarkably, the expression of
α-Mfn1 0.0 0.5 1.0 1.5 Relative expression 𝛼-syn null wt wt 𝛼-syn null 𝛼-syn null wt wt 𝛼-syn null Mfn2 0.0 0.5 1.0 1.5 Relative expression Opa1 0.0 0.5 1.0 1.5 Relative expression Drp1 0.0 0.5 1.0 1.5 Relative expression ⁎ (a) 𝛼-syn null wt wt 𝛼-syn null Opa1 Mfn2 Tom20
wt 𝛼-syn null S-Opa1/l-Opa1
0.0 0.5 1.0 1.5 2.0 Expression levels ⁎ Mfn2 0.0 0.5 1.0 1.5 Expression levels (b)
Figure 3: Expression levels of mitochondrial proteins involved in shape modification. (a) Relative expression of Mfn1, Mfn2, Opa1, and Drp1 was evaluated by using real-time PCR on primary cortical neuron extracts of wt andα-syn null mice. Note the statistically significant reduction of Mfn1 in the primary cortical neurons fromα-syn null mice. (b) Western blot analysis revealed increased ratio between the short and long forms of Opa1 in the absence ofα-syn which did not exhibit alterations in the levels of Mfn2.∗P < 0:05, unpaired two-tailedt-test. Data are presented as mean ± SEM (n = 8).
syn can vary between diverse brain areas and different neuronal populations [56], thus supporting that the pro-tein may differentially impinge on mitochondrial functions in hippocampal or cortical neurons. Therefore, the
discrep-ancies between ourfindings and those described by Pathak
et al. can be the result of different factors: (a) we analyzed dif-ferent neuronal subpopulations (whole cortices vs.
hippo-campi); (b) these were prepared at different time points
(embryos vs. pups); and (c) we used different strains and
experimental models (C57BL/6J α-syn null vs. C57BL/6N
α-syn ko mice).
Notably, our results sound in agreement with multiple
evidence supporting that α-syn overexpression and
muta-tions can influence mitochondrial homeostasis and fragmen-tation as well as ER-mitochondrial interaction [4, 5, 46, 52]. However, the physiological effect α-syn on mitochondria function, morphology, and interaction with ER had been only partially addressed up to date [4, 5, 37, 57]. Our results
support thatα-syn can physiologically affect the
mitochon-drial functional profile, preserves mitochondrial fusion and
transport, and contributes to ensure MERCs in neuronal
cells. When considering the central role thatα-syn
aggrega-tion plays in PD, these observaaggrega-tions support that the absence of the protein in C57BL/6JOlaHsd null neurons may mimic the effects derived from α-syn insoluble inclusion formation, which, by sequestering the protein, may reduce its functional
profile [3, 30, 46]. This process may severely alter
mitochon-drial and mitochondria/ER dynamics, thus promoting neu-ronal damage and degeneration.
Data Availability
The datasets used and/or analyzed during the current study are available from the corresponding author on reasonable request.
Conflicts of Interest
The authors declare that there is no conflict of interest regarding the publication of this paper.
Acknowledgments
We are grateful to Fondazione Cariplo (2014-0769 to A.B. and 2016-1006 to A.V.); the University of Brescia (BIO-MANE); MIUR (PNR 2015-2020 PerMedNet); and the
Michael J. Fox Foundation for Parkinson’s Research, NY,
USA (Target Advancement Program, grant ID #10742.01). E.B. was supported by a fellowship by Fondazione Umberto Veronesi. wt 𝛼-syn null wt 𝛼-syn null M M M M M M ER ER ER M ER ER M (a) 0.0 0.2 0.4 0.6 0.8 ⁎ 0 50 100 150 ⁎⁎ 0 10 20 30 40 50 ⁎⁎ 𝛼-syn null
wt wt 𝛼-syn null wt 𝛼-syn null
Mitochondria-ER distance (nm)
N. of mitochondria-E
R
contacts
N. of contacts
per mitochondria ratio
(b)
Figure 4: TEM-based morphological analysis of mitochondria-ER interaction of primary cortical neurons of wt and α-syn null mice. (a) Representative images of TEM showing the mitochondria-ER interactions in primary cortical neurons of wt and α-syn null mice. ER = endoplasmic reticulum; M = mitochondria. Scale bar: 500 nm. (b) The image analysis showed an increased distance between mitochondria and ER, a decreased number of MERCs, and a decreased ratio in the number of contacts per mitochondria inα-syn null neurons when compared to wt neurons.∗P < 0:05 and∗∗P < 0:01, unpaired two-tailed t-test. Data are presented as mean ± SEM (n = 5).
Supplementary Materials
Supplementary Figure 1: representative photomicrographs showing MAP-2-labelled neurons transfected with
mito-YFP construct of wt andα-syn null mice. Scale bar: 20 μm.
(Supplementary Materials)
References
[1] M. Goedert, R. Jakes, and M. G. Spillantini,“The synucleino-pathies: twenty years on,” Journal of Parkinson’s Disease, vol. 7, no. s1, pp. S51–S69, 2017.
[2] F. Gao, J. Yang, D. Wang et al.,“Mitophagy in Parkinson’s dis-ease: pathogenic and therapeutic implications,” Frontiers in Neurology, vol. 8, p. 527, 2017.
[3] G. Faustini, F. Bono, A. Valerio, M. Pizzi, P. Spano, and A. Bellucci,“Mitochondria and α-synuclein: friends or foes in the pathogenesis of Parkinson’s disease?,” Genes, vol. 8, no. 12, p. 377, 2017.
[4] C. Guardia-Laguarta, E. Area-Gomez, C. Rub et al., “α-synu-clein is localized to mitochondria-associated ER membranes,” The Journal of Neuroscience, vol. 34, no. 1, pp. 249–259, 2014. [5] K. Nakamura, V. M. Nemani, F. Azarbal et al.,“Direct mem-brane association drives mitochondrialfission by the Parkin-son disease-associated protein α-synuclein,” Journal of Biological Chemistry, vol. 286, no. 23, pp. 20710–20726, 2011. [6] V. Tapias, X. Hu, K. C. Luk, L. H. Sanders, V. M. Lee, and J. T. Greenamyre, “Synthetic alpha-synuclein fibrils cause mito-chondrial impairment and selective dopamine neurodegenera-tion in part via iNOS-mediated nitric oxide producneurodegenera-tion,” Cellular and Molecular Life Sciences, vol. 74, no. 15, pp. 2851–2874, 2017.
[7] X. Wang, K. Becker, N. Levine et al., “Pathogenic alpha-synuclein aggregates preferentially bind to mitochondria and affect cellular respiration,” Acta Neuropathologica Communi-cations, vol. 7, no. 1, p. 41, 2019.
[8] J. Lautenschager and G. S. Kaminski Schierle,“Mitochondrial degradation of amyloidogenic proteins— A new perspective for neurodegenerative diseases,” Progress in Neurobiology, vol. 181, article 101660, 2019.
[9] S. Menges, G. Minakaki, P. M. Schaefer et al., “Alpha-synu-clein prevents the formation of spherical mitochondria and apoptosis under oxidative stress,” Scientific Reports, vol. 7, no. 1, article 42942, 2017.
[10] M. Zaltieri, F. Longhena, M. Pizzi, C. Missale, P. Spano, and A. Bellucci,“Mitochondrial Dysfunction and -Synuclein Syn-aptic Pathology in Parkinson's Disease: Who's on First?,” Par-kinson’s Disease, vol. 2015, Article ID 108029, 10 pages, 2015. [11] L. K. Song, K. L. Ma, Y. H. Yuan et al.,“Targeted overexpres-sion ofα-Synuclein by rAAV2/1 vectors induces progressive nigrostriatal degeneration and increases vulnerability to MPTP in mouse,” PLoS One, vol. 10, no. 6, article e0131281, 2015.
[12] I. H. Flones, E. Fernandez-Vizarra, M. Lykouri et al., “Neuro-nal complex I deficiency occurs throughout the Parkinson’s disease brain, but is not associated with neurodegeneration or mitochondrial DNA damage,” Acta Neuropathologica, vol. 135, no. 3, pp. 409–425, 2018.
[13] W. D. Parker Jr., J. K. Parks, and R. H. Swerdlow,“Complex I deficiency in Parkinson's disease frontal cortex,” Brain Research, vol. 1189, pp. 215–218, 2008.
[14] W. Dauer, N. Kholodilov, M. Vila et al., “Resistance of α-synuclein null mice to the parkinsonian neurotoxin MPTP,” Proceedings of the National Academy of Sciences of the United States of America, vol. 99, no. 22, pp. 14524–14529, 2002. [15] A. D. Zharikov, J. R. Cannon, V. Tapias et al.,“shRNA
target-ingα-synuclein prevents neurodegeneration in a Parkinson’s disease model,” The Journal of Clinical Investigation, vol. 125, no. 7, pp. 2721–2735, 2015.
[16] C. Guardia-Laguarta, E. Area-Gomez, E. A. Schon, and S. Przedborski,“A new role for α-synuclein in Parkinson’s dis-ease: alteration of ER-mitochondrial communication,” Move-ment Disorders, vol. 30, no. 8, pp. 1026–1033, 2015.
[17] C. G. Specht and R. Schoepfer, “Deletion of the alpha-synuclein locus in a subpopulation of C57BL/6J inbred mice,” BMC Neuroscience, vol. 2, no. 1, p. 11, 2001.
[18] L. Navarria, M. Zaltieri, F. Longhena et al.,“Alpha-synuclein modulates NR2B-containing NMDA receptors and decreases their levels after rotenone exposure,” Neurochemistry Interna-tional, vol. 85-86, pp. 14–23, 2015.
[19] R. K. Dagda, S. J. Cherra 3rd, S. M. Kulich, A. Tandon, D. Park, and C. T. Chu,“Loss of PINK1 function promotes mitophagy through effects on oxidative stress and mitochondrial fission,” Journal of Biological Chemistry, vol. 284, no. 20, pp. 13843– 13855, 2009.
[20] A. J. Valente, L. A. Maddalena, E. L. Robb, F. Moradi, and J. A. Stuart,“A simple ImageJ macro tool for analyzing mitochon-drial network morphology in mammalian cell culture,” Acta Histochemica, vol. 119, no. 3, pp. 315–326, 2017.
[21] J. Zhang, E. Nuebel, D. R. Wisidagama et al., “Measuring energy metabolism in cultured cells, including human plurip-otent stem cells and differentiated cells,” Nature Protocols, vol. 7, no. 6, pp. 1068–1085, 2012.
[22] S. Giordano, M. Dodson, S. Ravi et al.,“Bioenergetic adapta-tion in response to autophagy regulators during rotenone exposure,” Journal of Neurochemistry, vol. 131, no. 5, pp. 625–633, 2014.
[23] D. W. Miller, J. M. Johnson, S. M. Solano, Z. R. Hollingsworth, D. G. Standaert, and A. B. Young, “Absence of α-synuclein mRNA expression in normal and multiple system atrophy oli-godendroglia,” Journal of Neural Transmission, vol. 112, no. 12, pp. 1613–1624, 2005.
[24] H. J. Lee, J. E. Suk, E. J. Bae, and S. J. Lee,“Clearance and depo-sition of extracellular α-synuclein aggregates in microglia,” Biochemical and Biophysical Research Communications, vol. 372, no. 3, pp. 423–428, 2008.
[25] N. Braidy, W. P. Gai, Y. H. Xu et al.,“Uptake and mitochondrial dysfunction of alpha-synuclein in human astrocytes, cortical neurons and fibroblasts,” Translational Neurodegeneration, vol. 2, no. 1, p. 20, 2013.
[26] A. Bellucci, N. B. Mercuri, A. Venneri et al.,“Review: Parkin-son’s disease: from synaptic loss to connectome dysfunction,” Neuropathology and Applied Neurobiology, vol. 42, no. 1, pp. 77–94, 2016.
[27] P. J. Hollenbeck, “Mitochondria and neurotransmission: evacuating the synapse,” Neuron, vol. 47, no. 3, pp. 331–333, 2005.
[28] C. Perier and M. Vila,“Mitochondrial biology and Parkinson’s disease,” Cold Spring Harbor Perspectives in Medicine, vol. 2, no. 2, article a009332, 2012.
[29] J. H. Martinez, F. Fuentes, V. Vanasco et al.,“Alpha-synuclein mitochondrial interaction leads to irreversible translocation
and complex I impairment,” Archives of Biochemistry and Bio-physics, vol. 651, pp. 1–12, 2018.
[30] T. J. Collier, D. E. Redmond Jr., K. Steece-Collier, J. W. Lipton, and F. P. Manfredsson,“Is alpha-synuclein loss-of-function a contributor to Parkinsonian pathology? Evidence from non-human primates,” Frontiers in Neuroscience, vol. 10, p. 12, 2016.
[31] T. Cali, D. Ottolini, A. Negro, and M. Brini, “α-synuclein controls mitochondrial calcium homeostasis by enhancing endoplasmic reticulum-mitochondria interactions,” Journal of Biological Chemistry, vol. 287, no. 22, pp. 17914–17929, 2012.
[32] S. A. Detmer and D. C. Chan,“Functions and dysfunctions of mitochondrial dynamics,” Nature Reviews Molecular Cell Biol-ogy, vol. 8, no. 11, pp. 870–879, 2007.
[33] S. L. Archer,“Mitochondrial dynamics–mitochondrial fission and fusion in human diseases,” The New England Journal of Medicine, vol. 369, no. 23, pp. 2236–2251, 2013.
[34] H. Chen and D. C. Chan, “Mitochondrial dynamics–fusion, fission, movement, and mitophagy–in neurodegenerative dis-eases,” Human Molecular Genetics, vol. 18, no. R2, pp. R169– R176, 2009.
[35] F. Burte, V. Carelli, P. F. Chinnery, and P. Yu-Wai-Man, “Disturbed mitochondrial dynamics and neurodegenerative disorders,” Nature Reviews Neurology, vol. 11, no. 1, pp. 11– 24, 2015.
[36] D. Tondera, S. Grandemange, A. Jourdain et al., “SLP-2 is required for stress-induced mitochondrial hyperfusion,” The EMBO Journal, vol. 28, no. 11, pp. 1589–1600, 2009. [37] F. Kamp, N. Exner, A. K. Lutz et al.,“Inhibition of
mitochon-drial fusion byα-synuclein is rescued by PINK1, Parkin and DJ-1,” The EMBO Journal, vol. 29, no. 20, pp. 3571–3589, 2010.
[38] H. Lee, S. B. Smith, and Y. Yoon,“The short variant of the mitochondrial dynamin OPA1 maintains mitochondrial ener-getics and cristae structure,” Journal of Biological Chemistry, vol. 292, no. 17, pp. 7115–7130, 2017.
[39] T. MacVicar and T. Langer,“OPA1 processing in cell death and disease– the long and short of it,” Journal of Cell Science, vol. 129, no. 12, pp. 2297–2306, 2016.
[40] V. Basso, E. Marchesan, C. Peggion et al.,“Regulation of ER-mitochondria contacts by Parkin via Mfn2,” Pharmacological Research, vol. 138, pp. 43–56, 2018.
[41] N. Ilacqua, M. Sanchez-Alvarez, M. Bachmann, V. Costiniti, M. A. Del Pozo, and M. Giacomello,“Protein localization at mitochondria-ER contact sites in basal and stress conditions,” Frontiers in Cell and Development Biology, vol. 5, p. 107, 2017. [42] W. Wang, Q. Xie, X. Zhou et al.,“Mitofusin-2 triggers mito-chondria Ca2+ influx from the endoplasmic reticulum to induce apoptosis in hepatocellular carcinoma cells,” Cancer Letters, vol. 358, no. 1, pp. 47–58, 2015.
[43] A. A. Rowland and G. K. Voeltz, “Endoplasmic reticulum-mitochondria contacts: function of the junction,” Nature Reviews Molecular Cell Biology, vol. 13, no. 10, pp. 607–615, 2012.
[44] S. Paillusson, P. Gomez-Suaga, R. Stoica et al.,“α-synuclein binds to the ER-mitochondria tethering protein VAPB to dis-rupt Ca2+homeostasis and mitochondrial ATP production,” Acta Neuropathologica, vol. 134, no. 1, pp. 129–149, 2017. [45] V. M. Pozo Devoto, N. Dimopoulos, M. Alloatti et al.,
“αSynu-clein control of mitochondrial homeostasis in human-derived
neurons is disrupted by mutations associated with Parkinson's disease,” Scientific Reports, vol. 7, no. 1, article 5042, 2017. [46] M. Vicario, D. Cieri, M. Brini, and T. Cali,“The close
encoun-ter between alpha-synuclein and mitochondria,” Frontiers in Neuroscience, vol. 12, p. 388, 2018.
[47] S. Fujioka and Z. K. Wszolek, “Clinical aspects of familial forms of frontotemporal dementia associated with parkinson-ism,” Journal of Molecular Neuroscience, vol. 45, no. 3, pp. 359–365, 2011.
[48] A. H. Schapira and P. Jenner,“Etiology and pathogenesis of Parkinson’s disease,” Movement Disorders, vol. 26, no. 6, pp. 1049–1055, 2011.
[49] C. Guardia-Laguarta, E. Area-Gomez, E. A. Schon, and S. Przedborski, “Novel subcellular localization for α-synu-clein: possible functional consequences,” Frontiers in Neuro-anatomy, vol. 9, p. 17, 2015.
[50] A. Bellucci, L. Navarria, M. Zaltieri, C. Missale, and P. Spano, “Alpha-synuclein synaptic pathology and its implications in the development of novel therapeutic approaches to cure Par-kinson’s disease,” Brain Research, vol. 1432, pp. 95–113, 2012. [51] J. Shen, T. Du, X. Wang et al.,“α-synuclein amino terminus regulates mitochondrial membrane permeability,” Brain Research, vol. 1591, pp. 14–26, 2014.
[52] L. Devi, V. Raghavendran, B. M. Prabhu, N. G. Avadhani, and H. K. Anandatheerthavarada, “Mitochondrial import and accumulation of alpha-synuclein impair complex I in human dopaminergic neuronal cultures and Parkinson disease brain,” Journal of Biological Chemistry, vol. 283, no. 14, pp. 9089– 9100, 2008.
[53] R. Sirabella, M. J. Sisalli, G. Costa et al.,“NCX1 and NCX3 as potential factors contributing to neurodegeneration and neuroinflammation in the A53T transgenic mouse model of Parkinson's Disease,” Cell Death & Disease, vol. 9, no. 7, p. 725, 2018.
[54] C. E. Ellis, E. J. Murphy, D. C. Mitchell et al.,“Mitochondrial lipid abnormality and electron transport chain impairment in mice lacking alpha-synuclein,” Molecular and Cellular Biol-ogy, vol. 25, no. 22, pp. 10190–10201, 2005.
[55] D. Pathak, A. Berthet, J. T. Bendor et al.,“NCX1 and NCX3 as potential factors contributing to neurodegeneration and neuroinflammation in the A53T transgenic mouse model of Parkinson's Disease,” Cell Death & Disease, vol. 9, no. 7, article 725, 2017.
[56] K. Taguchi, Y. Watanabe, A. Tsujimura, and M. Tanaka, “Brain region-dependent differential expression of alpha-synuclein,” Journal of Comparative Neurology, vol. 524, no. 6, pp. 1236–1258, 2016.
[57] Y. X. Gui, X. Y. Wang, W. Y. Kang et al., “Extracellular signal-regulated kinase is involved in alpha-synuclein-induced mitochondrial dynamic disorders by regulating dynamin-like protein 1,” Neurobiology of Aging, vol. 33, no. 12, pp. 2841–2854, 2012.
Stem Cells
International
Hindawi www.hindawi.com Volume 2018 Hindawi www.hindawi.com Volume 2018 INFLAMMATIONEndocrinology
International Journal ofHindawi www.hindawi.com Volume 2018 Hindawi www.hindawi.com Volume 2018
Disease Markers
Hindawi www.hindawi.com Volume 2018 BioMed Research InternationalOncology
Journal of Hindawi www.hindawi.com Volume 2013 Hindawi www.hindawi.com Volume 2018 Oxidative Medicine and Cellular Longevity Hindawiwww.hindawi.com Volume 2018
PPAR Research
Hindawi Publishing Corporation
http://www.hindawi.com Volume 2013 Hindawi www.hindawi.com
The Scientific
World Journal
Volume 2018 Immunology Research Hindawi www.hindawi.com Volume 2018 Journal ofObesity
Journal of Hindawi www.hindawi.com Volume 2018 Hindawi www.hindawi.com Volume 2018 Computational and Mathematical Methods in Medicine Hindawi www.hindawi.com Volume 2018Behavioural
Neurology
Ophthalmology
Journal of Hindawi www.hindawi.com Volume 2018Diabetes Research
Journal ofHindawi
www.hindawi.com Volume 2018
Hindawi
www.hindawi.com Volume 2018 Research and Treatment
AIDS
Hindawi
www.hindawi.com Volume 2018
Gastroenterology Research and Practice
Hindawi www.hindawi.com Volume 2018