Abstract
This paper concerns an experimental study on Steel Fiber Reinforced Concrete (SFRC) beams tested under pure torsion. The beams are reinforced with longitudinal rebars without any transverse reinforcement that was substituted by high strength steel fibers.
Experimental results show that SFRC allows a stable torsional behavior after cracking, in terms of enhanced crack control, increased cracked stiffness and torsional resistance.
In order to predict the response of SFRC beams, an analytical model reported in the literature has been used and adapted to the fib Model Code 2010 provisions. The results of the model prediction are compared against the experimental results and critically discussed.
Keywords: Fiber reinforced concrete, steel fibers, torsion in beams, torsional strength, torsional
toughness.
1. Introduction
The addition of steel fibers to the concrete matrix allows obtaining a composite material referred to as Steel Fiber Reinforced Concrete (SFRC). When compared to conventional reinforced concrete (RC), SFRC presents a higher post-cracking tensile strength and toughness resulting from fiber bridging (Jenq & Shah 1986).
Steel fibers may completely replace the traditional reinforcement (rebars) when used in structures with high internal redundancy (i.e., slabs, plates, etc.) that allow a significant internal stress redistribution. Moreover, in structural elements like beams or slabs, SFRC may be exploited to reduce both flexural (Facconi & Minelli, 2017, Facconi et al 2019) and shear (Minelli & Plizzari 2013) conventional reinforcement.
The literature has reported a limited number of studies concerning the behavior of SFRC beams under pure torsion (Chalioris & Karayannis 2009, Ju et al. 2015). Most of those studies highlights the ability of fibers to improve both the torsional strength and ductility of concrete beams. Indeed, the torsional action is mainly resisted by diagonal compressive stresses that spiral around the beam at a certain angle after cracking. Therefore, the improved tensile performance of concrete due to the inclusion of fibers allows to increase its ability to carry tensile stresses across inclined cracks, thus leading to an enhancement of the torsional capacity of the overall member.
In order to improve the knowledge about the behavior of SFRC beams under pure torsion, an experimental program is currently running at the University of Brescia (Italy) to test beams whose torsional resistance after cracking is provided by fibers only. The present paper reports the results obtained by testing 3 of the 9 samples included in the whole experimental campaign. In more detail, the discussion of the results will compare three beams: one was made with plain concrete and the remaining two with SFRC containing 25 and 50 kg/m3 of high strength steel fibers. All the specimens were made with longitudinal reinforcement and without transverse reinforcement.
EXPERIMENTAL STUDY ON STEEL FIBER REINFORCED
CONCRETE BEAMS IN PURE TORSION
Luca Facconi1, Fausto Minelli1, Giovanni Plizzari1 and Paola Ceresa2
1 Department of Civil, Environmental, Architectural Engineering and Mathematics, University of Brescia,
Brescia, Italy
2 RED Risk Engineering + Development, Pavia, Italy
Corresponding author email: [email protected]
Proceedings of the Symposium 2019 Concrete - Innovations in Materials, Design and Structures fib
To complete the investigation and better understand the test observations, the torsional capacity of the SFRC specimens was compared with the analytical prediction obtained by implementing the model recently developed by Amin & Bentz (2018); the comparison is discussed in the last section of the paper.
2. Experimental program
2.1. Specimen properties
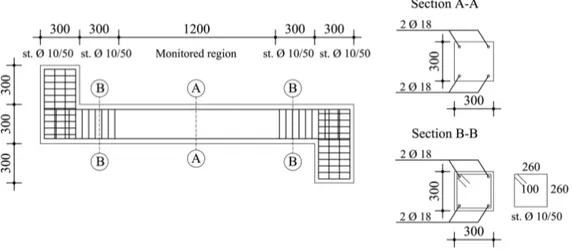
The specimen was a rectangular beam having a total length of 2400 mm and a square cross section with a side of 300 mm (Figure 1). Two loading arms were cast at the two edges of the beam and used to apply the torsional moment. As described in Table 1, the three specimens were made with three different materials, namely: Plain Concrete (PC), which represents the concrete without fibers, and SFRC with 25 and 50 kg/m3 of steel fibers, respectively. All the samples were reinforced with 4 longitudinal deformed bars having a diameter of 18 mm (As=4·254 mm2=1017 mm2), leading to a longitudinal reinforcement ratio (ρl=As/(b·h)) of 1.13 %. A region with a total length of 1200 mm was selected to monitor the pure torsional response of the beam. As shown in Figure 1, no stirrups were placed in the monitored region whereas significant transverse reinforcement was placed in the so-called “disturbed” regions at both ends of the beam in order to prevent the formation of cracks or local mechanisms.
All the specimens were cast at the University of Brescia and were removed from the wooden moulds two-days after casting; afterwards, they were left to air dry at room temperature for more than 28 days, until the time of test.
Figure 1. Details of the test specimens (dimensions in mm).
Table 1. Properties of the test beams (i.e. the monitored regions of each specimen, as shown in Figure 1). Specimen Cross-section Material Reinforcement Stirrups content Fiber Fiber volume fraction
b h Type ρl Type ρt Vf (mm) (mm) (%) (%) (kg/m3) (%) TB1-PC 300 300 PC 4Ø18 1.13 - - 0 0 TB2-SFRC25 SFRC25 25 0.32 TB3-SFRC50 SFRC50 50 0.64 2.2. Material properties
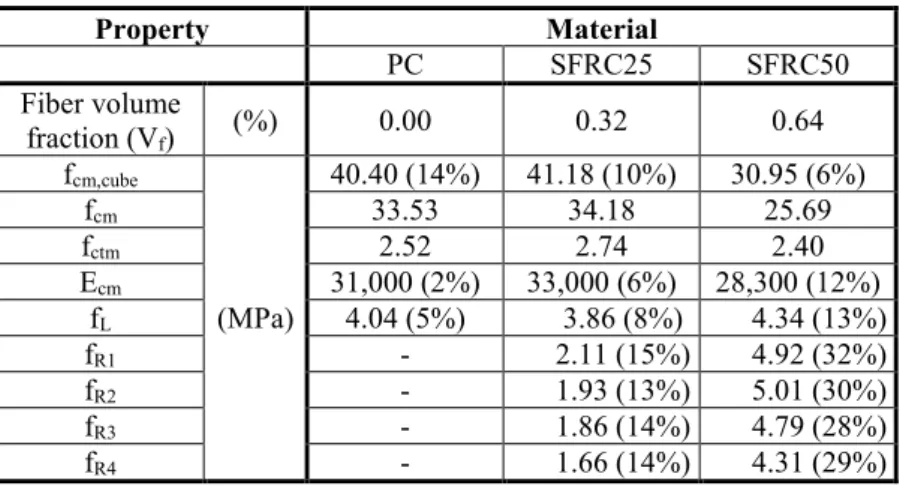
Table 2 summarizes the SFRC composition as well as the main properties of the steel fibers. Batches were characterized by the same components except for the total content of superplasticizer that was increased up to 0.6% in order to have the expected concrete workability with the highest fiber content (i.e., Vf=0.64%). Referring to the concrete mechanical properties, Table 3 reports:
• the mean cubic compressive strength (fcm,cube), obtained by testing 150×150×150 mm3 cubes (6 PC samples; 7 SFRC25 samples; 10 SFRC50 samples) according to EN 12390-3:2009;
• the mean elastic modulus (Ecm) from 3 cylinders per batch (according EN 12390-13:2013) having a diameter of 80 mm;
• the mean value of the Limit of Proportionality (fL) and
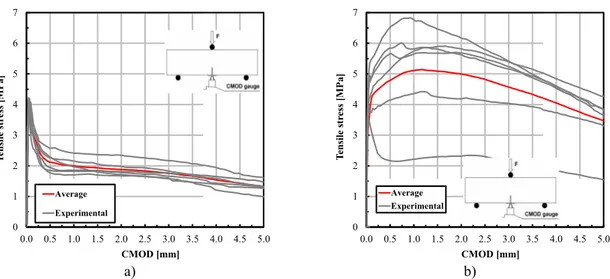
• the mean residual tensile strengths (fR1, fR2, fR3, fR4) obtained from 3 Point Bending Test (3PBT) according to EN 14651-5:2005 (Fig. 2). Note that the residual strengths fR1, fR2, fR3 and fR4 are the residual flexural stresses (Fig. 2) corresponding to CMOD values equal to 0.5, 1.5, 2.5 and 3.5 mm, respectively.
The mean tensile strength was analytically calculated by adopting the relationship fctm=0.3fck2/3, as suggested by Eurocode 2 (Section 3.1.2).
Table 2. Concrete mixture and fiber properties.
Cement type CEM I 42.5R
Cement content (kg/m3) 380 Fine aggregate 0-4mm (kg/m3) 1082 Coarse aggregate 4-12mm (kg/m3) 742 Water-cement ratio (-) 0.5 Super plasticizer (% on cement content) (%) 0.1 (PC) 0.1 (SFRC – Vf=0.25%) 0.6 (SFRC – Vf=0.63%)
Fiber shape Single hooked-end
Material High carbon, cold drawn steel
Tensile strength (MPa) >2200
Length (l) (mm) 30
Diameter (Ø) (mm) 0.35
Aspect ratio (l/Ø) (-) 86
Table 3. Mechanical properties of concrete.
Property Material PC SFRC25 SFRC50 Fiber volume fraction (Vf) (%) 0.00 0.32 0.64 fcm,cube (MPa) 40.40 (14%) 41.18 (10%) 30.95 (6%) fcm 33.53 34.18 25.69 fctm 2.52 2.74 2.40 Ecm 31,000 (2%) 33,000 (6%) 28,300 (12%) fL 4.04 (5%) 3.86 (8%) 4.34 (13%) fR1 - 2.11 (15%) 4.92 (32%) fR2 - 1.93 (13%) 5.01 (30%) fR3 - 1.86 (14%) 4.79 (28%) fR4 - 1.66 (14%) 4.31 (29%)
Note that all the mean values of the mechanical properties reported in Table 3 are coupled with the corresponding coefficients of variation placed in the round brackets.
The longitudinal reinforcement adopted for all the test specimens consisted of deformed bars with a diameter of 18 mm. The uniaxial tensile tests on rebars were performed according to EN ISO 15630-1:2010 (on 4 bar samples) and provided a mean yield strength and an ultimate tensile strength of 543 MPa (CV 0.75%) and 642 MPa (CV 0.49%), respectively.
a) b)
Figure 2. Tensile stress-CMOD response obtained from 3 Point Bending Tests (PBT) according to EN 14651:2005 on SFRC25 (a) and on SFRC50 (b).
2.3. Test set-up and instrumentation
Prior to placing the specimens in the test rig, each beam was painted (white) to better evidence the cracks. The test rig used to carry out the experiments is schematically represented in Figure 3a. The rig consisted of two steel roller supports that allowed the beam to rotate about its longitudinal axis. The specimens were located on two steel plates, mounted on the rollers, whose very smooth top surface made the beam free to elongate in both end directions. A loading steel beam (HE360B) was placed diagonally on the top of the sample to equally distribute the total vertical load (P) between the two loading arms. Particular care was paid to the correct location of the loading beam on the torsional arms (the distance between the loads applied to the loading arms and the longitudinal axis of the beam was equal to 335 mm). The two forces (P/2) applied to the specimen generated two opposite couples at its ends.
The tests were carried out under displacement control by using a 1000 kN capacity electromechanical screw jack. Figure 3b shows the front view of one of the samples placed in the test rig before testing.
a) b)
Figure 3. a) Schematization of the test rig. b) View of the specimen before testing.
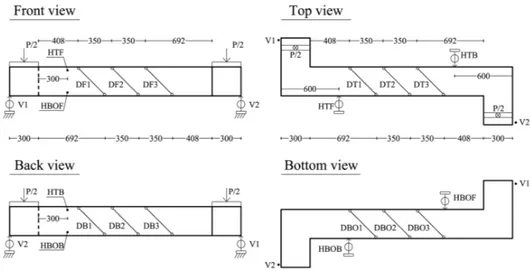
The adopted instrumentation is shown in Figure 4. The vertical displacement of the loading arms was measured by two LVDTs (V1 and V2) placed close to the application point of the vertical load (P/2). A total of four LVDTs were also placed horizontally both at the top (HTB, HTF) and at the bottom (HBOF, HBOB) to determine the twist angle per unit length (θ). To calculate θ, the horizontal displacements measured on each side of the beam were considered. Thus, named dHTB, dHTF, dHBOF and dHBOB the measurements from HTB, HTF, HBOB and HBOF, θ was calculated by using the following equation:
θ = �𝑎𝑎𝑎𝑎𝑎𝑎𝑎𝑎𝑎𝑎𝑎𝑎 �𝑑𝑑𝐻𝐻𝐻𝐻𝐻𝐻− 𝑑𝑑ℎ 𝐻𝐻𝐻𝐻𝐻𝐻𝐻𝐻 𝑖𝑖 � − 𝑎𝑎𝑎𝑎𝑎𝑎𝑎𝑎𝑎𝑎𝑎𝑎 � 𝑑𝑑𝐻𝐻𝐻𝐻𝐻𝐻− 𝑑𝑑𝐻𝐻𝐻𝐻𝐻𝐻𝐻𝐻 ℎ𝑖𝑖 �� /𝐿𝐿𝑖𝑖 (1) 0 1 2 3 4 5 6 7 0.0 0.5 1.0 1.5 2.0 2.5 3.0 3.5 4.0 4.5 5.0 Ten si le s tr es s [ MP a] CMOD [mm] Average Experimental 0 1 2 3 4 5 6 7 0.0 0.5 1.0 1.5 2.0 2.5 3.0 3.5 4.0 4.5 5.0 Ten si le s tr es s [ MP a] CMOD [mm] Average Experimental
where hi=270 mm and Li=1200 mm are, respectively, the transverse and the longitudinal distance between the measurement points. To detect the formation of cracks, three potentiometers were placed on each of the four surfaces of the beam with an inclination of about 45˚ with respect to the longitudinal axis of the specimen. The tests were performed by increasing monotonically the vertical load up to specimen failure. The total vertical load was measured by two load cells placed on the steel frame used to transfer the load from the thrust jack to the loading beam. All the data provided by the instruments were continuously stored and processed by a data acquisition system.
Figure 4. Schematic view of the instrumentation (dimensions in mm).
3. Experimental results and discussion
Figure 5 reports the Torque (T)-twist angle per unit length (θ - see equation (1)) response of the test specimens. Moreover, Table 4 summarizes the main experimental results concerning: the average angle of inclination of cracks with respect to the longitudinal axis of the beam, the Torque and the corresponding twist angle detected at first cracking (Tcr,exp, θcr,exp), at the peak of the T-θ curve (Tp,exp, θp,exp) and at the end of the test (Tu,exp, θu,exp), when the maximum twist angle (θu,exp) was achieved. All the beams exhibited a typical torsional crack pattern (Collins & Mitchell 1991). As shown in Figure 6, the main cracks detected on the specimen surfaces presented an inclination ranging from 37° to 50°, with an average value approximately equal to 42°-43° (Table 4). The response of the specimen made with Plain Concrete (TB1-PC) was linear up to the peak value of the Torque (18.4 kNm; Fig. 5a), corresponding to the formation of the first crack. Figure 6a clearly shows the brittle behavior of the beam (absence of a post-peak response) with a single crack starting on the front side of the beam and instantaneously propagating to the other faces. The response of the SFRC specimens was significantly more stable (Fig. 5b), being both characterized by a post-peak softening response after the initial linear behavior. The similar values of the first cracking torques and twist angles point out that the three specimens have similar elastic torsional stiffnesses, approximately equal to 10000 kNm/rad. The maximum torque achieved by the specimen TB2-SFRC25 and TB3-SFRC50 was respectively 10% and 6% higher than the value obtained for the specimen TB1-PC. As expected, the increment of the tensile performance of concrete due to the use of fibers allowed getting a stable propagation of fracture in the post-cracking stage, leading to a higher rotation capacity of the beam. The latter behavior was mainly related to the improved internal stress redistribution resulting from the higher SFRC tensile toughness. The better internal stress redistribution is clearly proved by the crack pattern of sample TB2-SFRC25 (Fig. 6b), which presents a more diffused crack pattern than the specimen TB1-PC. The specimen with the highest content of fibers showed otherwise a post-cracking resistance lower than that observed for specimen TB2-SFRC25 and a crack pattern similar (Fig. 6c) to that of the specimen TB1-PC. Such an unexpected lower performance (sample TB3-SFRC50) was probably due to some problems during concrete mixing and casting operations that caused the non-uniform distribution of fibers in the specimen. Nevertheless, both the maximum twist angle and the corresponding torque of the beams TB3-SFRC50 and TB2-SFRC25 were rather similar.
a) b)
Figure 5. Torque vs. twist angle response of the test specimens: a) specimen TB1-PC, b) specimens TB2-SFRC25 and TB3-SFRC50.
Table 4. Main results of the experimental tests.
Specimen crack angle Average First cracking Maximum capacity Ultimate capacity Tcr,exp θcr,exp Tp,exp θp,exp Tu,exp θu,exp
(°) (kNm) (mrad/m) (kNm) (mrad/m) (kNm) (mrad/m)
TB1-PC 42 18.4 1.56 18.4 1.56 18.3 1.92 TB2-SFRC25 43 17.9 1.45 20.3 8.39 9.54 57.16 TB3-SFRC50 43 17.9 1.55 19.5 2.06 9.00 60.00 Back Bottom Front Top a) b) c)
Figure 6. Ultimate crack patterns of the specimens: a) TB1-PC, b) TB2-SFRC25, c) TB3-SFRC50.
4. Analytical approach
A first important analytical check is the comparison of the torque and twist angle at first cracking with those provided by classical theories. For the cracking torque, the following expression proposed by Hsu & Mo (1985) can be adopted:
T𝑐𝑐𝑐𝑐= 140 ∙ �𝑥𝑥2�645+ 10� ∙ 𝑦𝑦 ∙ �𝑓𝑓′3 𝑐𝑐 (2) where f’c is the cylindrical concrete compressive strength whereas x=b=300 mm and y=h=300 mm are the width and the height of the beam cross section, respectively. The twist at torsional cracking can be derived from the elastic theory as follows:
0 2 4 6 8 10 12 14 16 18 20 0 0.2 0.4 0.6 0.8 1 1.2 1.4 1.6 1.8 2 Tor qu e (T) [K N m]
Angle of twist per length (θ) [mrad/m]
PC 0 2 4 6 8 10 12 14 16 18 20 22 0 5 10 15 20 25 30 35 40 45 50 55 60 Tor qu e (T) [K N m]
Angle of twist per lenght (θ) [mrad/m]
TB2-FRC25 TB3-FRC50
θ𝑐𝑐𝑐𝑐=4 ∙ 𝐴𝐴𝑇𝑇𝑐𝑐𝑐𝑐∙ 𝑝𝑝𝑜𝑜 𝑜𝑜 2∙ 𝑎𝑎 𝑐𝑐∙ 𝐺𝐺 𝑤𝑤𝑤𝑤𝑎𝑎ℎ 𝑎𝑎𝑐𝑐= 3 4 𝐴𝐴𝑐𝑐 𝑝𝑝𝑐𝑐 (3)
where Ao=(b-tc)2=59390 mm2 is the area enclosed by the centreline of the equivalent thin-walled tube; po=4·(b-tc)=975 mm is the perimeter of Ao; tc=56.3 mm; Ac=90000 mm2 and pc=1200 mm are the area and the outer perimeter of the gross section, respectively. The elastic shear stiffness modulus (G) can be reasonably assumed equal to 0.5·Ecm (Table 3). The results reported in Table 5 show the good agreement between the experimental (Tcr,exp, θcr,exp) and the analytical predictions (Tcr,a, θcr,a) obtained from the equations (2) and (3). The torsional resistance of the beam TB1-PC can be assumed equal to Tcr since no stirrups were used to improve the torsional strength after cracking. On the other hand, the resistance of the SFRC beams may be estimated by conveniently implementing the post-cracking tensile strength provided by fibers in the space truss model generally adopted to predict the torsional response of concrete members. Based on the Modified compression Field Theory – MCFT (Bentz et al. 2006) and on the Raush’s truss model refined by Lampert & Collins (1972), Amin and Bentz (2018) proposed the following relationship to predict the resisting torque (Tp) of a SFRC beam:
T𝑝𝑝= 2 ∙ 𝐴𝐴𝑜𝑜∙ 𝑚𝑚𝑤𝑤𝑎𝑎 ��𝐴𝐴𝑠𝑠𝑠𝑠𝑠𝑠∙ 𝑓𝑓𝑠𝑠𝑠𝑠+ 𝑎𝑎𝑐𝑐∙ 𝑘𝑘𝑓𝑓𝑓𝑓∙ 𝑓𝑓𝑓𝑓� ∙ 𝑎𝑎𝑐𝑐𝑎𝑎𝑐𝑐𝜃𝜃𝑠𝑠 ; �∑ 𝐴𝐴𝑠𝑠𝑠𝑠,𝑖𝑖𝑝𝑝 ∙ 𝑓𝑓𝑠𝑠𝑠𝑠,𝑖𝑖
𝑐𝑐 + 𝑎𝑎𝑐𝑐∙ 𝑘𝑘𝑓𝑓𝑓𝑓∙ 𝑓𝑓𝑓𝑓� ∙ 𝑎𝑎𝑐𝑐𝜃𝜃𝑠𝑠� (4) where fsv and s are the yield strength and spacing of the transverse steel rebars; Asv is the area of one leg of the transverse reinforcement; Asl,i and fsy are respectively the cross-sectional area and the yield strength of each longitudinal rebars. Note that, to avoid crushing of diagonal struts, the torque resulting from equation (4) must not be higher than 0.25·fcm·(1.7Ac)2/pc.
The fiber dispersion reduction factor kfd is here assumed equal to 1 and the residual tensile strength of SFRC is calculated from the tensile stress (ff)-crack width (w) linear model described in the fib Model Code (2010) (MC2010; clause 5.6.4):
f𝑓𝑓= f𝐻𝐻𝐹𝐹𝑠𝑠+ 0.5 ∙ (𝑤𝑤 − 0.5) ∙ (f𝐻𝐻𝐹𝐹𝐹𝐹− f𝐻𝐻𝐹𝐹𝑠𝑠) (5) with fFts=0.45·fR1 and fFtu=0.5·fR3-0.2·fR1.
To determine the angle (θv) of the principal compressive stresses (i.e., the strut angle), the following equation taken from the MCFT (Bentz et al. 2006) can be used:
θ𝑠𝑠 = 29° + 7,000 ∙ 𝜀𝜀𝑥𝑥 (6)
which includes the longitudinal strain at mid-height of the section: ε𝑥𝑥=2 ∙ 𝐴𝐴 0.9 ∙ 𝑇𝑇𝑝𝑝∙ 𝑝𝑝𝑐𝑐
𝑜𝑜∙ 𝐸𝐸𝑠𝑠∙ �𝐴𝐴𝑠𝑠,𝐻𝐻+ 𝐴𝐴𝑠𝑠,𝐻𝐻� (7) where Es=210 GPa is the Young’s modulus of steel; As,B and As,T are the total cross-sectional area of longitudinal rebars at the bottom and top half of the cross section, respectively.
A simple trial-and-error procedure can be adopted to calculate the torque Tp. Thus, through each iteration, an initial value of the longitudinal strain (εx) has been chosen. Hence, the angle θv is calculated from equation (6) and the crack width can be estimated as follows:
𝑤𝑤 = 0.2 + 1000 ∙ 𝜀𝜀𝑥𝑥≥ 0.125 𝑚𝑚𝑚𝑚 (8)
The value of the crack width allows to determine the residual strength ff from equation (5) and the value of the torque Tp from equation (4). The latter is then implemented in equation (7) to get the new estimate of the longitudinal strain. The solution is obtained by repeating iteratively this procedure.
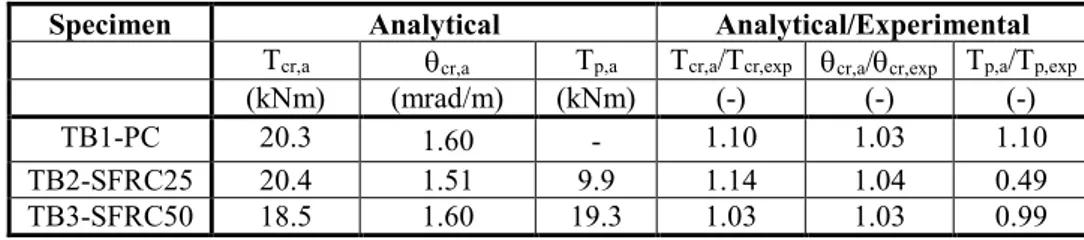
Table 5 compares the experimental (Tp,exp) and the analytical values (Tp,a) of the maximum torque for the SFRC beams. The predictions of the Amin & Bentz (2018) model seems to underestimate the experimental results; in fact, the torque of the specimen TB2-SFRC25, which seems to be more reliable, is about 50% lower than that observed in the test.
Table 5. Comparison between experimental and predicted results of the tests.
Specimen Analytical Analytical/Experimental
Tcr,a θcr,a Tp,a Tcr,a/Tcr,exp θcr,a/θcr,exp Tp,a/Tp,exp
(kNm) (mrad/m) (kNm) (-) (-) (-)
TB1-PC 20.3 1.60 - 1.10 1.03 1.10
TB2-SFRC25 20.4 1.51 9.9 1.14 1.04 0.49
TB3-SFRC50 18.5 1.60 19.3 1.03 1.03 0.99
5. Concluding remarks
The paper reports and discusses the results of three experimental tests performed on conventional reinforced concrete and SFRC beams subjected to pure torsion. The experiments aimed at investigating the behavior of SFRC beams where no transversal steel reinforcement is adopted to resist torsion. Based on the obtained results, the following main conclusions can be derived:
1. The use of low fiber contents appears to be not able to provide a significant increment of the resistance after cracking. The maximum resisting torque of the specimen with 25 kg/m3 of fibers (TB2-SFRC25) was 10% higher than that of the reference specimen (TB1-PC).
2. The use of steel fibers allows to significantly improve the post-cracking torsional toughness of the beam, leading to a more stable fracture process with respect to the specimen without fibers. 3. The analytical approach proposed by Amin & Bentz (2018), and here adapted to the fib Model Code 2010 provisions for SFRC, seems to be very promising for predicting the response of SFRC beams without stirrups. However, the underestimation of the experimental results suggests that further research is required to improve the model effectiveness.
References
Amin, A., and Bentz, E.C. (2018), Strength of steel fiber reinforced concrete beams in pure torsion. Structural Concrete 19.3 (2018): 684-694.
Bentz, E.C., Vecchio FJ, Collins, M.P. (2006), Simplified modified compression field theory for calculating shear strength of reinforced concrete elements. ACI Struct J.;103(4):614-624.
Chalioris, C. E., & Karayannis, C. G. (2009), Effectiveness of the use of steel fibres on the torsional behaviour of flanged concrete beams. Cement and Concrete Composites, 31(5), 331-341.
Collins, M.P., Mitchell, D. (1991), Prestressed Concrete Structures. Englewood Cliffs, NJ: Prentice-Hall, Inc.; 1991:766.
EN 12390-13:2013. Testing hardened concrete. Part 13: Determination of secant modulus of elasticity in compression.
EN 12390-3:2009. Testing hardened concrete. Part 3: Compressive strength of test specimens.
EN 14651-5:2005. “Precast concrete products – test method for metallic fibre concrete – Measuring the flexural tensile strength,” European Standard.
EN 1992-1-1:2004, Eurocode 2: Design of Concrete Structures – Part 1-1: General rules and rules for buildings. EN ISO 15630-1:2010. Steel for the reinforcement and prestressing of concrete - Test methods - Part 1:
Reinforcing bars, wire rod and wire (ISO 15630-1:2010)
Facconi, L., Minelli, F. (2017), Verification of structural elements made of FRC only: A critical discussion and proposal of a novel analytical method. Eng Struct, 131:530–541.
Facconi, L., Plizzari G., and Minelli F. (2019), Elevated slabs made of hybrid reinforced concrete: Proposal of a new design approach in flexure. Structural Concrete. 20 (1):52-67; DOI: 10.1002/suco.201700278 fib Model Code for Concrete Structures 2010. Fédération Internationale du Béton. Lausanne: Ernst & Sohn, 2013. Hsu, T.T.C. and Mo, Y.L. (1985), Softening of concrete in torsional members-theory and tests. ACI Journal 82:
290–303
Jenq, Y. S., & Shah, S. P. (1986), Crack propagation in fiber-reinforced concrete. Journal of Structural Engineering, 112(1), 19-34.
Ju, H., Kim, K. S., Lee, D. H., Hwang, J. H., Choi, S. H., & Oh, Y. H. (2015), Torsional responses of steel fiber-reinforced concrete members. Composite Structures, 129, 143-156.
Lampert, P., Collins, M.P. (1972), Torsion, bending and confusion—an attempt to establish the facts. ACI J. 69(8):500-504.
Minelli, F., & Plizzari, G. A. (2013). On the Effectiveness of Steel Fibers as Shear Reinforcement. ACI Structural Journal, 110(3).