Nanomechanics and Nanotribology of
Protein Films
by
Navinkumar Jayvant Patil
Thesis
Presented to the Department of Physics of University of Calabria
for the Degree of
Doctor of Philosophy in Science and Technology of
Mesophases and Molecular Materials
University of Calabria, Italy
November 2015
Table of Contents
Introduction ...6
Chapter 1 Background, Methods and Materials ...25
1.1 Statistical models of polymer chains ...25
1.2 Freely rotating and worm like chains...28
1.3 Kuhn length and persistance length ...29
1.4 Non-Guassian behavior and simple Flory theory ...30
1.5 Surface forces and general theory of molecular interactions in aqueous media: the DLVO theory ...32
1.6 Protein studies with surface force apparatus ...36
1.6.1 SFA design ...37
1.6.2 Mica surfaces ...40
1.6.3 Distance measurements: multiple beam interferometry ...43
1.6.4 Normal force measurements ...47
1.6.5 Experimental procedure ...49
1.7 Pin-on-disk tribometry ...52
1.9 Dynamic light scattering ...57
1.10 Zeta potential ...60
1.11 Circular dichroism spectroscopy...62
Chapter 2 Wet Adhesion of Mussel Adhesive Proteins ...67
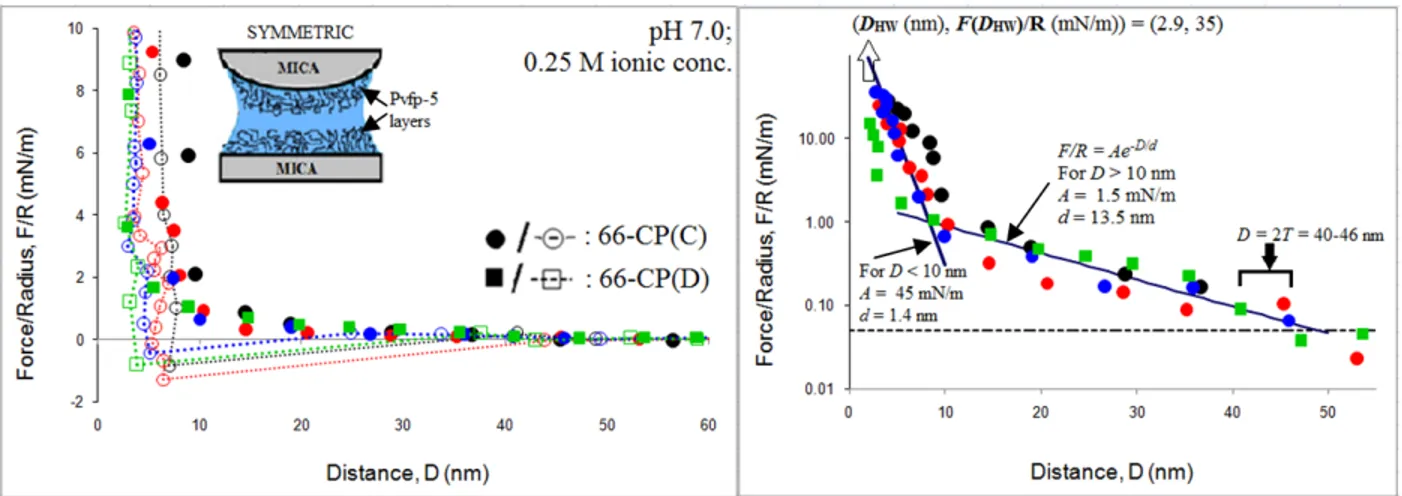
2.1 Results ...69
2.1.1 Adhesion between Pvfp-5 layers ...69
2.1.2 Adhesion between Pvfp-5 and mica ...79
2.1.3 Adhesion between Pvfp-3 layers ...81
2.1.4 Adhesion between Pvfp-3 and mica ...88
2.1.5 Pvfp-5 and Pvfp-3 mixtures ...90
Chapter 3 Molecular Structure and Nanomechanics of Bovine Submaxillary Mucin ...98
3.1 Introduction ...98
3.2 Purification of BSM ...99
3.3 Sample preparation ...100
3.4 Hydrodynamic size of BSM in bulk solution ...101
3.6 Contour length and conformation of single BSM molecules...104
3.7 Surface force measurements ...108
3.8 Discussion ...113
3.8.1 Single molecule ...113
3.8.2 Nanomechanics of adsorbed BSM layers ...114
3.8.3 Effect of acidification ...117
3.9 Conclusions ...120
Chapter 4 Enhanced Boundary Lubrication of PGM via Complexation with Polyethylenimine in Neutral Aqueous Solution ...124
4.1 Introduction ...124
4.2 Sample preparation ...126
4.3 Synergistic lubrication of PGM and b-PEI mixtures ...127
4.4 Influence of ionic strength and chaotropic agent on the enhanced lubrication of PGM:b-PEI mixtures ...129
4.5 Surface adsorption of PGM, b-PEI and their mixtures ...130
4.6 Conformational changes of PGM upon mixing with b-PEI...132
4.7 Hydrodynamic size and surface charge of PGM upon mixing with b-PEI ...134
4.8 Influence of salt and chaotropic agent on the size and surface potential of
PGM/b-PEI complexes ...137
4.9 Conclusions ...140
Conclusions and Outlook ...143
INTRODUCTION
Nature provides numerous examples of organisms and tissues showing outstanding surface adhesion and lubrication properties in wet aqueous conditions where artificial devices and material are ineffective or completely fail. Marine organisms such as sea shells and algae are able to firmly attach underwater to wave-swept rocks and sea hulls. Insects and small reptiles such as the gecko are able to climb vertical walls and rest upside down from horizontal surfaces with various composition (hydrated or waxy hydrophobic plant leaves and fruits, dusty rocks, household glass, etc). Animal tissues and organs such as cartilage, mucosal surfaces or slug slime are very hydrated, and yet provide slippery and robust interfaces for tissue articulation, locomotion and interaction with the external environment. By comparison, artificial glues are typically based on polymers (e.g. acrylates, resins, silicon glue or scotch tape) and unable to bind two surfaces underwater; lubricant fluids contain hydrophobic oils and fats and wear resistant surfaces (e.g. metals, ceramics and plastics) are not hydrate. Understanding the mechanisms adopted by Nature for inhibiting or enhancing surface adsorption, adhesion, friction and wear is a major challenge for modern science, not only from the fundamental point of view but because some of these mechanisms may be replicated in artificial materials and devices. In fact, the field of “biomimetics”, that is the fabrication of functional systems inspired to biological organisms and materials, has been rapidly expanding in recent years in material and surfaces science.
In this thesis we have focused on the molecular scale mechanisms of adhesion and lubrication provided by some animal proteins that could be replicated with biomimetic polymers, since proteins and polymers share a chain-like linear molecular structure. Our study did not extent, for instance, to the full scale of biological organs, limbs or organisms (e.g. gecko foot, insect adhesive pads) that could be replicated by artificial devices.
We considered two classes of proteins: (a) the adhesive foot proteins of the Asian green mussel Perna Viridis owing their surface adsorption and adhesive properties to the grafting of the functional group L-3,4-dihydroxyphenylalanine (DOPA) on the protein chain, grafted on the polymer chain, and (b) surface-protecting and lubricating mucins, glycoproteins commonly found on the surface of animal tissue and organs, that are heavily grafted with hydrophilic sugar groups. Adhesive foot proteins were provides in purified form by prof. A. Miserez and coworkers at the Nanyang Technologial Univeresity(NTU) in Singapore. Mucins and lubricating polymer were provided by prof. Seunghwan Lee at the Denmark Technological University (DTU) in Copenhagen.
(A) Adhesive proteins of the mussel foot
Animal attachment to a substrate is very different in terrestrial and aquatic environments. In terrestrial environment, gravity is considered as the most important detachment force. In submerged conditions gravity is nearly balanced out by buoyancy but flow forces such as drag and lift are of higher importance.1 Water is regarded as a contaminant in adhesion
technology because interfacial water leads to dramatic bond failure.2 Despite this prevalent challenges, wave-swept rocky shores and ship hulls are home to a variety of organisms that have evolved to attach themselves permanently to variety of substrates that are wet, saline, corroded, and/or fouled by biofilms. Mussels are prominent examples of sessile type organisms attaching themselves permanently to variety of underwater solid substrates.
Detailed studies on Mytilus mussel genus (blue mussels) during the last decade has enhanced our understanding of underlying physiochemical principles of mussel adhesion. The attachment apparatus of mussels is called the byssus, which is the bundle of threads extending from within the shell of the mussel, each of which terminates in an adhesive plaque attached to a substrate (Fig. 1).3, 4
Figure 1 (a) Adhesion of marine mussel.(b) Schematic cross-section of byssal thread and adhesive plaque
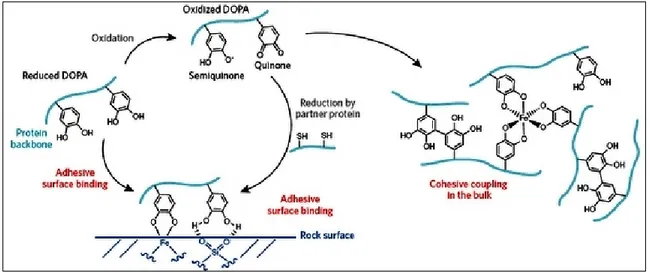
Byssal thread and adhesive plaque of mussels contains liquid protein mixture that is secreted from within glands of the mussel foot. The plaque proteins are known as mussel foot proteins (mfp). The solidification of the liquid proteins occurs rapidly and the mussel secretes one to several threads in one secreting motion. Finally the mussel body is attached with more than 50 byssal threads and plaques.5 In the byssal plaque of mussels that is specialized for adhesion, six mussel foot proteins have been identified in the blue mussels (Mytilus species) (mfp-2, -3S, -3F, -4, -5, and -6) (Fig. 1.1).2All mfps that have been identified for Mytilus genus share a common distinguished feature: the presence of Dopa that is added by post-translational hydroxylation of tyrosine (Tyr). Mfps are distinguished by their isoelectric points [Section 1.10] and Dopa content.6 Mfps found near the interface (e.g. mfp-3, -5 & -6) are the proteins with highest amount of Dopa. The presence of Dopa and its localization near the plaque-substrate interface have prompted the researchers’ attention for its likely involvement in surface adhesion.
Figure 2 (a) Hydroxylation of Tyr to Dopa and (b) catechol in Dopa
In fact, Tyr-DOPA amino acids play multiple key roles in both surface interaction (adhesion) and cohesion (cross-linking). Besides generating the chemical interface to the
substrate, the mussel forms Dopa cross-links between different mfps, which also strengthen cohesion in the mussel foot. It is the catechol (3,4-dihydroxyphenyl) moiety of Dopa that gives Dopa its unique properties to surface coupling and adhesion (Fig. 2b). Catechol bonding mechanism has been studied for several years and different interaction forms and attachment mechanism have been proposed. A brief schematic of diverse interactions of protein-bound Dopa is shown in Fig. 3. The reported routes for Dopa surface bonding include bidentate hydrogen bonding, metal/metal oxide coordination, and oxidative crosslinking.9
Figure 3. Schematic of adhesion mechanism and reactions of protein-bound Dopa. Figure adapted from
ref. [7].
However, intermolecular cross-linking reactions lead to oxidation of Dopa to Dopa-quinone10 and oxidation compromises the adhesive property Dopa.11 The strength of adhesion of Dopa rich mfps (mfp -3 and -5) was found to be inversely correlated to the
degree of Dopa oxidation to Dopa-quinone12 and complete oxidation of Dopa abolished adhesion while reduction back to Dopa restored it. There are several factors which may lead to oxidation of Dopa to Dopa-quinone. Spontaneously oxidation occurs at alkaline pH13 and auto-oxidation at neutral pH leads to loss of adhesion of mfps to substrates like mica and titanium.14, 15 Other factors include exposure to light and oxidation over time. Mussel-inspired biomimetic polymers: Biomimetics has been a very attractive route for scientists and engineers, since the solutions presented by nature to the arising challenges are real wonders and examples of maximizing functionality with reduced energy and materials. The natural adhesive system of marine mussels is receiving growing interest in the context of biomimetics. Unraveling the secrets of mussels underwater adhesion, mussel-inspired polymers having underwater adhesive and sealant properties and synthetic antifouling polymer coatings are being tested and developed and this field has seen tremendous growth, especially in the past 5 years.16 The following application are briefly discussed below:
1) By incorporating Dopa and analogous reactive groups such as catechols into polymers chains, synthetic biomimetic adhesives, medical polymer adhesives and sealants are being developed.16,17 Bio-mimetic cross-linking polymers having cohesive and adhesive bonding properties is an active area of research.16 Injectable wet medical adhesives capable of bonding or repairing tissues are considered one of the frontier areas in this realm. However, there are still great challenges associated with adhering in the presence
of excess biological fluid, as well as the usual concerns related to the biological response to synthetic polymers.17 Several synthetic and natural medical adhesives are currently used in a number of medical specialties. These include mainly fibrin, cyanoacrylate and gelatin-resorcinol-formaldehyde (GRF) glues.18 However, currently used biocompatible glue like fibrin glue suffers for weak cohesive strength and blood-borne disease transmission is a major concern with this glue. Cyanoacrylate adhesives and gelatin-resorcinol-formaldehyde (GRF) glue have been shown to display higher bond strength but they release toxic formaldehyde on degradation. Mussel glue with its several key properties like ability to solidify rapidly in an aqueous environment, high adhesive and cohesive strength, and versatile ability to adhere toboth inorganic and organic surfaces, appeals use of their mimics as medical adhesives.18
2) Marine biofouling refers to an undesirable process in which the underwater surface becomes encrusted with living organisms and their by-products. Marine biofouling is a huge problem to naval and shipping industry as it decreases the vessel speed and increases fuel consumption. Previous generation antifouling coatings used tributyltin (TBT) which are now prohibited since they were detrimental to non-target organisms and the surrounding environment.19 Current antifouling paints release copper and copper toxicity is under recent scrutiny. Better understanding of marine biological adhesives may help develop antifouling surfaces without having to load the water with toxics and kill the foulers.20 Besides marine biofouling, medical devices coming in continuous contact with biological milieu suffer from nonspecific interaction of cells, proteins and
microorganisms with material surfaces and these interactions can prove highly problematic for device efficacy and safety.21
Figure 4. Biofouling on the hull of a ship increases drag and fuel consumption. The right images show the
wreckage of the Costa Concordia cruise ship after being pulled up. Marine biofouling was evident below
the line of buoyancy after one year and a half of immersion of the ship decks.
The strategy of using mussel adhesive protein mimic can make outstanding surface anchors for antifouling polymers which can control marine biofouling and fouling of medical devices by proteins, cells and bacteria. Although the catechol side chain of Dopa is a powerful anchor for surface coating, but adhesion of mussel byssus is more complicated than a simple catechol-mediated recipe. There is still a long way to go in the field of biomimetics and materials science to really mimic mussel foot proteins to generate the best underwater adhesives, biofouling polymers and universal coatings
The current state of knowledge on the nature and properties of mussel adhesion is based only on limited set of mussel species studied. The overall objective of this research is to gain a better understanding of the molecular basis of adhesion in green mussels so that in the future, this knowledge can be implemented in the design of alternate mussel inspired bioadhesives and targeted anti-fouling strategies. In order to understand mussel adhesion however, there is a need to first characterize the proteins that constitutes the adhesive plaque and are localized near the plaque-substrate interface. To fully understand mussel adhesion, it is essential to understand the time-regulated secretion and interplay between the P. Viridis foot proteins (Pvfps). Pvfp-5 is the first protein to initiate interaction with the substrate, displacing interfacial water molecules and forming adhesive bonds with the substrate.2 Pvfp-3 is subsequently secreted in addition to Pvfp-5, followed by the addition of Pvfp-6 in the last step of plaque deposition.2 Additionally, Pvfps are enriched with cysteine (Cys) and tyrosine (Tyr)/Dopa residues.
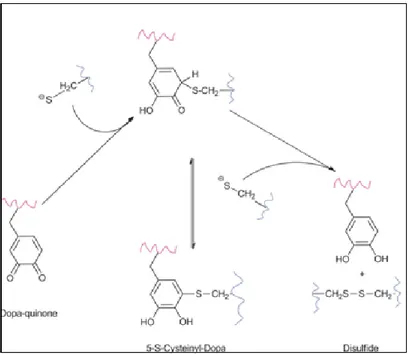
Cys has low pKa, which allows the formation of thiolate at pH 5.5 inside the mussel.
Since thiolates are more reductive than thiols, the thiolates are the operative antioxidant group in mussel foot proteins.22 The mechanism of the dopaquinone reduction to catechol by thiolates is proposed to consist of two steps: (i) nucleophilic attack of quinone by the first thiolate anion to form S-cysteinyldopa adducts; (ii) the thiolether adducts are attacked by a second thiolate anion to form a disulfide and dopa, as depicted in Fig. 5.
Figure 5. Proposed reaction mechanism of the quinone reduction by thiolates.22
Presence of Cys in all known Pvfps and potential of Cys to prevent Dopa oxidation via redox chemistry suggests that the mechanism of adhesion may be significantly different in P. Viridis and that distinction could represent different strategy of underwater adhesion.
Our work was to investigate the adhesive properties of P. Viridis foot proteins, Pvfp-3 and Pvfp-5, which are localized near the plaque-substrate interface, enriched with Dopa and cysteine residues and are the first proteins to be secreted by P. Viridis. Different experiments with varying conditions of pH, ionic strength, adsorption time, concentration, etc., were conducted to study their effect of adhesive properties of these proteins. The surface force apparatus (SFA) measures interaction forces between two surfaces with nano-Newton and Angstrom distance resolution and has enabled precise,
sensitive, and highly reproducible analysis of adhesive properties of mfps. SFA was employed to investigate adhesion properties of Pvfp-5 and Pvfp-3.
(B) Lubricating and surface-protecting mucin proteins
In nature, biological surfaces in motion are common. These surfaces are often surrounded by fluid-film, composed of different biological molecules like proteins, lipids, polysaccharides, etc. Saliva is composed of water and macromolecules that serve as a biological lubricant in oral cavity. Aritcular joints are surrounded by lubricating synovial fluid. Epithelial surfaces of many biological organs and tissues, including mouth (teeth ad tongue), eyes(cornea and eyelids), articular joints(cartilage), and gastrointestinal, respiratory, and reproductive tracts are coated with highly hydrated protein gel called mucus layer.23-26 The function and composition of mucus gel differs at different locations of body but the normal functions ascribed to mucus gel includes lubrication and maintenance of hydrated layer over epithelium, protection against adsorption of unwanted biomolecules, bacteria, and particles, and protection of the underlying tissues against wear.27
Mucus gel contain various proteins and biopolymers. However, the essential and distinctive ingredients are mucins, a class of high-molecular-weight glycosylated proteins whose biophysical properties are due to highly hydrated oligosaccharide sugar side-chains that make up 50%-90% of the molecular weight.28
Figure 6. Structure of (a) a typical mucin subunit showing a central linear glycosylated domain flanked by
globular domains and (b) a mucin molecule composed of subunitslinked linearly by disulfide bonds. Figure
adapted from ref.[28].
Fig. 6 shows different regions in mucin molecule. The terminal regions are very lightly glycosylated, but rich in cysteines, which are involved in disulphide linkages and taking part in intermolecular interactions with other proteins, mainly bonding with other mucins,29 mucin self-association and mucin adsorption on surfaces. Large glycosylated central regions in which half of the amino acids are serine and threonine are saturated with hundreds of O-linked oligosaccharides sugar side chains. Glycosylation involves covalent bonding of carbohydrates (oligosaccharides, sugars) to the polypeptide backbone of proteins. The oligosaccharides sugar side chains make up to 50–90 % of the mucin mass. N-linked oligosaccharides are also found on mucins, but much less abundantly. Glycosylation generally has a major impact on the structure and physiochemical properties of proteins. In mucins, glycosylation is important for their stability, folding, solubility and rheological properties.30
Most oligosaccharides are terminated by sialic acid (pKa∼ 2.6) residues and, along with sulphate groups (pKa∼ 1), they generally give mucins a net negative charge under most physiological conditions. The negatively charged central domain is responsible for the intramolecular repulsion rendering the mucin their expanded bottle-brush structure (Fig. 6).
Mucin molecules play a central role in determining the viscous properties of bodily fluids such as saliva, tears and synovial fluids, and the lubrication of mucosal surface and mucin coated tissues (e.g. saliva coated teeth or cornea wet by tears). Lubrication in the presence of a fluid may occur in one of three regimes (boundary lubrication, mixed lubrication, and hydrodynamic lubrication), and mucins facilitate lubrication in each regime.28All these three regimes of lubrication can be conveniently visualized in a Stribeck curve, in which coefficient of friction is plotted as a function of shear velocity and fluid viscosity (Fig. 7).
Boundary lubrication occurs when the two surfaces are in close contact due to high contact pressure and shear velocity and fluid viscosity are low. Surface interactions are dominated by the contacting monolayer or multilayer films of the boundary lubricant and repulsive forces between adsorbed layers carry the load and prevent adhesion between contacting asperities thus lowering the overall friction.28,30 For being an effective lubricant in this regime, a lubricant molecules should either tightly adhere to the surface to avoid being sheared away or re-adsorb quickly enough from solution to replace elements of surface layer that have been sheared off.28
Figure 7. Friction coefficient plotted as a function of fluid viscosity and shear velocity divided by load
(Stribeck curve) with corresponding lubrication film thickness. The schematic shows boundary, mixed, and
hydrodynamic lubrication regimes. Figure adopted from ref.[28].
In mixed mode lubrication, the formation of the fluid film results in corporately lower friction than at the boundary condition but some contacting surface asperities cause friction. Hydrodynamic lubrication occurs at high speed regime and the surfaces are fully separated by fluid film. The pressure which supports the separation of surface originates from the change in viscosity of the lubricant at high speed.
Mucins are highly surface active molecules and are able to adhere to wide variety of surfaces depending on substrate chemistry, substrate charge, solution concentration and ionic strength.28 Hydrophobic residue in the terminal domain of mucins have proven to be of paramount importance for the boundary lubrication properties of mucins between hydrophobic surfaces. Mucins adsorb onto hydrophobic surfaces with characteristic 'bottle-brush' structure, where the hydrophobic moieties in the polypeptide backbone of
mucins form anchoring bonds with surface via hydrophobic interactions and hydrophilic glycosylated regions stretch to bulk water.31 Adsorption and lubrication by mucins are not restricted to hydrophobic surfaces, and have also been reported for hydrophilic surfaces.32 Surface adsorption and lubrication studies have been studied most extensively. Surface force apparatus was initially used to study properties of adsorbed mucins at solid-liquid interface.33,34,35 Atomic force microscopy (AFM) was used to image the molecular shape, size and morphology.36,37 Optical waveguide lightmode spectroscopy (OWLS)38,39 and ellipsometry40 were used to determining the mass of surface adsorbed mucin. Tribological studies of mucins have been performed under many different conditions, at both macro- and micro scale, mainly using a pin-on-disc (PoD) tribometer, a mini traction machine (MTM), colloidal force microscopy or an SFA.39,41,42
Due to the their relevance to food industry, bovine submaxillary mucin (BSM) and porcine gastric mucin (PGM) are some of the most extensively studied mucins. BSM is extracted from the fresh salivary glands of cows and PGM is isolated from the lining of the stomach of pigs. Submaxillary mucins secreted in saliva, lines teeth, tongue, and palate, and interacts with food, external liquids, and air, while gastric mucins protect the stomach from attack by digestive acid and enzymes. These mucins from bovine and porcine sources have several potential biomedical applications. However, high molar mass, polydisperse nature and presence of contaminants in mucins have always complicated their controlled study. Aggregation and adsorption properties of BSM and PGM differ widely as well as their ability to reduce friction are different, but they do
share important similarities that are favorable for lubrication. Boundary lubrication provided by these mucins is due to their high level of glycosylation, their ability to adsorb strongly to a broad range of surfaces and the presence of steric repulsion between their adsorbed layers. However, role of hydration, effect of varying pH and ionic strength on lubricating properties of mucins is not very well understood. Also mechanical wear is of practical concern for many biological surfaces where mucins are present. However, little is understood about the relationship between friction and wear, and how mucins prevent wear in biological systems.
Mucins are particularly studied for possible application in biomedical engineering that require a high degree of control over the tribological performance of sliding systems, as a quality of life could be reduced significantly in case of excessive friction and wear of the running surfaces. Mucins are lubricious, biocompatible, show good adhesivity and form hydrogels. These features are of potential benefit in medical coating applications. Mucins can be directly incorporated into the surfaces of existing biomedical devices and can also serve as excellent model for biomimetic design of synthetic polymers, such as brush forming co-block polymers that are able to both adsorb onto surfaces and retain water. Interest in aqueous lubrication has recently been growing due to its high relevance in biological tribosystems and potential biomedical applications such as knee and hip joint implants, catheters, and endoscopes, where traditional engineering lubricants (e.g., petroleum-based mineral oils and greases) are excluded because of biocompatibility issues. Bio-compatible coatings for artificial bone implants can improve surgical
recovery times, life span of an implant and reduce the need for revision surgery. The possibility of using these unique property of mucins for creating novel mucin-based biomaterials and in areas of drug delivery has gained lot of interest.
In this thesis we considered BSM and PGM. Commercially available BSM contains contaminants (e.g Bovine serum albumin (BSA)). The aim of study on BSM was to investigate influence of pH on interaction between BSM coated surfaces across aqueous media using SFA, in which purified BSM was used in order to understand the interaction free from other biomolecules. Also, aggregation of mucins, especially acid-induced aggregation, has been actively studied with PGM, but the influence of acidic medium on BSM is very rare in literature, and was studied using SFA and dynamic light scattering (DLS). The nanoscale mechanism of surface force generation by adsorbed mucin layers were studied, which underlie surface-protecting and lubricating properties.
Due to the molecular nature of mucin, it interacts with most substances including cationic biopolymers. Cationic polymers such as chitosan and some synthetic polymethacrylates have been reported to show excellent mucoadhesive performance. Polycation polyethylenimine (PEI), due to its strong interation with mucins has emerged as the choice transgene delivery agent or transfection reagent and have been extensively used in medicine industry due to its suitable characteristics for variety of biomedical applications. However, interaction of branched PEI (b-PEI) with mucin glycoproteins and its impact on lubricating properties of mucins were unexplored. Lubricating properties of PGM are known and PGM exhibits effective boundary lubrication under specific conditions of
acidic pH. Since acidic pH conditions are less relevant to applications in the areas of biomedical sciences, the specific objective of this work on PGM was enhancing its lubricating properties via its synergistic complexation with b-PEI in neutral pH conditions.
References
[1] Ditsche, P.; Summers, A. P. Beilstein J. Nanotechnol.2014, 5, 2424–2439.
[2] Petrone, P.; Kumar, A.; Sutanto, C. N.; Patil, N. J.; Kannan, S.; Palaniappan, A.; Amini, S.; Zappone, B.; Verma, C.; Miserez, A.; Nature comm.2015, 6:8737.
[3] Waite, J. H. Chem. Industry, 1991, 2, 607–611. [4] Waite, J. H. Ann. NY Acad. Sci., 1999, 875, 301–309.
[5] Nishida, A.; Ohkawa, K.; Ueda, I.; Yamamoto, H. Biomolecular Engineering, 2003, 20, 381-387.
[6] Hwang, D.S.; Zeng, H.; Masic, A.; Harrington, M. J.; Israelachvili, J.; Waite, J. H.
Journal of Biological Chemistry 2010, , 285, 25850–25858.
[7] Houwink, R.; Salomon, G. Adhesion and adhesives. 2nd Ed. Vol. 1. Amsterdam (The Netherlands): Elsevier; 1965.
[8] Miller, D. R.; Das, S.; Huang, K.; Han, S.; Israelachvili, J. N.; Waite, J. H. ACS
Biomater. Sci. Eng. 2015, 10, 1021.
[9] Wilker, J.J. Nature Chemical Biology2011, 7, 579–580.
[10] Yu, M.; Hwang, J.; Deming, T. J. J Am ChemSoc, 1999, 121, 5825–5826.
[11] Lee, H. S.; Scherer, N. F.; Messersmith, P. B. P Natl AcadSciUSA, 2006, 103, 12999–13003.
[12] Danner, E.; Kan, Y. J.; Hammer, M.; Israelachvili. J. N.; Waite, J. H. Biochemistry, 2012, 51(33), 6511–6518.
[13] Waite, J. H. Comp BiochemPhysiol B Comp Biochem, 1990, 97, 19–29.
[14] Yu, J.; Wei, W.; Danner, E.; Ashley, R. K.; Israelachvili, J. N. Nat ChemBiol, 2011, 7, 588–590.
[15] Menyo, M. S.; Hawker, C. J; Waite. J. H. Soft Matter, 2013, 10314.
[16] Matos-Pérez, C. R.; White, J. D.; Wilker, J. J. J. Am. Chem. Soc.2012, 134, 9498−9505.
[17] Lee, B. P.; Messersmith, P. B.; Israelachvili, J. N.; Waite, J. H.Annu Rev Mater
Res.2011, 41, 99–132.
[18] Lee, B. P.; Dalsin, J. L.; Messersmith, P. B. Biological Adhesives, (ed. by A.M. Smith and J.A. Callow), 2006, Springer-Verlag Berlin Heidelberg.
[19] Magin, C. M.; Cooper, S. P.; Brennan, A. B. Materialstoday 2010 , 13(4), 36-44. [20] Wilker, J. J. Current Opinion in Chemical Biology 2010, 14, 276–283.
[22] Yang, J.; Cohen Stuart, M. A.; Kamperman, M. Chem. Soc. Rev., 2014, 43, 8271. [23] Perez-Vilar, J.; Hill, R. L. J. Biol. Chem.1999, 274, 31751−31754.
[24] Dekker, J.; Rossen, J. W. A.; Buller, H. A.; Einerhand, A. W. C. Trends Biochem.
Sci.2002, 27, 126− 131.
[25] Bansil, R.; Turner, B. S. Curr. Opin. Colloid Interface Sci.2006, 11, 164−170. [26] Hoorens, P. R.; Rinaldi, M.; Li, R. W.; Goddeeris, B.; Claerebout, E.; Vercruysse, J.; Geldhof, P. BMC Genomics2011, 12, 140−151.
[27] Zappone, B.; Patil, N. J.; Madsen, J. B.; Pakkanen, K. I.; Lee, S. Langmuir 2015, 31, 4524−4533.
[28] Coles, J. M.; Chang, D. P.; Zauscher, S. Current Opinion in Colloid & Interface
Science2010, 15 406–416.
[29] Madsen. J. B. Investigation of the surface adsorption and biotribological properties of mucins, Ph. D. Thesis, July-2014.
[30] Thornton, D. J.; Rousseau, K.; McGuckin, M. A. Annual Review of Physiology2008,
70, 459-486.
[31] Malmsten, M.; Blomberg, E.; Claesson, P.; Carlstedt, I.; Ljusegren, I. J Colloid
Interface Sci1992, 151, 579–90.
[32] Pettersson, T.; Dedinaite, A. J. Colloid Interface Sci.2008, 324 , 246-256.
[33] Proust, J. E.; Baszkin, A.; Boissonnade, M. M. C R AcadSciSer Ii1982, 294, 1325–8. [34] Perez, E.; Proust, J. E.; Baszkin, A.; Boissonnade, M. M. Colloids Surf1984, 9, 297– 306.
[35] Perez, E.; Proust, J. E. J Colloid Interface Sci1987, 118, 182–91.
[36] Hong, Z. N.; Chasan, B.; Bansil, R.; Turner, B. S.; Bhaskar, K. R.; Afdhal, N. H.
Biomacromolecules2005, 6, 3458–66.
[37] McMaster, T.J.; Berry, M.; Corfield, A. P.; Miles, M. J. Biophys J1999, 77, 533–41. [38] Horvath, R.; McColl, J.; Yakubov, G. E.; Ramsden, J. J. J Chem Phys2008, 129, 071102.
[39] Lee, S.; Muller, M.; Rezwan, K.; Spencer, N. D. Langmuir2005, 21, 8344–53. [40] Nikonenko, N.A.; Bushnak, I.A.; Keddie, J.L. ApplSpectrosc2009, 63, 889–98. [41] Harvey, N.M.; Yakubov, G. E.; Stokes, J. R.; Klein, J. Biomacromolecules2011, 12(4), 1041-1050.
CHAPTER 1
Background, Methods and Materials
A polymer, from a physicist's point of view, is a set of units, called monomers, connected linearly as a chain.1 Biopolymers like DNA, proteins as well as real polymers are essentially long chain molecules that are formed by chemically bonding monomers. Unstructured proteins can be viewed as linear assemblies of amino-acids and some protein properties can be measured and understood using experimental methods and ideas developed in polymer physics. This chapter introduces the basic theoretical concepts of polymer physics and describes the methods used to characterize proteins diffusing in solution and adsorbed on solid surfaces. The Surface Force Apparatus at CNR-Nanotec will be described in some detail as the results obtained during this thesis were the first to be published using this technique. Because we considered proteins that are secreted in a water-based extracellular environment, the role of water and electrolytes in protein conformation, adsorption and surface adhesion will also be briefly reviewed.
1.1 Statistical models of polymer chains: the ideal chain
The simplest model for the statistical theory of polymer chain conformation treats the molecule as a chain of N+1 rigid subunits or “monomers” with the same mass and length, joined by N perfectly flexible hinges. The position of ith monomer unit is given by the position vector Ri
vectors {ui} = (u1, u2, ...., uN) with length l(Fig. 1.1).2 The end-to-end distance vector
connects the chain ends:
Figure 1.1.Model polymer chain
∑
NN 0 i
i=1
R = R - R = u (1.1)
and reaches the maximum value RMAX = Nlwhen the chain is fully extended. Since the
chain can extend in any direction, the mean value ofR is zero. Instead we consider the mean square end-to-end distance, R . 2
2 1 1 1 1 N N N N i j i j i= j= i= j= = = ⋅
∑
∑
∑∑
R u u u u , (1.2) 2 2 1 1 1 , 1 N N N N i j i i j i j i i j i j = = = = ≠ =∑∑
⋅ =∑
+∑
⋅ R u u u u u . (1.3)The size of the chain can also be characterized by the radius of gyration Rgdefined as:
2 2 1 1 ( ) 1 n g i CM i R N = = − +
∑
R R . (1.4) where Ri and RCM are the position vectors of the i-th monomeric unit and center of mass. If the chain is freely joined and there is no restriction on the orientation of one segment
with respect to its neighbor, u ui⋅ j =0 for i≠ , and j ui2 =l2. Therefore Eq. 1.3 becomes: 2 2 2 1 N i MAX i Nl R l = = =
∑
R = u . (1.5)so that the size R, measured by the root mean square (rms) end-to-end distance of a polymer, depends on its length N as,
,
R∼lNν (1.6)
where
ν
=1 / 2 for the freely jointed chain (FJC) (Fig. 1.2). The exponent ν is called thesize exponent.1
Figure 1.2: Representation of freely jointed chain for a polymer with rigid bonds and full free rotations.
The beads and bonds may cross without any penalty.1
For FJC, the radius of gyration is
1/2 2 6 g Nl R =
. Thus the average radius of gyration can be written as:
2 2 2 6 6 = = g R Nl R (1.7)
1.2 Freely rotating and worm-like chains
The freely jointed chain model can be adapted fairly easily to somewhat more realistic chains with orientational correlation between successive bonds. Consider a polymer chain having a sufficiently long backbone consisting entirely of N single bonds of fixed bond length land fixed bond angle φ, but with free rotation around any of the single bond. The complementary angle θ will be equal to θ =180 −φ. In this case the scalar product of
the vectors u ui⋅ j along the chain will be given as: 2
cos cos 0
i⋅ j =u ui j φ =l φ≠
u u . (1.8)
We substitute the second term on the right side of Eq. 1.3 with Eq. 1.8 to obtain R of 2
the freely rotating chain:
2 2 2 , , 1 cos N i j i j i j Nl l φ = ≠ = +
∑
RSince cosφi i, 1+ =cosθ, cosφi i,+2 =cos2θand cosφi i k,+ =coskθ
2 2 2 2 2 2 , 1 1 1 1 1 cos 2 cos 2 cos 1 cos N N i N N i k i i k i k i k Nl l φ Nl l θ Nl θ θ − − + = = = = + = + = + ≈ −
∑∑
∑∑
R (1.9)The freely rotating chain in the limit of small bond length, l→0, and bond angle close to zero, φ→0, is called worm-like chain (WLC), because it looks like an infinitely thin
chain of a continuous curvature. The worm-like chain has the defined value of contour length, cos 2 MAX R =Nl φ .
1.3 Kuhn length and persistence length
At length scales equal or smaller than the monomer length l, the polymer chain is considered rigid. In many situations, the flexibility of a polymers is not very noticeable below a certain length lK > known as effective length or Kuhn length. Over a length l
scale larger thanlKthe polymer flexibility becomes noticeable. The Swiss physical
chemist Werner Kuhn (1899-1963) first used the concepts of statistical mechanics to understand polymers and he suggested the idea of effective/Kuhn length. A molecule of contour length scontains Neff =s l/ KKuhn segments. Since Kuhn segments are nearly independent, we can imagine they are freely jointed, and use Eq. 1.5:
2 2 2 2 ( / ) eff K K K K N l s l l s l = = = = ⋅ R R . (1.10)
Eq. 1.10 gives the length of the effective Kuhn segment. The Kuhn length for real polymers ranges from about 1 nm for simple synthetic chain to about 100 nm for DNA. Notice that the bond vector l considered in section 1.1 is exactly the Kuhn length of the ideal freely-jointed chain. Also, a rigid linear molecule or rod of length lR can be
considered as a polymer with Kuhn length lK >> . lR
The persistence length, lP, is defined as the distance along the molecule beyond which
1.3 shows two points on the chain separated by contour length s. Since the chain flexes, the tangent vectors at two points are generally different. The angle between them is γ(s).
Figure 1.3. Diagram explaining the concept of persistence length: the angle between the tangents of two
points contour distances apart is γ.
If s is reasonably large, the expectation value of the cosine of the angle falls off exponentially with distance,1
( / )
cos ( )γ s =
e
− s lP (1.11)where lPis the persistence length. If s<< , Eq. 1.11 gives lP cosγ ≈1and the angle
fluctuates around zero, whereas if lP << , thens cosγ ≈0. Thus, γ can be anything between 0 to 180 with equal probability. Thus for lengths greater than lP, the correlation
in orientation of segments is lost. If lp > s, the chain behaves like a stiff rod.
1.4 Non-gaussian behavior and simple Flory theory
This section has been developed mainly basing on ref.[1]. The FJC is also known as ideal chain since it is characterized by Gaussian behavior. It also goes by the name of Gaussian
polymer or non-self-interacting polymer. The excluded volume makes the real chains non-ideal.
Figure 1.4. Excluded volume of a sphere. The sphere of radius ds indicated by dashed line is the space not
available to the center of sphere B.
The dimension of real chain is different than that of the ideal chain of the same contour length. In a real polymer, interactions between monomers close to each other in space cannot be neglected (Fig. 1.4). By introducing the repulsive interaction of the monomers, e.g., the thermal excluded volume interaction, we go beyond the Gaussian behavior. The fact that monomers cannot interpenetrate is taken into account by considering hard-wall repulsion, that is proportional to the excluded volume vexe of each pair of monomers,
times the number of monomer pairs (N2) per unit of available volume (R3), that is repulsive energy ∼vexe N32
R (1.12)
The entropy of the chain is given by 2 2 ( ) log ( , ) ~ N B S R k P R R l N N = − , (1.13)
where
P R N
( , )
is the probability distribution of the end-to-end distance to be Gaussian,B
k is the Boltzmann constant. The free energy of a polymer chain of N monomers with
excluded volume interaction if it had size of radius R at temperature T is equal to,1
2 2 0 0 2 1 3 ( ) N exe R N F R F e e v Nl R = + + , (1.14) 0
e and e are T-dependent constants and 1 F is the remaining part of the free energy. The 0 size of the unconstrained polymer comes from a minimization of F R with respect to R N( ) which has the form of Eq. 1.6, but with ν = 3/5 instead of 1/2. This ν is called the Flory exponent.
1.5 Surface forces and general theory of molecular interactions
in aqueous medium: the DLVO theory
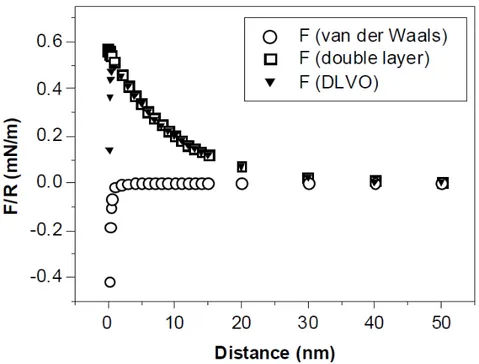
Surface forces and interactions relevant to biopolymer systems in an aqueous environment can be quantitatively described using the DLVO theory of colloidal stability that is named after Derjaguin, Landau, Verwey and Overbeek. DLVO theory was initially developed to describe interactions between colloids in liquids which assumes that the interaction forces can be approximated by a superimposition of van der Waal attractive forces and electric double layer repulsive contributions.
For charges of same sign in liquid medium, the DLVO theory predicts repulsion at large separations originating from so-called double-layer of co-ions and counterions, whereas attractive van der Waals attraction becomes more significant at shorter distances.
Increasing the electrolyte concentration of the medium causes shielding of the electrostatic repulsion, and the balance between the DLVO forces can be altered towards the van der Waals attraction between the interacting bodies.
Figure 1.5. Contributions of the van der Waals and the electrostatic double-layer forces to the total DLVO
interaction. Calculated according to equations 1 and 4.3
van der Waals forces
The van der Waals forces consists of three different types of forces that originate from time-dependent dipoles in atoms or molecules. They include contributions from forces between two permanent dipoles (Keesom forces), forces originating from permanent dipole-induced dipole interactions (Debye forces) and forces due to interaction between spatially fluctuating electron cloud distribution (London forces).
The detailed description of van de Waals forces can be found in the textbook of Israelachvili.4 The non-retarded van der Waals force (FvdW( ))D between two spheres of
radius and is 1 2 2 1 2 ( ) 6 H vdW A R R F D D R R = − ⋅ + (1.16)
where A is Hamaker constant and D is the distance between interacting surfaces.H
5
van der Waals force F between crossed cylinders of radius R, as in the case of SFA, is same as the force between sphere of radius R and a flat plane surface. According to
Derjaguin approximation, this force equals the free energy E of interaction per unit area
between two plane parallel plates of the same material.4 Specifically, F =2
π
RE where R is the geometric radius of curvature of the surfaces. For this reason the force F(D) measured by SFA is generally plotted as F/R and is therefore implicitly related to the interaction free energy E(D) per unit area between parallel plates. For mica interacting across vacuum or air, the Hamaker constant, 2010 10
H
A = × − J.4 Mica was used as the substrate in all the SFA experiments performed in this work.
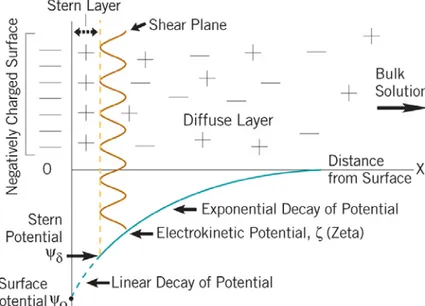
Electrostatic double-layer forces
Near the charged surface there is an accumulation of counterions and depletion of co-ions. The co- and counterions together with charged surface are called the electric double-layer. The electrostatic double-layer forces are always present between charged surfaces in water, due to water dissociation (H2O ↔ H++OH-). The electrostatic
larger than the Debye length, κ-1
, that depends on dielectric properties (ε) and the ionic strength (I) of the medium.
1 0 2 , B k T e I εε κ− = 2 i i i I =
∑
c Z (1.17)where ε0is the permittivity of the vacuum, e is the unit charge, c is the bulk i
concentration and Z is the valency of the ion i
i
, summing over all ions present. As can be seen from equation (1) the Debye length is shorter at higher ionic strengths. For monovalent ions in aqueous solution at 25º C, the Debye length is given by:1 0.304 , C κ− ≈ i i C=
∑
c (1.18)where C is concentrations of ions and κ−1
is in nanometers.
The electrostatic double layer force (FDL( ))D between two spheres of same material with radius R and 1 R at low surface potentials 2
ψ
< 25 mV, can be expressed as: 42 1 2 0 1 2 ( ) 4 D DL R R F D e R R κ π εε κψ − = + (1.19)
where ε is dielectric constant and κ is the reciprocal of Debye length (Eq. 18). In the limit of small surface potential
ψ
, the following equation due to Grahame can be used to linkψ
with the surface density of charges σ, 20 0 2 ( i i) i i kT σ = εε
∑
ρ −∑
ρ∞ = 0/ 0 0 2 ( Z ei kT 1) i i kT e ψ εε∑
ρ − − , where 0/ 0 i Z e kT i ie ψ ρ ρ − ∞= is the ionic concentration of ions at
1.6 Protein studies with the surface force apparatus
The SFA was first implemented by Tabor and Winterton,6 further developed by Tabor and Israelachvili,6 and later modified by Israelachivili and Adams6 to measure surface forces in fluids. SFA enabled the direct measurement of static and dynamic forces between surfaces as a function of their separation. It provided the first direct experimental verification of the DLVO theory for surface interacting in dilute electrolytes as well as surface hydration and hydrophobic forces, and has been successfully used to study polymers and proteins,9,10 notably mucins.11,12 The following section describes the SFA technique which was predominantly used to acquire most of the experimental data presented in this work. It is follows by the description of experimental protocol, procedure of force measurements and distance measurements in the SFA technique. In this thesis we used a SFA Mk III distributed by Surforce LLC, USA (Fig. 1.6, 1.7). The setup was developed in 1985-1989 by Isrealachvili and McGuiggan.13 SFA distinguishes itself from other nanoscale measurement instruments like Atomic Force Microscope (AFM) by its ability to measure distance over several orders of magnitude ranging from Angstrom level up to tens or even hundreds of microns. Unlike AFM, SFA measures forces between two surfaces rather than between surface and tip. Distance between two surfaces can be controlled using series of motors and actuators.
Section 1.6.1 describes SFA design and differential and fine micrometers with which SFA Mk III is equipped. SFA measurements were carried out on mica surfaces. Section 1.6.2 deals with the properties of muscovite mica, which was used as the substrate in all
SFA experiments. Multiple-beam interferometry is used to directly measure distance D between two macroscopic cylindrical surfaces arranged in crossed-cylindrical geometry. Section 1.6.3 describes the lens and sample configuration and equations that were used to calculate D using three-layer interferometer typically used in SFA setup. Sections 1.6.4 and 1.6.5 deal with experimentally measuring normal forces using SFA and experimental procedures, respectively.
1.6.1 SFA design
The photograph and the schematic drawing of SFA Mk III is shown in Fig. 1.6 and Fig. 1.7, respectively.
Figure 1.6. Photograph of SFA Mk III with optics stand.
The apparatus consists of two units: an upper (control) chamber comprising the surfaces, distance controls and force measuring springs and a lower (bathing/liquid) chamber
which acts a simple bath that can be filled with liquid. The base of the upper chamber is coupled to the lower chamber and the design is such that the lower chamber is completely sealed from the mechanical controls of the upper chamber.
Figure 1.7. Schematic drawing of SFA Mk III showing key parts.
The basic idea underlying the SFA technique is the direct measurement of forces by the bending of cantilever springs to which the sample surfaces are attached. The lower surface is attached to a double cantilever spring with elastic constant k. A multiple-beam interferometry (Section 1.3.4) is used to directly measure D and the deflection L of this force-measuring springs, that is proportional to the normal force F=kL acting on the surfaces. The upper surface is attached to the piezoelectric crystal tube that is in turn rigidly connected to the upper frame of the SFA. Since the piezoelectric tube can be
moved laterally and rotated before it is clamped tightly to the upper frame of the apparatus, the upper surface can actually be moved, which helps in making optical adjustments and finding and changing the contact position.
To meet the goal of high positioning accuracy with large enough travel range of few millimeters necessary to mount the surfaces, the surface separation in SFA Mk III is controlled by the four-stage distance control mechanism which is carefully tuned to provide necessary range and resolution.13 In a typical experiment, the upper surface can be displaced by using a piezoelectric element, while the lower surface is mounted at the end of the double cantilever spring that can be moved to bring the surfaces to a given separation. Double cantilever springs are preferably used over single leaf springs in order to minimize the tilting and/or sliding between the surfaces when the spring is deflected.14 There are three mechanical distance controls to control the movement of the lower surface. Both a coarse and a differential micrometer act as coarse controls, while the third distance control is via a differential spring mechanism. Here a helical spring is compressed by a motor-driven non-rotating micrometer. The final, fourth distance control is non-mechanical control in which the upper surface is displaced by applying a voltage across the piezoelectric tube. Table 1.1 summarizes the operating principle, range, and resolution of the four distance controls.
The three micrometer controls, M1, M2 and M3 in Table 1.1 are conveniently positioned for manual control, but any one of them can be controlled by a variable-speed reversible
DC motor. The displacement of the spring in M3 can be measured from a encoder attached to the top of M3.
CONTROL OPERATION RESOLUTION RANGE
Normal micrometer (M1) Manual 500 nm ±3mm
Differential micrometer (M2) Manual 50 nm ±50 µm
Differential spring (M3) DC-motor 1 nm ±2.5 µm
Piezo control High voltage <0.1 nm ±0.5 µm
Table 1.1 Distance controls in the SFA Mk III
1.6.2 Mica surfaces
In the typical SFA experiment, two mica sheets with equal thickness T ranging from 1 to 5 micron are glued to cylindrical silica lenses. Mica has been the choice material for SFA studies over the past 20 since its introduction by Bailey and Courtney-Pratt15 due to its unique properties. It is relatively easily cleaved into large thin sheets of a very uniform thickness with an area of several square centimeters. The surface of the cleaved mica is so smooth that is called "atomically smooth" substrate. Furthermore, mica is transparent, flexible, has a high shear and tensile strength, and is chemically inert in most liquids. Thin cleaved mica sheets placed on a base sheet are mechanically and chemically stable to withstand further handling and processing.Cleaving of defect free sheets can be achieved by inserting a sharp tip of pointed tweezers into a thick sheet of muscovite mica. Once thinned down to desired thickness by repeated cleavage, small rectangular sheets (10 X 10 mm2 in size) are cut out by melt cutting by using a hot platinum wire of
diameter 0.2 mm. Melt cutting is used to avoid mica flakes that readily deposit of freshly cleaved mica.
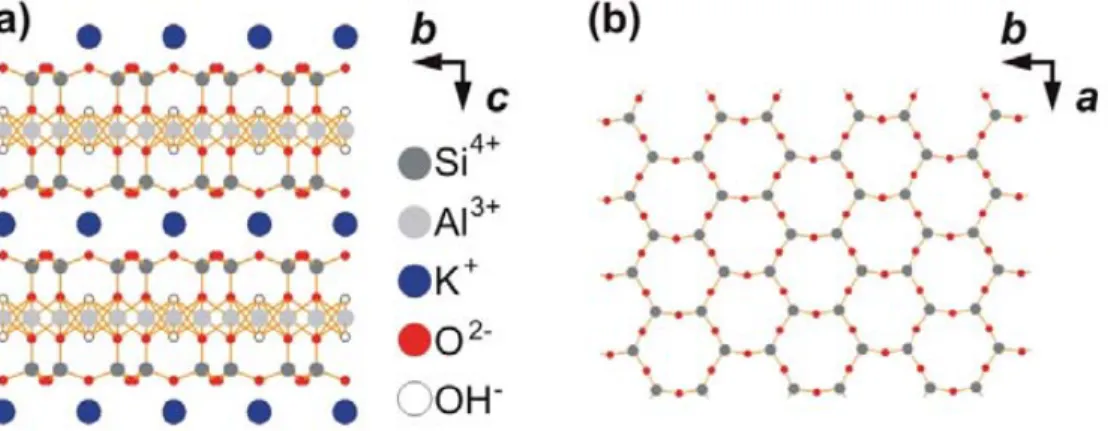
Mica is a crystal belonging to the family of layered silicates (Fig. 1.8). SFA experiments generally use the most abundant variety of mica with chemical composition: KAl2(AlSi3)O10(OH)2.The covalently bound alumosilicate layers are separated by
potassium ions. The basal plane, presented in Fig. 1.8(b), is composed of SiO4 and AlO4
tetrahedrons linked by their corners. In the basal plane the ratio of silicon to aluminum is 3:1. Thus, roughly 25% of tetrahedrons has aluminum central atoms. Since aluminum carried formal charge of +3 vs. +4 of silicon, the
Figure 1.8: Schematic representation of the muscovite mica crystal structure. Vectors a and b define the
{001} planes, vector c is the surface normal vector. (a) Side-view (projection onto the a-axis) exhibiting
aluminosilicate layers separated by electrostatically bound interlayer potassium ions. (b) Hexagonal
arrangement of the {001} surface top layer (projection onto the c-axis) exhibiting Si (partly Al) and O
atoms of a cleaved mica surface, residual potassium ions are not displayed. Figure adapted from ref. [16].
replacement of the silicon by aluminum atoms create negative lattice charge, which is compensated by the K+ ions between aluminosilicate sheets, as shown in the model
structure of Fig.1.8(a).16 These K+ are only bound electrostatically. This ionic binding between potassium and oxygen is much weaker than the covalent bonds between the aluminosilicate layers, and muscovite mica can therefore be cleaved along the basal plane creating molecularly smooth, defect-free surfaces.17 Upon cleavage along the basal plane the potassium ions are evenly distributed between the two new surfaces, which have zero net charge. It has been claimed that upon cleavage the atomic structure of the aluminosilicate layers is undisturbed while the potassium layer is disrupted.18 Therefore, a cleaved mice surface exhibits a hexagonal arrangement of Si (partly Al) and O atoms, as illustrated in Fig. 1.8(b).
If the mica sheet is immersed in water or other polar solvents, the potassium ions dissociate rendering the surface negatively charged the total number of negative lattice sites on the mica basal plane correspond to one negative charge per 48 A˚ 2 or 2.1 x 10¹⁴ charges per cm2 when complete dissociation occurs. Hence, the hydrophilic nature of mica surface.
Muscovite mica is a monoclinic crystal, is optically biaxial and thus has three principal indices of refraction. Two of them, β and γ are within the cleavage plane and typical values for the refractive indices are as follows:
5 5 1.5846 4.76 10 / γ µ = + ⋅ λ (Ǻ), 1.5794 4.76 10 /5 5 β µ = + ⋅ λ (Ǻ), giving 5 5 1.5820 4.76 10 / mean µ = + ⋅ λ (Ǻ) (1.20)
for red and brownish micas, and
5 5 1.5953 4.76 10 / γ µ = + ⋅ λ (Ǻ), 5 5 1.5907 4.76 10 / β µ = + ⋅ λ (Ǻ), giving
5 5
1.5930 4.76 10 /
mean
µ = + ⋅ λ (Ǻ) (1.21)
for greenish micas.
By using the appropriate values of refractive index of mica together with the equations derived for three-layer interferometer (see section1.6.3), the distance D between two surfaces and the medium refractive index µ can be determined. .
SFA III measures the forces between two surfaces in vapors and liquids with a force sensitivity of 10 nN and a distance resolution of 0.1 nm. Optical interferometry also provide a measure of radius of curvature R, refractive index of the medium between two surfaces, surface deformations arising from surface forces, molecular orientations in thin films, dynamic interactions like viscoelastic and frictional forces, and other time-dependent phenomenon in real time.
1.6.3 Distance measurements: multiple-beam interferometry
Optical interferometry provides a method for measuring the thickness and refractive index of transparent thin films.19 Immediately after cleaving and cutting, mica sheets are placed face down onto the baking sheet. After less than 48 h, they are coated with a 55 nm layer of silver using thermal evaporation or chemical sputtering technique. This thickness of silver coating gives a good compromise between sharpness and intensity of the interference fringes.
The distance between two surfaces and the refractive index of the film confined between two mica sheets is measured by monitoring the fringes of equal chromatic order (FECO)
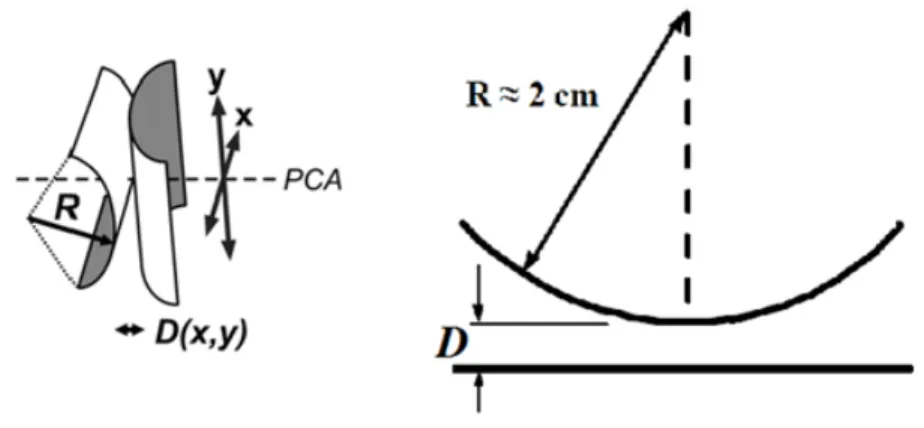
using a spectrometer. Identically thick and flat mica sheets, each coated with a thin reflective layer of silver, glued onto two cylindrical glass support discs in a crossed-cylinder orientation (Fig. 1.9) imitates a single asperity contact know as the point of closest approach (PCA).
Figure 1.9. Geometry of two crossed cylinders used in SFA. Note that this contact geometry is equivalent
to a sphere of radius R approaching a flat surface.
The protein coated discs are placed in cross cylinder geometry and the measured radius of curvature for each contact position is used to normalize the measured force, F(D) to enable quantitative comparison between different contact positions and experiments. The force F(D) measured between two curved surfaces can be directly related to energy per unit area W(D) between two flat surfaces at the same separation, D, using Derjaguin approximation20 under the assumption that D is much smaller than the radius of curvature R (D << R), ( ) ( ) 2 F D E D R π = ⋅ . (1.22)
Furthermore, the partially reflective silver mirrors at the back side of the mica surfaces together with the intervening medium forms a symmetrical three-layer interferometer, as shown in Fig. 1.10.
Figure 1.10. Example of spectral images with surfaces (a) in compressed contact and (b) with surfaces
separated. To the left of panel a and b is the illustration of interferometer. White light collimated and shone
through the assembled interferometer transmits whole-order wavelengths called fringes of equal chromatic
order (FECO).
When the white light is passed through the surfaces, a discrete set of wavelengths is transmitted, corresponding to constructive interference in the interferometer. When the two mica surfaces are in direct adhesive contact in air (D = 0) the wavelengths 0
n
λ are recorded, where n =1,2,…is the chromatic order. When the surfaces are separated by a distance D, the transmitted wavelengths are red-shifted according to the formula
0 0 0 1 2 0 0 0 2 1 2 sin[ (1 / ) / (1 / )] 2 tan (1 ) cos[ (1 / ) / (1 / )] ( 1) D n n n n D D n n n n n D µ π λ λ λ λ πµ λ µ π λ λ λ λ µ − − = − − + − − ± − (1.23)
where the sign "±" refers to the odd or even fringe order, respectively andµ µ= mica /µ, where µmicais mica the refractive index and µ is the medium refractive index at D
n
λ . The order is given by the formula:
0 1 0 0 1 n n n n
λ
λ
− −λ
= − . (1.24)By using Eq. 1.23 and 1.24, both D andµof the medium can be determined independently by measuring the wavelengths of at least two odd and an even fringes. The distance D is generally measured by following the motion of an odd fringe throughout the experiment because D
n
λ does not depend on
µ
for small values of D. Using this technique,the accuracy on D is often as good as 1 Α
.
Mica has properties of a negative biaxial crystal.21 In SFA, direction of light propagation coincides with the axis α of refractive index of mica (Fig. 1.11) and when the crystallographic axes of the two mica sheets are parallel to each other, λγ > λβ and the resulting FECO appears as doublet (Fig. 1.11a). Whereas, when the crystallographic axes of the two mica sheets are perpendicular to each other, λγ = λβ and FECO appears as
Figure 1.11.Schematic representation of FECO observed for (a) parallel and (b) perpendicular orientation
of the crystallographic axes of mica sheets.
Simultaneous recording of at least one pair of odd and even fringes allowed to determine the refractive index n averaged acrossthe surface separation D. In the presence of a solute in a liquid film with known refractive index nC, the average solute concentration c can be
calculated as c=(n-nc)(dn/dc).22
1.6.4 Normal force measurements
Normal forces are measured by moving one of the surfaces by an amount
∆
z
using one of the actuators (micrometers or piezo) while monitoring the change in surface separation ∆D which is measured by MBI. The deflection of the double cantilever spring is L=∆
z
-D
∆
and the change in force between surfaces is simply given by Hooke's law,( )
F k z D kL
When the surfaces are separated by a large distance, ∆F= 0, since
∆
z
=∆
D
and thesurface position z (in arbitrary units) can be precisely calibrated in nm using a simple linear interpolation z vs D. The case
∆
z
=0 corresponds to a ‘hard wall’ repulsion, namelydF/dD= -∞.
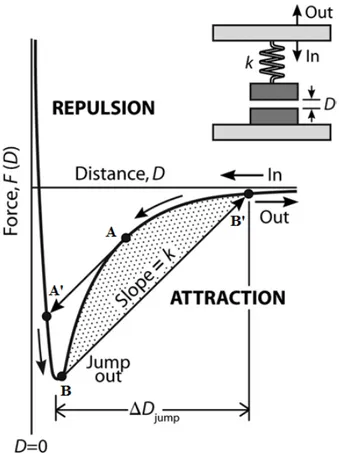
Figure 1.12. Schematic attractive force law measurement by force-measuring spring system. If the
gradient of the attractive force dF/dD exceeds the gradient of the springs restoring force defined by spring
constant k, the surfaces will jump from A into contact at A' while approaching, while on separating the
surfaces, they will jump from B to B'. The distance (B - B') multiplied by k gives the adhesive force,Fad, i.e.
Spring-based force measurements are inherently unstable at distances D such that
dF/dD> k (Fig. 1.12). Therefore, quickly increasing or decaying forces are inaccessible.
Due to this mechanical instability, the lower surface mounted on the double-cantilever force spring will either jump towards or away from the upper surface to the next stable region during approach or separation, respectively. Thus using weaker springs are more sensitive and can result in more inaccessible regions of the complex force profile because of increased range between instabilities.
1.6.5 Experimental procedure
Mica sheets are glued on cylindrical silica lenses which act as optical window and support for mica during the measurements. The lenses are placed on heating plate and a grain of thermosetting EPON RESIN 1004 resin (from Shell) is placed on the glass, melted and spread in a thin uniform layer. Mica is then glued with the silvered face down avoiding overheating, which may lead to degradation of silver film, and bubbles trapped below the mica. The lenses with the glued mica surfaces are then mounted in SFA, the SFA chamber is closed tightly and a stream of nitrogen is passed in the chamber to remove adsorbed ambient water from the surfaces.
Optical alignments of the lamp and lenses are checked and optimized before bringing the surfaces in contact in air for the first time. This alignment will help the white light to pass perpendicularly through the mica surfaces mounted in the SFA. With the help of the eyepiece placed on the microscope objective (Fig. 1.13), a contact position is determined and fixed. This contact position will be observable in monochromatic light as a
ring-shaped interference pattern (i.e. Newton's rings) (Fig. 1.13b) coming from the crossed cylinder semi-reflective surfaces. Then the light path is established with the help of the prism so that the FECO can be resolved in the eyepiece of the spectrometer.
Figure 1.13. (a) SFA with eyepiece placed on microscopic objective to fix a contact position. (b) Circular
fringes (Newton's rings) where dark fringes correspond to destructive interference occurring when path difference, 2T = nλ and bright fringes correspond to constructive interference occurring at path difference, 2T = (n+1/2)λ.
Contact of the surfaces is achieved by bringing the surfaces close to each other with the help of the rough and fine motor driven micrometer of the SFA until the fringes stop moving and the tip of fringe flattens. The flattening occurs only when the mica surfaces are in strong adhesive contact in air due to deformation of glue layer. When the surfaces are separated, the shape of the fringes become parabolic. The pattern, shape and
sharpness of the fringes depends upon the thickness of the mica surfaces and how well the cross cylindrical lenses are aligned with respect to each other.
With the help of a spectrometer and a Hg-Ar+ pencil lamp producing spectral lines of the know wavelength, the proper calibration for wavelengths 0
n
λ , 0 1
n
λ− and λn0−2transmitted
through the contact position is obtained. Typically, the position of three consecutive fringes ( 0 n λ , 0 1 n λ − and 0 2 n
λ− ) are recorded. If the contact position is not satisfactory, the surfaces are receded and the new contact position is established by moving the top surface slightly with respect to the lower one. The experiments in solution can be performed in two different ways, either by filling up the bath with solvent/buffer where the surfaces are completely immersed in liquid or by just injecting a droplet between two surfaces. Using a bath have some advantages over injecting a droplet between the surfaces as it minimizes thermal drifts and eliminates unwanted forces due to surface tension of the drop. However, for most of the experiments performed in this work, the liquid drop injection method was used since the amount of samples used were limited. The SFA experiments were performed in a dark room in the basement. The SFA was installed on a vibration-free table to avoid noise in the force measurements and in a thermostated room to reduce thermal drifts. The apparatus was covered with a simple 1-cm thick plexiglass box which ensures a crude thermal isolation and sound vibration isolation.
Forces are measured by the SFA over molecular-scale distances and hence great care has to be exercised to avoid any surface contaminations, which may arise from various