UNIVERSITY OF PISA
SCHOOL OF GRADUATE STUDIES “FISIOPATOLOGIA CLINICA E SCIENZA DEL FARMACO” PROGRAM IN “SCIENZA DEL FARMACO E DELLE SOSTANZE BIOATTIVE”
PhD THESIS
2010-2012
“Dysfunctional PAR
1
signaling in the malignant
mesothelioma cell line, NCI-H28”
TUTOR: CANDIDATE:
Prof.ssa M. R. Mazzoni Dr. Alessandra Fazzini
Settore Scientifico Disciplinare BIO/10 2013
INDEX
CHAPTER 1 – INTRODUCTION 1
1 PROTEASE ACTIVATED RECEPTOR 2
1.1 Mechanism of activation by cell-surface proteolysis 3
1.1.1 Proteases cleavage and exposure of tethered ligand domains 3
1.1.2 Facilitation of PARs cleavage and activation by protease binding 4
1.1.3 Functional interactions between PARs 6
1.2 Signal transduction from protease activated receptors 8
1.2.1 Structure-activity relations of tethered ligand domains 8
1.2.2 Activation of multiple signaling cascades 9
1.3 Termination of the signal 11
1.3.1 Disablement of PARs by cell-surface proteolysis 11
1.3.2 Receptor desensitization 13
1.3.3 Downregulation by intracellular proteases 14
1.4 Physiology and pathophysiology of Protease Activated Receptors 16
1.5 Aims of the study 17
CHAPTER 2 – MATERIALS AND METHODS 19
2.1 Materials 20
2.2 Cell cultures 21
2.3 Real time RT-PCR 22
2.4 SDS-PAGE and Western Blot Analysis 23
2.5 WST-1 cell proliferation assay 24
2.6 [Ca2+]i measurement 25
2.7 RhoA activation 27
2.8 Measurement of intracellular cAMP 27
2.9 Data Analysis 28
CHAPTER 3 – RESULTS 29
CHAPTER 4 – DISCUSSION AND CONCLUSIONS 45
1
INTRODUCTION
2
1 PROTEASE ACTIVATED RECEPTOR
Seven transmembrane G protein coupled receptors (GPCRs) are the largest group of membrane receptors in mammalian systems and many of them are target of drugs which are currently in clinical use. Among this receptor family, protease-activated receptors (PARs) are a subset which have a unique mechanism of activation. In fact, rather than being activated by simple ligand occupancy, they are activated enzymatically through proteolysis by enzymes of the serine protease family (Macfarlane et al., 2001). The proteolytic cleavage occurs at specific sites within their N-terminal region, thereby exposing novel N-termini, and the ‘tethered ligand’ then folds back onto the extracellular loop II of the receptor, resulting in activation.
PARs are expressed in various tissues and cell types, such as cardiomyocytes, platelets, fibroblasts, endothelial cells and cells of the gastrointestinal tract and lung. Activation of these receptor types is involved in various cellular responses associated with haemostasis, inflammation and cell proliferation, thus making them attractive targets for the therapeutic treatment of several diseases including thrombosis, atherosclerosis, cancer metastasis and inflammation.
There are four PARs encoded by distinct genes in the mammalian genome. The prototype of this GPCR subfamily is PAR1 which was discovered in 1991 (Vu et al., 1991;
Rasmussen et al., 1991) and transmits cellular response to thrombin, the main effector protease of the coagulation cascade. Soon after, other three members of the subfamily were identified which include PAR2 (Nystedt et al., 1995), the trypsin-activated receptor, and two
other thrombin-activated receptors, PAR3 (Ishihara et al., 1997) and PAR4 (Xu et al., 1998).
Whereas cleaved PAR4 is able to activate diverse signaling pathways the ability of activated
3
thrombin-mediated activation of PAR4 (Nakanishi-Matsui et al., 2000) and may also signal as
part of a PAR1-PAR3 heterodimer (McLaughlin et al., 2007). Other proteases besides trypsin
for PAR2 and thrombin and trypsin for PAR1 and PAR4 can activate these receptors (Soh et
al., 2010) as well as synthetic peptides that mimic the first six amino acids of the newly
formed N-terminus and act as soluble ligands in the absence of receptor proteolysis. Some PAR agonist peptides (PAR-APs) activate more than one PAR at concentrations in the micromolar range, as compared with nanomolar potencies of the proteases themselves.
1.1 Mechanism of activation by cell-surface proteolysis
1.1.1 Proteases cleavage and exposure of tethered ligand domains
The general mechanism by which proteases cleave and activate PARs is the same: proteases cleave at specific sites within the extracellular amino terminus of the receptors. This cleavage exposes a new amino terminus that serves as a tethered ligand domain, which binds to conserved regions in the second extracellular loop of the cleaved receptor, resulting in the initiation of signal transduction. There is no known function of the amino-terminal fragment of the receptor that is removed by proteolysis. The mechanism by which thrombin activates PAR1 has been investigated in detail. Thrombin cleaves PAR1 at R41↓S42FLLRN in
the N-terminal region, to expose the tethered ligand NH2-SFLLRN, which binds and activates
the cleaved receptor, resulting in signal transduction. Several observation support this mechanism of activation. Mutation of the cleavage site prevents thrombin cleavage and signalling, indicating the importance of this site for PAR1 activation (Vu et al., 1991). A
synthetic peptide (S42FLLRN) that mimics the tethered ligand domain directly activates intact PAR1, without the requirement for hydrolysis by thrombin. Such synthetic agonists are useful
4
tools for investigating PAR functions. Similar observations indicate that trypsin cleaves PAR2 at R34↓S35LIGKV to reveal the amino-terminal tethered ligand SLIGKV in humans
(Nystedt et al., 1995). Synthetic peptides corresponding to the tethered ligand domain SLIGKV activate PAR2 without the need for receptor cleavage. PAR3 is cleaved by thrombin
at K38↓F39RGAP and mutation of the cleavage site to one that would be resistant to thrombin prevents its activation (Ishihara et al., 1997). This cleavage exposes a new amino terminus (TFRGAP) that may interact with the receptor as a tethered ligand. However, in marked contrast to PAR1, PAR2 and PAR4, synthetic peptides corresponding to this putative tethered
ligand do not activate PAR3. The reason for this discrepancy is unknown, although
differences in affinity, steric hindrances and the possibility that cleavage releases conformation of the receptor constrained by the uncleaved amino terminal region could explain these unexpected results. Another unexpected observation is that mouse PAR3 is
unable to signal when expressed alone, without other PARs (kahn et al., 1998). Thrombin and trypsin cleave PAR4 at R47↓G48YPGQV and peptides corresponding to the tethered ligand
domain GYPGQV can directly activate PAR4 (kahn et al., 1998). Mutation of the cleavage
site prevents activation by thrombin and trypsin but not by the synthetic peptides, which confirms the importance of the proteolytic cleavage for receptor activation.
1.1.2 Facilitation of PARs cleavage and activation by protease binding
Thrombin can activate PAR1 and PAR3, by a two-step mechanism: first the protease
binds and then it cleaves the receptor. The process of binding and activation has been most thoroughly studied for thrombin and PAR1 (Vu et al., 1991). In addition to containing the
5
K51YEPF55, that is essential for high-affinity interactions with thrombin. This charged domain is distal to the thrombin cleavage site and binds to an anion binding site on thrombin, thereby temporarily concentrating the protease at the surface of the receptor. This negatively charged region of PAR1 resembles a domain of the leech anticoagulant hirudin, which inhibits
thrombin by binding its anion site. The importance of the hirudin-like domain is emphasized by the finding that its deletion markedly diminishes the capacity of thrombin to activate PAR1
whereas substitution of this region with the corresponding domain of hirudin allows a full recovery of activity. Steady-state kinetic studies using soluble full-length PAR1 exodomains
showed that the initial binding of the Hir sequence of PAR1 with exosite I is essential for
rapid association to thrombin. In a second and rate-limiting step, the exosite I-bound Hir motif facilitates the productive interaction of the PAR1 cleavage sequence to the active site of
thrombin. The subsequent irreversible steps of peptide bond cleavage are rapid and allosterically enhanced by the presence of the docked Hir sequence. Following cleavage, thrombin remains associated with the C-terminal portion of the PAR1 exodomain via this high-affinity Hir sequence. Complementary studies with an array of thrombin active site and exosite mutants further demonstrated the importance of the thrombin exosite I for efficient binding and cleavage of PAR1 peptides. Docking studies of the PAR1 exodomain Hir motif to
exosite I of thrombin reveals that the active site of thrombin is readily accessible to another large macromolecular substrate. This supports thenotion that an additional role of the PAR1
Hir sequence is to tether thrombin to the platelet surface and assist in the cleavage of other nearby platelet receptors thatlack a high-affinity Hir-like sequence.
Adjacent to the Hir-motif is an anionic E57DEE60 cross-cluster that splays outward from the exodomain where it is available for electrostatic interactions with the positively charged thrombin exosite-1. A hydrophobic scaffolding residue, Trp56, anchors both the adjacent Hir and EEDE motifs by making numerous contacts with Pro54, Phe55, Glu57, Asp58,
6
Leu66 and Thr67. Kinetic analyses of soluble PAR1 exodomains showed that the presence of
Trp56 enhances the affinity of the adjacent Hir sequence for exosite I of thrombin by 11-fold. The N-terminaltethered ligand forms an intramolecular complex with aregion located in the C terminus of the PAR1 exodomain that was confirmed to be an authentic ligand
bindingsite LBS-1 (P85AFIS89) in full-length receptor.
PAR3 also contains a hirudine-like site (FEEFP) that is distal to the thrombin cleavage
site, which interacts with thrombin (Ishihara et al., 1997). PAR4, in contrast to the other
thrombin receptors, lacks a hidurin-like binding site for thrombin (Xu et al., 1998). Protease binding site have not been identified for PAR2.
1.1.3 Functional interactions between PARs
A common theme of signalling by GPCRs is that there are frequently several different receptors for a single ligand and often several ligands for one receptor. Thus thrombin can activate PAR1, PAR3 and PAR4, with different potencies and trypsin, tryptase and certain
coagulant factors can activate PAR2. This complexity becomes particularly interesting
7
can have important functional consequences. Human platelets express two thrombin receptors, PAR1 and PAR4. There are marked differences in the mechanisms of activation
and inactivation of these receptors that have important consequences for thrombin signalling to platelets. As previously explained, PAR1, in contrast to PAR4, responds to low
concentrations of thrombin and its responses are rapidly shut-off, probably as a result of phosphorylation of residues in the carboxy terminus and uncoupling from G proteins while PAR4 responses are sustained and desensitize slowly (Kahn et al., 1999). The coexpression
of two receptors with different potencies and kinetics of desensitization may have important functional consequences. Thus, in human platelets PAR1 mediates rapid and transient
increases in intracellular calcium concentration ([Ca2+]i) to low concentrations of thrombin
whereas PAR4 mediates delayed and sustained increases in [Ca2+]i to higher thrombin
concentrations (Covic et al., 2000). This prolonged signal is important for the late phases of platelet aggregation. Similar dual receptor system probably exist on other cells with important functional consequences.
In some instances, protease binding to one receptor can facilitate cleavage of another receptor that is expressed on the same cell. This appear to be the situation for PAR3 and
PAR4 on murine platelets. PAR3 acts as a cofactor for PAR4 in murine platelets where it
facilitates activation of PAR4 by low concentrations of thrombin. The hirudin-like site of
PAR3 binds and concentrates thrombin at the cell surface, and thereby promotes thrombin
cleavage of PAR4. At high concentrations, thrombin can directly cleave and activate PAR4,
even though it lacks a thrombin binding domain.
GPCRs can form homodimers and heterodimers with important consequences for signal transduction. Although the principal mechanism of PAR activation is intramolecular, there are several examples of intermolecular interactions between different PAR molecules. Intermolecular signalling, by which a cleaved receptor can activate an uncleaved receptor,
8
was first demonstrated for PAR1 (Chen et al., 1994) when in a reconstituted system was
shown that is possible for the tethered ligand of cleaved PAR1 to activate an uncleaved
receptor. There is also evidence of intermolecular signalling between different PARs. Peptides corresponding to the tethered ligand of PAR1 (SFLLRN) can also activate PAR2, but
not vice versa (Blackhart et al., 1996). Several results suggest that the tethered ligand domain of PAR1 can interact with uncleaved PAR2 to transduce the signal (O’Brien et al., 2000).
Recently it has been demonstrated that PAR1/PAR3 heterodimers are formed constitutively in
endothelial cells and the activated dimeric complex induces distinct signalling involving the selective coupling to Gα13 as compared with the PAR1/PAR1 homodimer. The ability of
PAR1 to form heterodimers with PAR3 indicates that this heterodimer is formed under
physiological conditions and could be implicated in endothelial barrier dysfunctions (McLaughlin et al., 2007). This novel form of intermolecular signalling between different PARs clearly requires the close association of receptors at the cell surface, which could be influenced by levels of expression or by anchoring proteins that may affect mobility of receptors in the membrane.
1.2 Signal transduction from protease activated receptors
1.2.1 Structure-activity relations of tethered ligand domains
The observation that synthetic peptides corresponding to the tethered ligand domain of PAR1 are agonists for the receptor without the need for proteolysis had three important
consequences. First, it enabled the use of syntethic peptides as probes for PAR function thereby avoiding the sole use of proteases, which have many biological effects not related to PARs. These APs are now widely used to investigate the physiological functions of PARs in
9
vitro and in vivo. Second, it permitted convenient structure activity studies of the tethered
ligand domain through functional analyses of synthetic peptides (Maryanoff et al., 2001). Such studies have provided important information about critical residues of the tethered ligand and facilitated the development of more selective agonists (Hollenberg et al., 1997). Third, analogues of the APs have been used as templates for the development of antagonists of PAR1 (Andreade-Gordon et al., 1999). However, there are certain limitations to the use of
APs as PAR agonists. Unfortunately, APs are weak agonists compared with proteases, often requiring concentrations in excess of 1 µM to activate most PARs. The low potency of APs is mostly attributed to the inefficient presentation of these soluble peptides to the binding domains of the receptor compared with the tethered peptide. In addition, these peptides are readily inactivated by proteolysis. Because APs are used at such high concentrations, they may have nonspecific effects that are unrelated to PAR activation. The use of control peptides, such as inactive scrambled peptides or reversed sequences, is thus essential, although these too can have activity. In addition, APs are not always specific for a particular PAR; for example, the PAR1-AP SFLLRN also activates PAR2 (Blackhart et al., 1996).
Replacement of Ser1 with Thr1 (corresponding to the sequence in Xenopus PAR1) in
PAR1-AP generates an agonist TFLLRN that is selective for PAR1 and that does not activate
PAR2.
1.2.2 Activation of multiple signaling cascades
Activated PAR1 and PAR2 couple to multiple heterotrimeric G-protein subtypes
including Gi, Gq and G12/13 (Coughlin, 2005; Soh et al., 2010), whereas PAR4 couples to Gq
10
in most cell types including mitogen-activated protein kinases (MAPKs), various Rho kinase and phospholipase C (PLC) isoforms, inositol lipid signaling and mobilization of intracellular Ca2+ (Macfarlane et al., 2001). Gαq stimulates phospholipase C to produce inositol
trisphosphate (IP3), which mobilizes intracellular Ca2+, and diacylglycerol (DAG) activating
protein kinase C (PKC). Together, Ca2+ and PKC activate numerous downstream pathways, including Ca2+-regulated protein kinases and mitogen-activated protein (MAP) kinases.
Gα12/13 plays a major role in the control of cell shape and migration through interaction with
Rho guanine-nucleotide exchange factors (Rho-GEF). Gαi proteins inhibit adenylyl cyclase
and suppress formation of cAMP. Gβγ subunits of heterotrimeric G proteins couple PAR1 to
many other pathways, notably activation of phosphatidylinositol (PI) 3-kinase, which promotes Ca2+ release. PI 3-kinase thus links PAR1 to changes in cytoskeletal structure, cell
motility, survival and mitogenesis.
There has been considerable interest in understanding the mechanism by which PAR1
couples to the MAP kinase cascades given the important mitogenic role of thrombin. Many data about PAR1-mediated ERK1/2 activation derive from studies in astrocytes since PAR1
stimulate astrocytes proliferation both in vitro and in vivo. PAR1 induces robust ERK1/2
activation, an important mediator of astrocyte proliferation. In contrast to transient ERK1/2 activation induced by many stimuli, activated PAR1 causes sustained ERK1/2 signaling in
astrocytes (Nicole et al., 2005; Suo et al., 2003). PAR1 stimulation causes the activation of
transcriptional factor nuclear factor κB in endothelial cells.
PARs, like other GPCRs, can exhibit biased signaling (Rajagopal et al., 2011; Kenakin and Miller, 2010). For example, the activation of PAR1 with a peptide agonist can cause
signaling preferentially via Gq, whereas thrombin-triggered PAR1 signaling is preferentially
coupled to G12/13 (McLaughlin et al., 2005). Furthermore signaling via PAR1 and PAR2 can
11
protease-selective signaling (Russo et al., 2009). Finally, it is important to mention, that activated PARs also interact with various adaptor proteins that facilitate signal transduction independent of heterotrimeric G protein coupling. Among these proteins, the multifaceted -arrestins play a major role controlling magnitude and duration of mainly PAR2- but also
PAR1-mediated G protein signaling as well as PAR2 signaling to non-G protein effectors
(Chen et al., 2004; Soh et al., 2010).
1.3 Termination of the signal
1.3.1 Disablement of PARs by cell-surface proteolysis
Proteases that remove or destroy the tethered ligand or cleave the binding domain in the extracellular loop II would generate receptors that are unresponsive to activating proteases. Many proteases can disable PARs in this manner. Disabling proteases may serve to dampen signalling by activating proteases and could thereby be an additional mechanism for terminating protease signalling. A portion of proteolytically activated PAR1 can recycle to
the cell surface in some cell types, although it is usually targeted for degradation. Proteolytically activated and recycled PAR1 can continue to signal at the cell surface (Trejo et
al., 1998). In this case, proteases that cleave or remove the exposed tethered ligand would
arrest signalling. Proteases from inflammatory cells, including neutrophils and mast cells, can cleave and disable PARs. Neutrophil cathepsin G, elastase and protease 3 cleave PAR1
removing the activation site and thereby abolish thrombin signalling (Renesto et al., 1997). PAR1-AP still signals to cells exposed to these proteases, suggesting that the binding domain
is preserved. Elastase and cathepsin G cleave PAR2 and PAR3 in transfected cells removing
12
and thrombin, respectively. However, PAR2 maintains its responsiveness to PAR2-AP (Dulon
et al., 2003). Interestingly, this process of inactivation occurs without the loss of binding of
monoclonal antibodies that recognize sites flanking the tethered ligand domain suggesting inactivation does not involve removal of the tethered ligand. The mechanism of this inactivation is unknown but could involve cleavage of tethered ligand binding domains. Some proteases can cleave PARs at several sites, including activation and disabling sites, and the net result depends on the efficiency of cleavage at different locations. Although trypsin has been reported to activate PAR1, it also efficiently cleaves PAR1 at distal sites that would
remove the tethered ligand domain. Indeed, in endothelial cells, trypsin inactivates PAR1,
generating a receptor that is unresponsive to thrombin (Nakayama et al., 2003). In addition to cleavage at the activation site (Arg34-Ser35), tryptase also cleaves PAR2 at the Lys41-Val42 site,
which could inactivate the receptor. In the case of tryptase, the activating cleavage is more important since tryptase activates PAR2. The consequences of exposing cells to proteases
depend on the repertoire of PARs expressed by a cell and whether the proteases activate or disable particular receptors. For example, cathepsin G disables PAR1 but activates PAR4.
Thus in human platelets, which express PAR1 and PAR4, cathepsin G can induce aggregation
through PAR4 even though it disables PAR1 and thereby prevents signalling by low
concentrations of thrombin. In contrast, in fibroblasts and endothelial cells that do not express PAR4, cathepsin G abolishes thrombin signalling through PAR1. In addition, proteolysis can
impair the ability of PAR3 to act as a cofactor for PAR4 (Cumashi et al., 2001). In murine
platelets, PAR3 binds thrombin but does not signal. Instead, it concentrates thrombin in the
vicinity of PAR4 and thus serves as cofactor for PAR4 signaling in response to low
concentrations of thrombin. Cathepsin G does not cause aggregation of murine platelets but prevents aggregation to low concentrations of thrombin, indicating that cathepsin G abolishes this cofactor role of PAR3 (Ossovskaya and Bunnett, 2004).
13 1.3.2 Receptor desensitization
Proteases activate PARs by an irreversible mechanism: cleavage exposes the tethered ligand domain that is always available to interact with the cleaved receptor. This activation would result in prolonged signalling unless there were efficient mechanisms to attenuate the response. The principal mechanism that terminates signalling by PARs is broadly similar to the classical pathway of desensitization that has been described in detail for many other GPCRs, in particular rhodopsin and the β2-adrenergic receptor (Bohm et al., 1997; Luttrell
and Lefkowitz, 2002).
Ligand occupation of the GPCR induces the translocation of members of the family of G protein receptor kinases (GRKs) from the cytosol to the activated receptor at the cell surface. GRKs are serine-threonine kinases that phosphorylate activated GPCRs usually within the carboxy terminus or third intracellular loop. Phosphorylation triggers the membrane translocation of arrestins, which interact with the phosphorylated transduction. Additional mechanism may involve phosphorylation by second messenger kinases, which also terminate signalling. However, there are still many critical aspects of GPCRs desensitization, including PARs, which are unexplored. Several observations suggest that modifications of the tethered ligand domain of cleaved PAR1 may also contribute to
desensitization. One mechanism may involve cleavage of the tethered ligand domain. The hypothesis is that after activation with AP, the tethered ligand domain is proteolytically destroyed, rendering the receptor unresponsive to thrombin but not AP. PAR4 has slow
kinetics of desensitization that permits it to signal in a sustained fashion in human platelets. However, mechanisms of desensitization vary between different PARs, probably due to structural differences, especially in the intracellular loop III and carboxy terminus (Traynelis and Trejo, 2007).
14 1.3.3 Downregulation by intracellular proteases
In addition to processes that regulate coupling of receptors to signalling pathways, cells also determine their responsiveness to agonists by regulating the levels of receptors that are expressed at the plasma membrane and which are thus accessible to agonists in the extracellular fluid. The level of expression of receptors at the cell surface is a balance between removal by endocytosis and replenishment by recycling or mobilization of intracellular pools. Many receptors internalize after binding agonists. However, the fate of endocytosed receptors depends on postendocytic sorting, which varies from receptor to receptor. At one extreme, some GPCRs that are activated in a reversible fashion by agonist binding, for instance the neurokinin-1 receptor, efficiently recycle to the plasma membrane to be reused by the cell (Defea et al., 2000). At the other extreme, receptors such as the PARs, which, once cleaved, cannot be reused by the cell, are destined for intracellular degradation, which irrevocably terminates signalling. For these receptors, recovery requires synthesis or mobilization of new receptors. Of course, all surface receptors have a finite life span and even recycling receptors are downregulated by intracellular degradation after long-term stimulation.
The process of receptor downregulation is of considerable importance because defects can result in exaggerated signalling and abnormal phenotypes, for example, transformation in the case of EGF receptors that are not downregulated. PARs are an ideal model to study these postendocytic sorting events since they are invariably targeted for degradation after activation. The molecular mechanism and pathways of agonist-induced trafficking of PARs vary from receptor to receptor and in different cells. The newly synthesized PAR1 contains a
15
PAR1 expressed on the plasma membrane is then subjected to two distinct modes of
internalization: the constitutive internalization and the agonist-triggered internalization. The stimulation of PAR1 with either thrombin or agonist peptides triggers the internalization of
PAR1. The internalized receptors are mainly targeted to lysosomal degradation and partly
recycled to the plasma membrane (Trejo, 2003). Internalization and lysosomal sorting of proteolytically activated PAR1 is thought to prevent the receptor from returning to the cell
surface with its tethered ligand intact and continuing to signal (Trejo and Coughlin, 1999). Proteolysis or truncation of the tethered ligand may also occur to prevent further PAR1
signaling. The full recovery of the responsiveness to protease activation requires either de novo synthesis or the recruitment of intact receptors from the intracellular pool. The importance of these mechanisms depends on whether cells possess prominent intracellular stores of PAR1 in the Golgi apparatus. Platelets, which lack both the ability to synthesize new
receptors and prominent intracellular pools, are unable to repopulate the plasma membrane with new receptors after thrombin exposure and thus do not recover responsiveness to thrombin. Because platelets are only required to respond once to thrombin, by aggregation, the lack of a robust system of resensitization does not impair their function. Moreover, human platelets also express PAR4, which facilitates prolonged signalling by thrombin.
Similar mechanisms account for the resensitization of PAR2 suggesting that these are
widespread mechanisms (Hamilton et al., 1999).
Constitutive internalization takes place under resting conditions without any receptor stimulation and requires residues of the C-terminus of PAR1, which are distinct from those
required for agonist-triggered internalization. The cells expressing mutant PAR1, which has
been shown to be defective in constitutive internalization but not in agonist-triggered internalization, are missing the intracellular pool (Shapiro et al., 1998). The nascent PAR1 is
16
intracellular pool. Next, the PAR1 cycles between the plasma membrane and the intracellular
pool under resting conditions. Therefore, the major steps that regulate the level of PAR1
expressed on the cell surface are transcription, constitutive and agonist-triggered internalization, the recruitment of intact receptors from the intracellular pool and lysosomal degradation (Hirano et al., 2005).
PAR1 and PAR2 are rapidly and extensively internalized after activation and the initial
accumulation of the receptors into coated pits suggests that internalization proceeds by a clathrin-mediated process. β-arrestins play a major role in endocytosis of many GPCRs by serving as adaptor proteins that link GRK-phosphorylated receptors to clathrin and clathrin adaptor protein-2 (AP2). However, β-arrestin play no role in stimulated endocytosis of PAR1
while it is required for PAR2 internalization. Although the molecular mechanisms that target
PAR2 for degradation are unknown, PAR2 is extensively ubiquitinated after activation and
ubiquitination of some other GPCRs is a prerequisite for degradation (Traynelis and Trejo, 2007).
1.4 Physiology and pathophysiology of Protease Activated Receptors
PARs have multiple roles in many physiological and pathological events involving different tissues and organs such as the cardiovascular, musculoskeletal, gastrointestinal, respiratory and central nervous system (CNS) (Ramachandran et al., 2012). In addition, coagulant protease and PARs have been implicate in several types of malignant cancer. PAR1
is overexpressed in aggressive melanoma (Tellez and Bar-Eli, 2003), colon cancer (Darmoul
et al., 2003), prostate cancer (Chay et al., 2002) and invasive breast cancer (Even-Ram et al.,
17
regulate tumor cell growth. Indeed, PAR1 can promote tumor cell invasion and epithelial cell
malignancy (Even-Ram et al., 1998; Even-Ram et al., 2001; Bar-Shavit et al., 2011). The expression of PAR1 and PAR2 is also increased in stromal fibroblasts of malignant tissues as
compared to normal tissues (D’Andrea et al., 2001). In addition, several different proteases which can potentially activate PAR1 and/or PAR2 have been identified in tumors including
tissue-derived trypsins, members of the coagulation cascade and matrix metalloprotease-1 (MMP-1) (Arora et al., 2007; Ramachandran et al., 2012). The mitogenic activity induced by PAR1 or PAR2 stimulation is associated with prolonged ERK1/2 activation (Arora et al.,
2007). Activated PAR1 also fails to be downregulated in highly invasive breast carcinoma,
and consequently PAR1 persistently activates ERK1/2 and induce cellular proliferation and
invasion (Booden et al., 2004). Therefore, increased PAR1 levels in invasive carcinoma cells
may be due, at least partially, to a defective trafficking. Of course, other mechanisms contributing to increased PAR1 mRNA and protein levels are also possible such as changes in
gene transcription (Arora et al., 2007; Bar-Shavit et al., 2011). For example, Tellez et al. (2003) have demonstrated an inverse correlation between the expression of activator protein-2 (AP2) and the overexpression of PAR1 in metastatic melanoma cells.
1.5 Aims of the study
Malignant pleural mesothelioma (MM) is a relatively rare but aggressive neoplasm which is associated with occupational exposure to asbestos. Most patients are diagnosed at a late stage, which makes curative resection difficult. Despite aggressive treatment with radiotherapy and/or chemotherapy the prognosis is poor with a median survival time between 8 and 18 months. MM patients are very susceptible to thromboembolic complications
18
(Nguyen et al., 2008) which can develop as a consequence of the activating effect of malignant cells on the haemostatic system (Noble and Pasi, 2010).
The aim of this study was to investigate PAR1 expression levels, signaling and
mitogenic effects in nonmalignant mesothelial (Met-5A) and MM cells (NCI-H28). In this MM cell line, a homozygous deletion of the -catenin gene (CTNNB1) has been demonstrated (Shigemitsu et al., 2001) while thrombomodulin (TM), a natural anticoagulant, appears to be silenced by an epigenetic mechanism (Nocchi et al., 2011). Therefore, we considered quite intriguing to study PAR1 expression and signaling in this cell line and
correlate our findings to the known genetic and epigenetic alterations. Our study indicates that the expression levels of both PAR1 mRNA and protein are increased in NCI-H28 cells
but more important, receptor signaling to down-stream effectors is rather dysfunctional. In fact, the only signaling pathway which is fully maintained is that through Gi proteins while
those through G12/13 and Gq are either reduced or abolished. Whereas the lack of
thrombomodulin on plasmamembrane can alter PAR1 activation the -catenin deficiency on
the E-cadherin/catenin complexes at cell junctions can interfere with caveolin-1 localization and consequently with PAR1 localization and proper signaling to Gq and G12/13.
19
MATERIALS AND METHODS
20
2.1 Materials
Penicillin, streptomycin, hydrocortisone, cAMP, Ro 20-1724, protease inhibitor cocktail, isoproterenol and secondary antibodies were products of Sigma-Aldrich Inc. (St. Louis, MO); while [3H]-cAMP (specific activity 31.0 Ci mmol-1) and enhanced chemiluminescence substrate (Western lightning® Plus-ECL) were from PerkinElmer Inc. (Waltham, MA). HMEC-1 cells were a generous gift of Dr E Ades (Centers for Disease Control, Atlanta, GA). NCI-H28 and Met-5A cells were purchased from LGC Standards s.r.l. (Middlesex, UK). MCDB-131 medium, Medium 199, RPMI-1640, Fetal Bovine Serum (FBS), trypsin-EDTA, epidermal growth factor (EGF), L-glutamine, human recombinant insulin, nitrocellulose membrane, Fluo-3 and Pluronic were purchased from Life Technologies Corporation (Paisley, UK). WST-1 was a product of La Roche (Basel, Switzerland). RhoA activation assay kit was obtained from Cytoskeleton, Inc. (Denver, CO). PAR1-AP (TFLLR-NH2), a selective PAR2-AP (2-furoyl-LIGRLO-NH2) and SCH79797 were
products of Tocris Bioscience (Bristol, UK). GB83 was purchased from Axon Medchem BV (Groningen, The Netherlands). Human thrombin (high activity, ≥2800 NIH U mg-1 protein) was a product of Calbiochem-Novabiochem Corp. (San Diego, CA). The RNeasy Mini Kit and SYBR Green PCR Kit were purchased from Qiagen GMbH (Hilden, Germany). The Rev Transcription Kit was a product of New England BioLabs (Ipswich, MA). Primary antibodies were from Santa Cruz Biotechnology Inc (Santa Cruz, CA). Other agents and reagents were from standard commercial sources and were of the highest grade available.
21
2.2 Cell cultures
In the present study human dermal microvascular endothelial cells (HMECs-1) that were transformed using SV-40 were used as reference cells which endogenously express PARs (Asteriti et al., 2012). These cells were used to analyze the differential activation of signaling pathways by different PAR1-activating peptides (PAR1-APs) and to test the effects
of modulators on signaling.
HMECs-1 were cultured in MCDB-131 medium, supplemented with 5% FBS, 1% penicillin/streptomycin (100 units/ml; 100 µg/ml), hydrocortisone (1 µg/ml), epidermal growth factor (0.01 µg/ml) and L-glutamine (2 mM) in atmosphere of 95% air, 5% CO2 at
37°C. The cells were seeded at 1 x 10⁵ cells/ml in 75 ml cell culture flasks coated with 1% gelatin and subcultured after detachment with 0.05% trypsin, 0.5 mM EDTA. In all experiments, cells were used at passages 16-20.
Malignant mesothelioma cells (NCI-H28) and nonmalignant mesothelial cells (Met-5A) were used to analyze the differential activation of signaling pathways by thrombin and different PAR-activating peptides (PAR-APs).
Met-5A cells were cultured in Medium 199 supplemented with 10% FBS, 1% penicillin/streptomycin (100 units/ml; 100 µg/ml), hydrocortisone (400 nM), epidermal growth factor (3.3 nM) and human recombinant insulin (870 nM) in atmosphere of 95% air, 5% CO2 at 37°C. In all experiments, cells were used at passages 3-9.
NCI-H28 cells were cultured in RPMI-1640 medium, with 10% FBS and 1% penicillin/streptomycin (100 units/ml; 100 µg/ml), in atmosphere of 95% air, 5% CO2 at 37°C. The cells were seeded in 75 ml cell culture flasks and subcultured after detachment with 0.05% trypsin, 0.5 mM EDTA. In all experiments, cells were used at passages 3-15.
22
2.3 Real time RT-PCR
PCR (polymerase chain reaction) was used to verify the expression of PAR1 and PAR2
mRNAs in Met-5A and NCI-H28 cells. Total RNA was isolated from cells using the RNeasy Mini Kit (Qiagen). Cells were lysed and homogenized in the presence of a highly denaturating buffer and the sample was then applied to an RNeasy Mini spin column, where the total RNAs bound to the membrane and contaminants were efficiently washed away. High-quality RNAs were then eluted in water. Six microliters of total RNA for each sample were reverse transcribed to cDNA using a specific Rev Transcription Kit (BioLabs). Afterwards, three microliters cDNA were amplified with SYBR Green by specific oligonucleotide primers for PAR1 and PAR2 cDNA sequences, as follow:
PAR1 primers were chosen to amplify a product of the expected size of 206 bp, while
for PAR2 a set of primers to amplify a product of 223 bp was used.
PCR was performed for 35 cycles with the following conditions: after initial Taq activation at 94°C for 5 min, each cycle consisted of denaturing at 95°C for 1 min, annealing at 50°C for 30 sec and extension at 72°C for 1 min, with a final elongation at 72°C for 7 min.
The relative expression of PAR1 and PAR2, with β-actin as the reference gene, was
determined by using the MiniOpticon™ Real-Time PCR Detection System (BioRad). Data were expressed as expression ratios normalized to β-actin.
PAR1 Forward: 5’-TGC TTC AGT CTG TGC GG-3’
Reverse: 5’-CTC CAT CAA TAA AAG CAG TCC TCT-3’
PAR2 Forward: 5’-AGC TCT GAG TTT CGA ATC GG-3’
23
2.4 SDS-PAGE and Western Blot Analysis
Met-5A and NCI-H28 cells were grown in 150 mm Petri dishes, cultured until confluence and then serum-starved overnight at 37°C. After incubation, cells were washed twice with ice-cold PBS (8.1 mM Na2HPO4, 1.5 mM KH2PO4, pH 7.4, 137 mM NaCl and 2.7
mM KCl) and lysed in modified RIPA buffer (PBS, pH 7.4, 1% Igepal, 0.5% sodium deoxycholate, 0.1% SDS and 10 l/ml protease inhibitor cocktail). Cells were lysed for 1 h at 4°C, then were centrifuged at 14 000 x g in a pre-cooled centrifuge for 45 min. The supernatant was immediately transferred to a fresh centrifuge tube and the pellet was discarded. To measure the total protein content, the Bio-Rad DC protein assay was used following the manufacturer’s instructions. BSA was used as standard.
Solubilized proteins (30 g) of each sample (Met-5A and NCI-H28) were treated with Laemmli solution, and then resolved by 12% SDS-PAGE gels using 20 mA for gel (Tetra cell apparatus, Biorad). Proteins were then transferred onto nitrocellulose membranes (0.2 µm) using 100 V for 30min. Non-specific binding was prevented by blocking the membranes with 3% low fat dried milk, 0.2% (v/v) Tween-20 in PBS (10 mM NaH2PO4, pH 7.4, 0.9% NaCl)
(PBS/milk/Tween) for 1 h at room temperature. Subsequentially, nitrocelluloses were probed overnight at 4°C in blocking buffer with a rabbit anti-PAR1 polyclonal antibody (1:200) or a
rabbit anti-PAR2 (1:200) polyclonal antibody. Following three 5 minutes washes with
PBS/milk/Tween, the immunocomplexes were detected using a peroxidase-labelled secondary antibody (goat anti-rabbit, 1:10 000 dilution for PAR1 and 1:20 000 dilution for PAR2). The
washing step was repeated as described above, followed by two washes with PBS and one with distilled water. The immunoblot signal was visualized by using enhanced chemiluminescence substrate detection system (Western Lightning® Plus-ECL). The chemiluminescent images were acquired by LAS4010 (GE Health Care). The intensity of
24
immunoreactive bands was estimated from optical density measurements of scanned images using Image J (NIH, Bethesda, MD), a public domain JAVA image-processing program. Band optical density values were normalized by the value of total protein loaded on each well. Each nitrocellulose membrane probed with anti-PAR1 or anti-PAR2 antibodies was
stripped and re-probed with a mouse anti--actin monoclonal antibody (1:2000) for 2 h at room temperature followed by an anti-mouse peroxidase-labelled secondary antibody (1:2000).
2.5 WST-1 cell proliferation assay
The assay was based on the enzymatic cleavage of the tetrazolium salt WST-1 (4-[3-(4-Iodophenyl)-2-(4-nitrophenyl)-2H-5-tetrazolio]-1,3-benzene disulfonate) (from Roche) to colored formazan by cellular mitochondrial dehydrogenases present in viable cells.
Figure. Cleavage of the tetrazolium salt WST-1 to formazan. (EC = electron coupling reagent. RS =
25
An expansion in the number of viable cells results in an increase in the overall activity of mitochondrial dehydrogenases in the sample. This augmentation in enzyme activity leads to an increase in the amount of formazan dye formed, which directly correlates to the number of metabolically active cells in the culture.
Cells were seeded in a clear 96-well plate at a density of 3 x 10³ cells/well in 100 µl of culture medium. Cells were cultured in the incubator at 37°C and allowed to adhere overnight, then cells were serum starved for 12 hours and stimulated with the agonist for 24 or 72 hours. After that, 10 µl of WST-1 mixture were added to each well, mixed gently for one minute on a shaker and cells were incubated for two hours at 37°C in a CO2 incubator.
Finally, the formazan dye, produced by metabolically active cells, was quantified by measuring the absorbance of each sample against a background control as blank with a Wallac 1420 multilabel counter microplate reader (PerkinElmer, Inc., Boston, MA) at a wavelength of 450 nm.
2.6 [Ca2+]i measurement
PAR1-mediated activation of Gq pathway was assessed by measuring the increase of
fluorescence after agonist stimulation of cells loaded with the Fluo-3 acetoxy methylester (Fluo-3-AM), using a Wallac 1420 multilabel counter microplate reader (PerkinElmer, Inc., Boston, MA). Fluo-3 exhibits large fluorescence intensity increases on Ca2+ binding.
Cells were seeded in black/clear bottom 96-well assay plates at a density of 2 x 10⁴ cells/well (HMEC-1) or 1.5 x 10⁴ cells/well (Met-5A and NCI-H28) in complete growth medium. After attachment they were starved in serum free medium containing bovine serum albumin (BSA) for 3 h at 37°C. Before starting the assay, cells were washed twice with
26
loading buffer (20 mM Hepes, 0.83 mM Na2HPO4, 0.17 mM NaH2PO4, pH 7.4, + 130 mM
NaCl, 5 mM KCl, 2 mM CaCl2, and 1 mM MgSO4) containing 25 mM mannose, 1 mg/ml
BSA and 2.5 mM probenecid and then incubated in 100 µl of the same buffer containing 6 µM Fluo-3-AM/0.024% pluronic acid. The fluorescent probe can penetrate the cells by the presence of the ester, which is subsequently hydrolyzed by intracellular esterases to an active form. The presence of probenecid further reduce any possible leak of Fluo-3 from the cells, since it is a standard inhibitor of nonspecific organic anion carrier. After 1 h at 37°C, cells were washed two times with loading buffer and incubated in 100 µl of the same buffer for an additional 1 h at 37°C to remove any excess of dye. Fluorescence measurements, reflecting the increase of [Ca2+]i, were carried out at 37°C with an excitation wavelength of 480 nm and
emission recorded at 530 nm. Fluorescence was recorded at baseline and then every 3 seconds after thrombin (50 nM) or PAR-AP (10 M) addition for another 120 seconds. The data were expressed as fluorescence ratios.
Whereas the selective PAR1- and PAR2-APs were purchased from Tocris as mentioned
in Materials the nonselctive PAR1-AP was synthesized in Dr. A.M. D’Ursi’s laboratory
(Dipartimento di Scienze Farmaceutiche, Università degli Studi di Salerno).
PAR-AP sequences
Peptides Sequence
Selective PAR1-AP (Tocris) TFLLRN-NH2
Selective PAR2-AP (Tocris) 2-furoyl-LIGRLO-NH2
27
2.7 RhoA activation
Cells were seeded in 150 mm dishes until 60% confluence and serum-starved for 18 hours. Cells were then stimulated with 10 nM thrombin for zero and two minutes. After that, culture dishes were placed on ice and washed with ice cold PBS. Then, cells were lysed with 500 µl ice-cold cell lysis buffer supplemented with protease inhibitors. Lysates were transferred into a tube and centrifuged at 10,000 g for 3 minutes at 4°C. Afterwards, cell lysates were added to a 96 well plate (RhoA G-LISA® kit from Cytoskeleton) that contained a Rho-GTP-binding protein linked to the wells. Active, GTP-bound Rho in cell lysates bound to the wells while inactive GDP-bound Rho was removed during washing steps. The bound active RhoA was detected with a RhoA specific antibody. The degree of RhoA activation was determined by comparing readings from activated cell lysates versus non-activated cell lysates. Inactivation of RhoA was generally achieved in cell culture by the serum starvation step. Finally, the absorbance of each sample was measured by using a Wallac 1420 multilabel counter microplate reader (PerkinElmer, Inc., Boston, MA) at a wavelength of 490 nm and results were expressed as absorbance ratios.
2.8 Measurement of intracellular cAMP
Intracellular cAMP levels were measured using a competitive protein binding method. Cells (4 x 10⁴/well) were plated in 24-well plates in 0.5 ml of medium. After 24 h, the medium was removed and 0.5 ml of serum free medium with phosphodiesterase inhibitor, Ro 20-1724 (20 µM), was added and the cells incubated at 37°C for 15 min. Cells were then exposed to different thrombin and peptide concentrations ranging from 100 nM to 10 µM (15
28
min at 37°C). Assays were initiated by the addition of 1 µM isoproterenol. The reaction was terminated by the removal of the medium and the addition of 0.4 N HCl. After 30 min, lysates were neutralized with 4 N KOH, and the suspension centrifuged at 800 x g for 5 minutes. To measure cAMP production, bovine adrenal cAMP binding protein was incubated with [3H]cAMP (2 nM) and 50 µl of cell lysates or cAMP standard at 0°C for 150 min in a total volume of 300 µl. Bound radioactivity was separated by rapid filtration through GF/C glass fiber filter using a cell harvester. The radioactivity was measured by liquid scintillation spectrometry.
2.9 Data Analysis
Data analysis were performed by the computer program GraphPad Prism for Windows (GraphPad Software, San Diego, CA). Values represent the means ± S.E.M. of at least three independent experiments. The statistical significance of value differences was evaluated by ANOVA test followed by Bonferroni’s multiple comparison test using GraphPad Prism for Windows.
29
RESULTS
30
PARs and their potential activating proteases are frequently overexpressed in human tumor tissues, including prostate and colon cancer as well as malignant melanoma (Arora et
al., 2007; Bar-Shavit et al., 2011; Ramachandran et al., 2012). Lee et al. (2005) have shown
that PAR2 is present in human pleural tissues where it plays a role in pleural inflammatory
responses while in primary cultures of human peritoneal mesothelial cells the expression of PAR1 has been reported (Belling et al., 2013). Therefore, we decided to investigate
expression and signaling of PARs in human pleural mesothelial and MM cells to evaluate the role of these receptors in mesothelioma cell proliferation and survival. As first step of this study, the MM cell line NCI-H28 which does not express CXCR4 (Li et al., 2011), was used while the nonmalignant mesothelial cell line Met-5A was utilized as control. In this MM cell line, apart from a homozygous deletion of the β-catenin gene (CTNNB1) (Shigemitsu et al., 2001) a down-regulation of thrombomodulin expression by an epigenetic mechanism has been described (Nocchi et al., 2011). The expression of thrombomodulin, a glycosilated transmembrane protein which binds with high affinity thrombin inhibiting its enzymatic activity and accelerating protein C activation, is lower in MM tissue than in normal mesothelium (Nocchi et al., 2011). In addition, low or no expression of the protein in various cancers has been associated with poor prognosis (Matsushita et al., 1998; Ogawa et al., 2000; Liu et al., 2010).
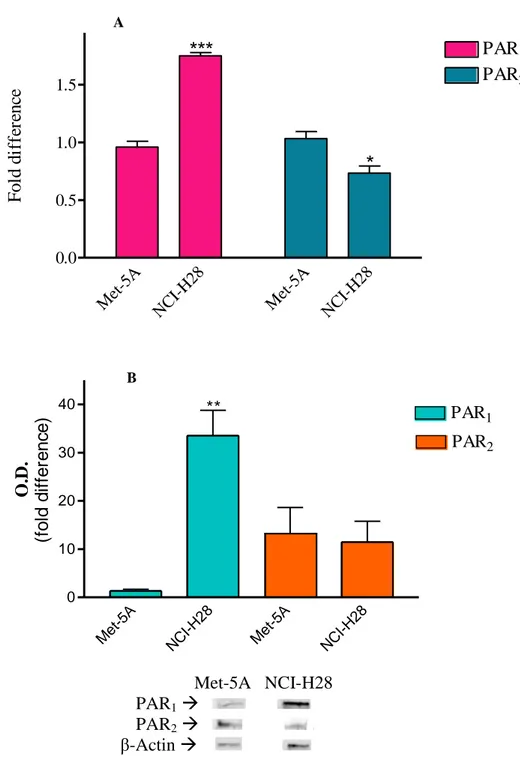
To verify whether PAR1 and PAR2 mRNA levels were different in NCI-H28 cells as
compared to those in Met-5A cells, real time RT-PCR was performed using RNA extracted from MM and nonmalignant control cells, respectively. In NCI-H28 cells, PAR1 mRNA level
was approximately 3-fold higher than in Met-5A cells while PAR2 mRNA amount was
slightly reduced in MM cells as compared to nonmalignat control cells (Fig. 1, panel A). Similarly, immunoblot analysis showed that in NCI-H28 cells the expression level of PAR1
31
substantially unchanged in MM cells (Fig. 1, panel B). These results indicate that the increased expression of PAR1 in NCI-H28 is mainly dependent by an increase of gene
transcription and/or modification of PAR1 mRNA stability.
A Me t-5A NC I-H2 8 Me t-5A NC I-H2 8 0.0 0.5 1.0 1.5 PAR1 PAR2
***
*
F o ld d if fe re n ce B Met-5A NCI-H28 PAR1 PAR2 β-Actin Figure 1. Detection of PAR mRNA (panel A) and protein levels (panel B) by real time RT-PCR and western
blot analysis, respectively, in Met-5A and NCI-H28 cells. Data are normalized to β-actin. Data shown are mean ± SEM of at least three independent experiments. Values that are significantly different from control value (* p<0.05; ** p<0.01; *** p<0.001), as determined by ANOVA followed by Bonferroni’s multiple comparison test, are indicated.
PAR1
Met -5A NC I-H2 8 Met -5A NC I-H2 8 0 10 20 30 40 PAR1 ** PAR2 O. D . (f o ld d if fe re n c e )32
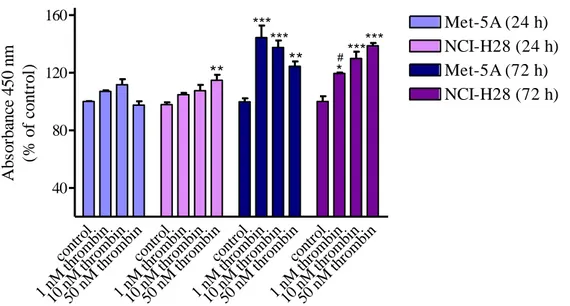
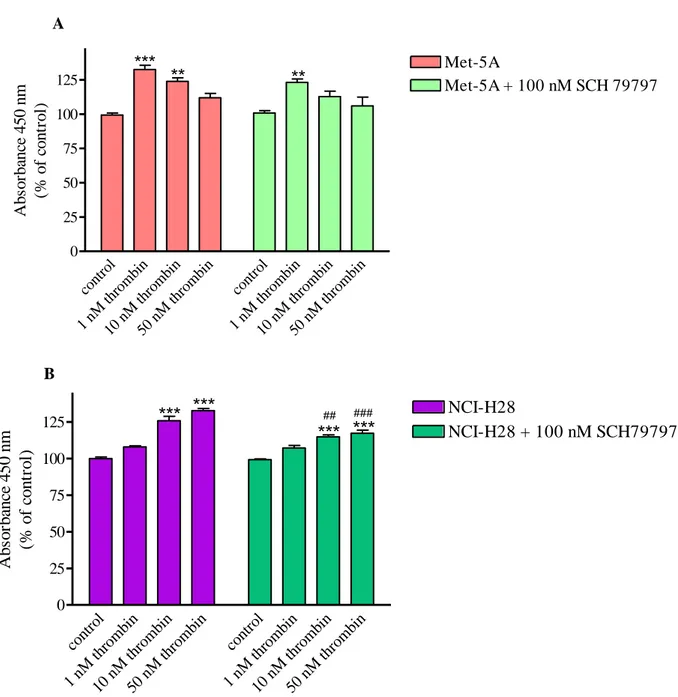
Next, we examined whether in the MM cell line PAR1 was functionally active by
evaluating thrombin- or PAR-APs-induced cell proliferation. After 72 h from thrombin stimulation, both Met-5A and NCI-H28 cells showed significant increase of cell proliferation (Fig. 2). However, the pattern of the proliferative response was quite different in MM cells as compared to that of nonmalignant mesothelial cells. In fact, in Met-5A the proliferative response was maximal at 1 nM thrombin with a progressive decrease up to 50 nM while in NCI-H28 cells the maximal response was reached at 50 nM (Fig. 2).
cont rol 1 nM th romb in 10 n M th romb in 50 n M th romb in cont rol 1 nM th romb in 10 n M th romb in 50 n M th romb in cont rol 1 nM th romb in 10 n M th romb in 50 n M th romb in cont rol 1 nM th romb in 10 n M th romb in 50 n M th romb in 40 80 120 160 Met-5A (24 h) NCI-H28 (24 h) Met-5A (72 h) NCI-H28 (72 h) ** *** *** ** *** *** * # Ab so rb an ce 4 5 0 n m (% o f co n tr o l)
Figure 2. Thrombin-induced proliferation of Met-5A and NCI-H28 cells. Cells were seeded at a density of 3 x
103 cells/well and stimulated with the agonist for 24 or 72 hours. Data shown are mean ± SEM of at least three independent experiments. Values that are significantly different from control value (* p<0.05; ** p<0.01; *** p<0.001) and from the reference value in Met-5A (# p<0.05; ## p<0.01; ### p<0.001), as determined by ANOVA followed by Bonferroni’s multiple comparison test, are indicated.
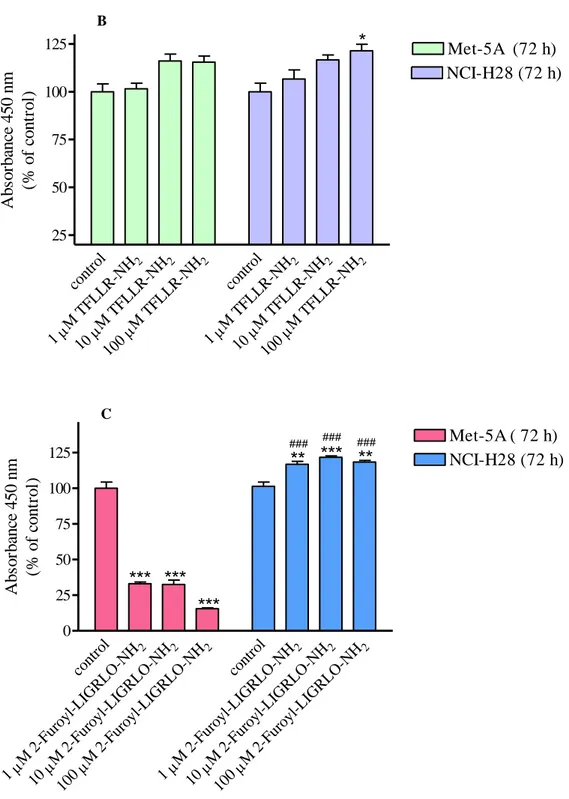
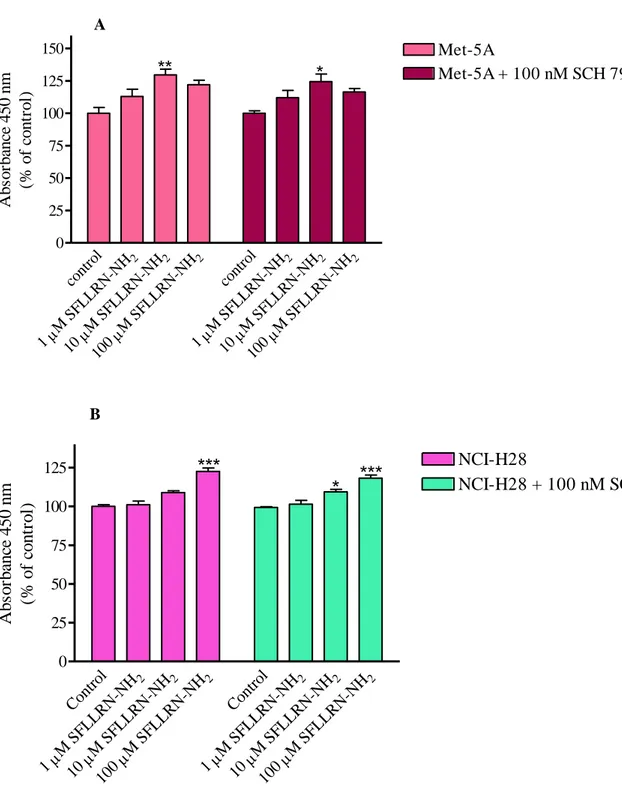
The non-selective PAR1-AP, SFLLRN-NH2, was less effective than thrombin in
stimulating Met-5A and NCI-H28 cell proliferation (Fig. 3, panel A). A 24 – 28% increase of cell proliferation was reached at 10 and 100 µM SFLLRN-NH2 in Met-5A and NCI-H28
33
in stimulating Met-5A cell proliferation than SFLLRN-NH2 but a concentration of 100 µM
caused a 20% increase of NCI-H28 cell proliferation (Fig. 3, panel B). To evaluate the role of PAR2 in stimulating mesothelial cell proliferation, both cell lines were stimulated with a
selective PAR2-AP, 2-furoyl-LIGRLO-NH2. Treatment of Met-5A cells with the selective
PAR2-AP caused inhibition of cell proliferation while in NCI-H28 cells 10 and 100 µM
2-furoyl-LIGRLO-NH2 induced approximately 20% increase of cell proliferation (Fig. 3, panel
C). These results point out that PAR-APs do not behave as thrombin in activating PAR signaling. Furthermore, both PAR1 and PAR2 signaling appears to be quite different in
NCI-H28 as compared to receptor signaling in Met-5A cells.
A cont rol 2 M S FLL RN-NH 1 2 M S FLL RN-NH 10 2 M S FLL RN-NH 100 cont rol 2 M S FLL RN-NH 1 2 M S FLL RN-NH 10 2 M S FLL RN-NH 100 0 25 50 75 100 125 150 175 Met-5A (72 h) NCI-H28 (72 h)
***
***
***
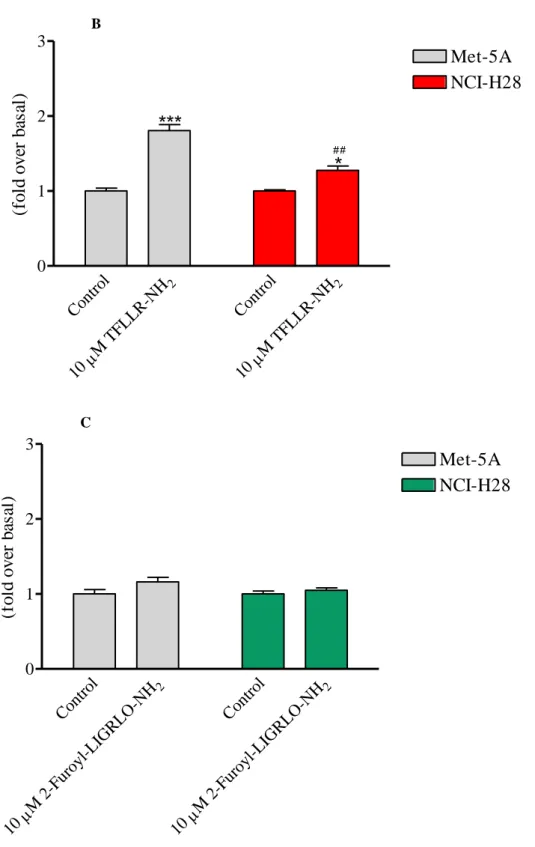
### Ab so rb an ce 4 5 0 n m (% o f co n tr o l)34 B cont rol 2 M T FLLR-NH 1 2 M T FLLR-NH 1 2 M T FLLR-NH 1 cont rol 2 M T FLLR-NH 1 2 M T FLLR-NH 1 2 M T FLLR-NH 1 25 50 75 100 125 Met-5A (72 h) NCI-H28 (72 h)
*
Ab so rb an ce 4 5 0 n m (% o f co n tr o l) C cont rol 2 M 2 -Fur oyl-L IGR LO-NH 1 2 M 2 -Fur oyl-L IGR LO-NH 10 2 M 2 -Fur oyl-L IGR LO-NH 100 cont rol 2 M 2 -Fur oyl-L IGR LO-NH 1 2 M 2 -Fur oyl-L IGR LO-NH 10 2 M 2 -Fur oyl-L IGR LO-NH 100 0 25 50 75 100 125 Met-5A ( 72 h) NCI-H28 (72 h)PAR
2-AP induced cell proliferation
*** ***
***
***
**
**
### ### ### A b so rb an ce 4 5 0 n m (% o f co n tr o l)Figure 3. Non-selective PAR1-AP- (panel A), selective PAR1-AP- (panel B) and selective PAR2-AP-induced (panel C) proliferation of Met-5A and NCI-H28 cells. Cells were seeded at a density of 3 x 10³ cells/well and stimulated with the agonist for 72 hours. Data shown are mean ± SEM of at least three independent experiments. Values that are significantly different from control value (* p<0.05; ** p<0.01; *** p<0.001) and from the reference value in Met-5A (# p<0.05; ## p<0.01; ### p<0.001), as determined by ANOVA followed by Bonferroni’s multiple comparison test, are indicated.
35
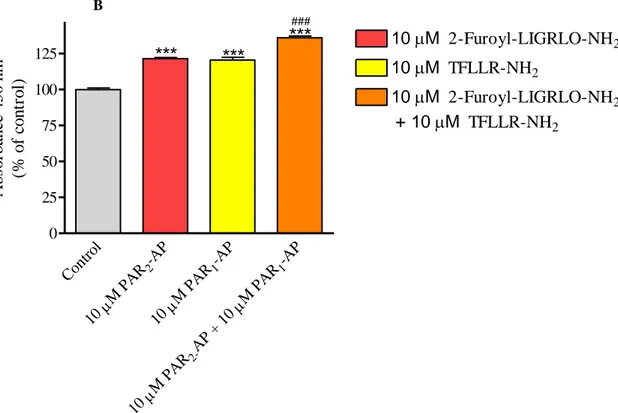
In order to understand whether thrombin- or SFLLRN-NH2-activated PAR1 is able to
cross-talk and activate PAR2 as our results seem to suggest, we performed additional
proliferation experiments using selective PAR-APs in combination, thrombin in the presence and absence of a PAR1 or PAR2 antagonist, or the non selective SFLLRN-NH2 peptide in the
presence and absence of the PAR1 antagonist. The selective PAR2 peptide inhibited in a
concentration-dependent manner Met-5A cell proliferation reaching a 56% inhibition at 100 µM. In the presence of 10 µM TFLLR-NH2, the inhibition curve of 2-furoyl-LIGRLO-NH2
was upwards and right shifted but reached the maximal effect (56% inhibition) at 100 µM (Fig. 4, panel A). On the other hand, TFLLR-NH2 and 2-furoyl-LIGRLO-NH2 were
synergistic in stimulating NCI-H28 cell proliferation (Fig. 4, panel B).
A -9 -8 -7 -6 -5 -4 20 40 60 80 100 Control + 10M TFLLR-NH2
Met-5A proliferation assay (3,000 cells, 72 h)
PAR
2-AP inhibits cell proliferation
Log [2-Furoyl-LIGRLO-NH2] (M) Ab so rb an ce 4 5 0 n m (% o f co n tr o l)
36 B Cont rol -AP 2 M PA R 10 -AP 1 M PA R 10 -AP 1 M PA R AP + 10 2-M PA R 10 0 25 50 75 100 125
***
***
***
### 10 M 2-Furoyl-LIGRLO-NH2 10 M TFLLR-NH2 10 M 2-Furoyl-LIGRLO-NH2 + 10M TFLLR-NH2 A b so rb an ce 4 5 0 n m (% o f co n tr o l)Figure 4. Effect of selective PAR2-AP on Met-5A (panel A) and NCI-H28 (panel B) cells, in presence and absence of PAR1-AP. Cells were seeded at a density of 3 x 10
3
cells/well and stimulated with the agonist for 72 hours. Data shown are mean ± SEM of at least three independent experiments. Values that are significantly different from control value (* p<0.05; ** p<0.01; *** p<0.001) and from the value with one peptide (# p<0.05; ##
p<0.01; ### p<0.001), as determined by ANOVA followed by Bonferroni’s multiple comparison test, are indicated.
In Met-5A cells, the proliferative effect of thrombin was modestly reduced by the PAR1
antagonist, SCH 79797 while in NCI-H28, thrombin-induced proliferation significantly decreased in the presence of the receptor antagonist (Fig. 5, panel A and B).
37 A cont rol 1 nM thro mbin 10 n M th romb in 50 n M th romb in cont rol 1 nM thro mbin 10 n M th romb in 50 n M th romb in 0 25 50 75 100 125 Met-5A Met-5A + 100 nM SCH 79797 *** ** ** Ab so rb an ce 4 5 0 n m (% o f co n tr o l) B cont rol 1 nM thro mb in 10 n M th romb in 50 n M th romb in cont rol 1 nM thro mb in 10 n M th romb in 50 n M th romb in 0 25 50 75 100 125 NCI-H28 NCI-H28 + 100 nM SCH79797
H28 cell proliferation in the presence and absence of a PAR
1antagonist
***
***
***
***
## ### A b so rb an ce 4 5 0 n m (% o f co n tr o l)Figure 5. Thrombin induced proliferation of Met-5A (panel A) and NCI-H28 (panel B) cells, in the presence and
absence of PAR1 antagonist. Cells were seeded at a density of 3 x 10³ cells/well and stimulated with the agonist for 72 hours. Data shown are mean ± SEM of at least three independent experiments. Values that are significantly different from control value (* p<0.05; ** p<0.01; *** p<0.001) and from the reference value in Met-5A (# p<0.05; ## p<0.01; ### p<0.001), as determined by ANOVA followed by Bonferroni’s multiple comparison test, are indicated.
Moreover, Met-5A and NCI-H28 cell proliferation induced by SFLLRN-NH2 was only
modestly reduced in the presence of SCH 79797 (Fig. 6, panel A and B) indicating that this activating peptide stimulate cell proliferation through independent activation of both PAR1
38 A cont rol 2 M S FLL RN-NH 1 2 M S FLL RN-NH 10 2 M S FLL RN-NH 100 cont rol 2 M S FLL RN-NH 1 2 M S FLL RN-NH 10 2 M S FLL RN-NH 100 0 25 50 75 100 125 150 Met-5A Met-5A + 100 nM SCH 79797
**
*
Ab so rb an ce 4 5 0 n m (% o f co n tr o l) B Cont rol 2 M S FLL RN-NH 1 2 M S FLL RN-NH 10 2 M S FLL RN-NH 100 Cont rol 2 M S FLL RN-NH 1 2 M S FLL RN-NH 10 2 M S FLL RN-NH 100 0 25 50 75 100 125 NCI-H28 NCI-H28 + 100 nM SCH79797***
***
*
A b so rb an ce 4 5 0 n m (% o f co n tr o l)Figure 6. Non-selective PAR1-AP induced proliferation of Met-5A (panel A) and NCI-H28 (panel B) cells, in the presence and absence of PAR1 antagonist. Cells were seeded at a density of 3 x 10³ cells/well and stimulated with the agonist for 72 hours. Data shown are mean ± SEM of at least three independent experiments. Values that are significantly different from control value (* p<0.05; ** p<0.01; *** p<0.001), as determined by ANOVA followed by Bonferroni’s multiple comparison test, are indicated.
39
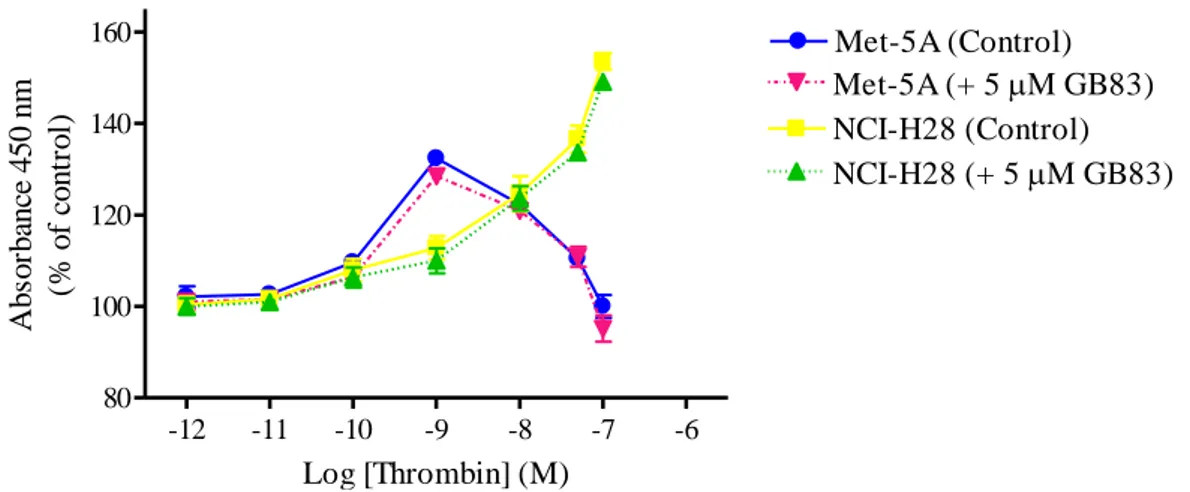
Finally, we examined the effect of the PAR2 antagonist, GB83, on thrombin-induced
cell proliferation. This antagonist modified the proliferative response of neither Met-5A nor NCI-H28 cells (Fig. 7) suggesting that PAR1 tethered ligand does not transactivate PAR2 in
these cells. Moreover, these experimental evidences support the existence of altered PAR1
and PAR2 signaling in the malignant mesothelioma cell line.
-12 -11 -10 -9 -8 -7 -6 80 100 120 140 160 Met-5A (Control) Met-5A (+ 5M GB83) NCI-H28 (Control) NCI-H28 (+ 5M GB83) Log [Thrombin] (M) A b so rb an ce 4 5 0 n m (% o f co n tr o l)
Figure 7. Thrombin-induced proliferation of Met-5A and NCI-H28 cells in the presence and absence of a PAR2 antagonist. Cells were seeded at a density of 3 x 10³ cells/well and stimulated with the agonist for 72 hours. Data shown are mean ± SEM of at least three independent experiments.
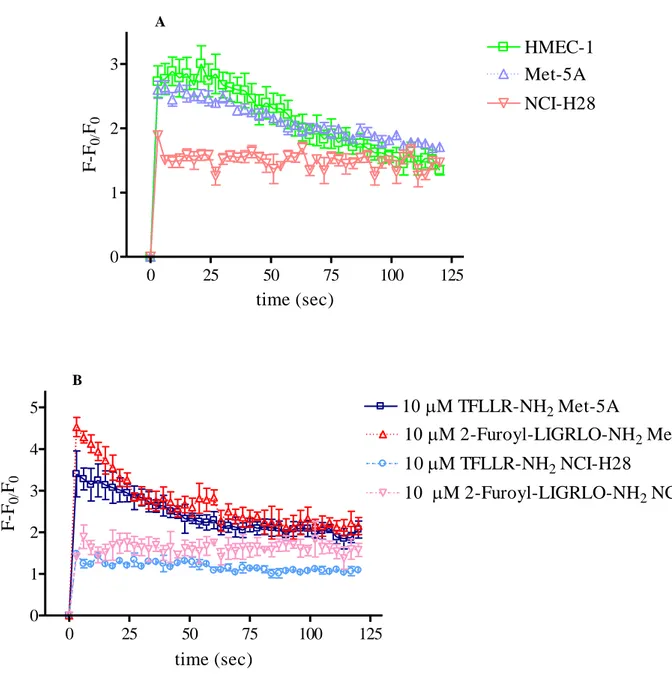
In order to address this question, receptor-induced Gq, G12/13, and Gi signaling pathways
were examined. First, we investigated PARs-activated Gq signaling by analyzing intracellular
Ca2+ mobilization after cell stimulation with either thrombin or PAR-APs. To measure Ca2+ transient, Fluo 3-AM and a Wallac 1420 multilabel counter microplate reader were utilized as described under Material and Methods. As indicated by relative fluorescence increase, both thrombin (10 nM) and selective PAR-APs (10 µM) induced rapid and transient increase of [Ca2+]i in Met-5A as well as in microvascular endothelial cells (HMEC-1) (Fig. 8, panel A
and B). On the contrary, in NCI-H28 cells, thrombin- and PAR-APs-stimulation did not cause any rapid increase of [Ca2+]i (Fig. 8, panel A and B). However, Met-5A and NCI-H28
40
showed similar expression levels of proteins involved in this signaling pathway, such as Gαq
and phospholipase C-β (PLC-β) isoforms (data not shown).
A
Thrombin induced intracellular calcium mobilization
0 25 50 75 100 125 0 1 2 3 HMEC-1 Met-5A NCI-H28 time (sec) F -F0/ F0 B 0 25 50 75 100 125 0 1 2 3 4 5 10M TFLLR-NH2 NCI-H28 1 M TFLLR-NH2 Met-5A 1 M 2-Furoyl-LIGRLO-NH2 Met-5A 1 M 2-Furoyl-LIGRLO-NH2 NCI-H28 time (sec) F -F0/ F0
Figure 8. Intracellular Ca2+ mobilization induced by thrombin (panel A) and selective PAR-APs (panel B) in HMEC-1 (2 x 10⁴ cells/well), Met-5A (1.5 x 10⁴ cells/well) and NCI-H28 (1 x 10⁴ cells/well) cells. Cells were loaded with Fluo-3AM to measure [Ca2+]i variations as indicated by changes in fluorescence intensity. Fluorescence was monitored for up to 120 seconds. Data are mean ± SEM of at least three independent experiments and are reported as percent of maximal relative fluorescence (RF = (F – F0)/F0 where F0 is basal fluorescence and F is fluorescence recorded after cell stimulation with the agonist).
41
Next, we examined PARs-induced G12/13 signaling by measuring RhoA activation after
cell stimulation with either thrombin or PAR-APs. To detect RhoA activation the RhoA G-LISA® kit from Cytoskeleton was used as described under Material and Methods. In Met-5A cells, 10 nM thrombin induced a significant 2.5-fold increase of RhoA activation while in NCI-H28 cells the increase was just 1.2-fold (Fig. 9, panel A). The selective PAR1-AP (10
µM) was less effective in stimulating RhoA activation than thrombin in Met-5A cells but it still caused a significant ~2-fold increase (Fig. 9, panel B). Similarly to thrombin, PAR1-AP
induced a modest increase of RhoA activation in NCI-H28 cells (Fig. 9, panel B). Stimulation of both Met-5A and NCI-H28 cells with the selective PAR2-AP (10 µM) did not
induce any RhoA activation (Fig. 9, panel C). It is important to mention that in both cell lines the expression levels of Gα12, Gα13, and RhoA were similar (data not shown).
A Con trol 10 n M th romb in Con trol 10 n M th romb in 0 1 2 3 Met-5A NCI-H28
***
**
##Thrombin induced RhoA
activation
R h o A ac ti v at io n (f o ld o v er b as al )42 B Cont rol 2 -NH M T FLLR 10 Cont rol 2 -NH M T FLLR 10 0 1 2 3 Met-5A NCI-H28
***
*
## R h o A a ct iv at io n (f o ld o v er b as al ) C Cont rol 2 2-Fu royl -LIGRL O-NH M 10 Cont rol 2 2-Fu royl -LIGRL O-NH M 10 0 1 2 3 Met-5A NCI-H28 R h o A ac ti v at io n (f o ld o v er b as al )Figure 9. RhoA activation in response to thrombin (panel A), PAR1-AP (panel B) and PAR2-AP (panel C) in Met-5A and NCI-H28 cells. RhoA activation was measured using RhoA G-LISA® kit from Cytoskeleton. Data shown are mean ± SEM of at least three independent experiments. Values that are significantly different from control value (* p<0.05; ** p<0.01; *** p<0.001) and from the reference value in Met-5A (# p<0.05; ## p<0.01; ###
43
Finally, thrombin- and PAR-APs-induced inhibition of isoproterenol stimulated cAMP accumulation was examined in both Met-5A and NCI-H28 cells. In Met-5A cells, 10 pM to 1 nM thrombin inhibited isoproterenol stimulated cAMP production in a concentration dependent manner reaching 50% inhibition at 1 nM (Fig. 10, panel A). However, at higher thrombin concentrations (1 nM to 100 nM) the inhibitory effect was progressively reverted. In the presence of the PAR1 antagonist SCH 79797 the inhibitory effect of thrombin was
significantly reduced indicating that PAR1 mediates such effect. In NCI-H28 cells, thrombin
inhibited cAMP in a concentration dependent manner reaching 50% and maximal inhibition (~ 70%) at 1 nM and 100 nM, respectively (Fig. 10, panel A). In the presence of SCH 79797, the inhibition curve was upwards shifted and the maximal inhibition at 100 nM was only 42%. Various concentrations of the selective PAR-APs did not cause any inhibition of isoproterenol stimulated cAMP production in both Met-5A and NCI-H28 cells demonstrating the functional selectivity of these agonists.