Tor Vergata University, Rome, Italy
Department of computer, Systems
and Production Engineering
GeoInformation PhD Programme
XXII Cycle
Estimation of increasing urbanization trend in the
Frascati DOC wine area.
A geostatistical analysis approach
Emanuele Loret
Mentors:
Prof. Maria Ioannilli
Dr. Luigi Fusco (ESA/ESRIN)
Coordinator: Prof. Domenico Solimini
ABSTRACT
This thesis collects data of some research projects on agricultural practices, particularly wine, developed in an area south-east of Rome known as the Castelli Romani area. This set of information was analyzed in relation to urban growth on the outskirts of the town of Rome and the municipalities of the first ring, inserted in an area of the Frascati DOC wine production. The research work was then concentrated on a methodology of investigation on the characterization of the various municipalities in DOC production. It was therefore prepared a profile of the index (APindex) which in addition to precisely define the characteristics of a municipality than another, allowed to make predictions about the future of urban development to the detriment of agricultural crops.
Il presente lavoro di tesi raccoglie i dati di alcuni progetti di ricerca svolti sulle pratiche agricole, in particolare vitivinicole, in un area a sud-est di Roma, conosciuta come area dei Castelli Romani.
Queste informazioni sono state analizzate in rapporto alla crescita urbana della periferia del comune di Roma e dei comuni di prima fascia, inseriti nel confine dell’ area di produ-zione del vino DOC Frascati . Il lavoro si è poi concentrato su una metodologia di indagi-ne per caratterizzare i vari comuni compresi indagi-nell’area di produzioindagi-ne DOC; per questo è stato elaborato un indice di profilo dell’area (APindex) che oltre a definire le caratteristi-che di un comune rispetto ad un altro, ha permesso di fare delle previsioni temporali sullo sviluppo urbano a scapito delle colture agricole.
Index
1 Aim of the thesis 7
2 State of the art 9
2.1 Urban growth evolution and cultivated areas
reduction: The urban sprawl problems. 9
2.2 The indicators 10
The DU (Urban Density level) 11 The IFI (Infrastructural Fragmentation Index) 12 The Urban Fragmentation Index 12 The Expected Urban Growth Index IEUP 13
The Sprawl index (Is) 13
2.3 The information sources 15
3 The proposed index 17
3.1 The logic of this index 17
3.2 Technical application 21
4 Application to the Frascati DOC 23
4.1 Study area 23
4.2 The previous study 28
4.2.1 Cartography, and map data 29
4.2.2 Satellite data 31
4.3 Application of the index to the entire
Frascati DOC area. 33
4.3.1 Grottaferrata municipality 36 4.3.2 Monteporzio municipality 39
4.3.3 Rome municipality 42
4.3.4 Montecompatri municipality 45 4.3.5 Frascati municipality 45
4.4 The forecasting model 48
5 Validation 54
6 Discussion and Conclusion. 62
7 Comment on the current situation
8 and Bibliography 66 - 70
List of Figures
Fig. 1 Figure 1_ demography of the city of Rome 23 Fig. 2 The urban sprawl spill out the ring of the GRA
and the urban welding with neighbouring
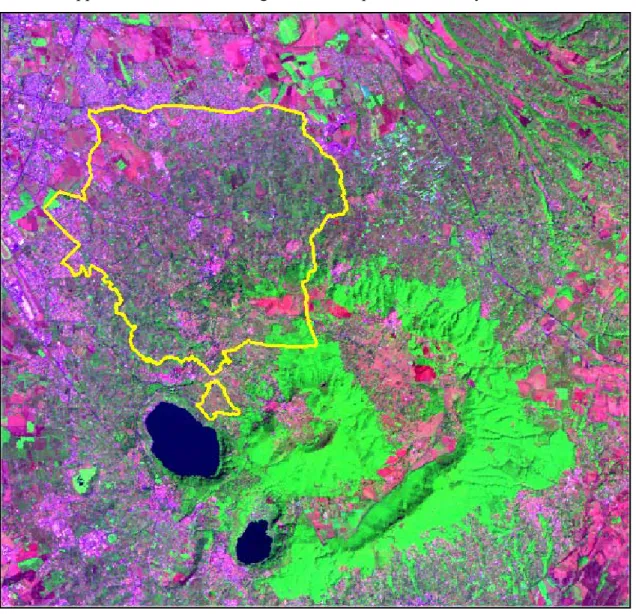
municipalities (from E. Loret, ASITA 98). 24 Fig. 3 Landsat TM (RGB 7,4,1) image of the DOC area. 25 Fig. 4 Location of crops (green) and urban areas (red)
within the DOC boundaries. In these boundaries 5
municipalities are included (2005). 33 Fig. 5 Index values for crops (shades of green) and urban
areas (shades of orange). 35
Fig. 6 The diagram shows the evolution of the index for
the DOC area. 35
Fig. 7 Location of crops and urban areas in the
municipality of Grottaferrata (2005). 36 Fig. 8 Grottaferrata :application of the index: number
of cells involved. 37
Fig. 9 Evolution of the index for the Grottaferrata
municipality. 38
Fig. 10 Location of crops and urban areas (2005). 39 Fig. 11 application of the index: number of cells involved 40 Fig. 12 Evolution of the index for Monteporzio municipality. 41 Fig. 13 Up: Rome and its municipalities.
Down: location of crops and urban areas. 42 Fig. 14 application of the index: number of cells involved 43 Fig. 15 Evolution of the index for Rome DOC area. 44 Fig. 16 Location of crops and urban areas in the Frascati
boundaries (2005). 45
Fig. 17 Index values for crops and urban areas. 46 Fig. 18 Evolution of the index for Frascati. 47
Fig. 19 Table fields attributes of the “fragricoltura” shape file. 49 Fig. 20 Flow of commands for Area profile crops index. 50 Fig. 21 Flow of commands for Area profile urban index. 51 Fig. 22 Flow of commands for the calculation of the
forecasting model. 52
Fig. 23 Forecasting model of “fragricoltura” shpfile: red
areas are crops in danger. 53
Fig. 24 Map of the spatial distribution of forecast change in land use, from agricultural to urban, obtained from the semivariogram. The scale represents the
probability of change and the red colour indicates
the higher probability . 55
Fig. 25 Analysis flow using “CoKriging method”, where “Tendcolt” and “Tendurb” are fields of co-variant dataset. At the centre of the figure are the 2 vector
shapes used to cut. 56
Fig. 26 The cross-validation and our values 57 Fig. 27 In red the missing particles for the Frascati
municipality. where in green are the crops that
remain in 2008. 58
Fig. 28 Particles of crops that have been urbanized
from the 2002 (QuickBird) to the 2008 (Kompsat2). 59 Fig. 29 The DOC area. Green: the vineyards present
in 2008; Red: the (missing) vineyards
present in the 2002. 60
Fig. 30 Some changes between 2004 (left) and 2008 (right). 61 Fig. 31 The graphic of urban Ap index very low (ref. table17). 63 Fig. 32 The four graphics of AP index for the
List of Tables
Tab. 1. Data from "Camera di Commercio of Rome. 27 Tab. 2. Data set of the maps and cartography. 30 Tab. 3. Data set of the satellite images used in this
research work. 32
Tab. 4. Application of the index: number of involved cells 34 Tab. 5. Index values for crops and urban areas 34 Tab. 6. Values for the Urbanval and Agrival fields 49 Tab. 7. Loss of crops for Frascati municipality between
2002/04 and 2008. 59
Tab. 8. Loss of farmland between 2004 and 2008 for the
entire DOC area. 61
1_AIM OF THE THESIS
Aim of this thesis is the definition of a methodological framework for the determination and analysis of urban sprawl tendency, which are formulated within wider study areas, such as administrative regions of Frascati DOC in the Castelli Romani area, near Rome, Italy. To this end, application of the GIS methodologies is used to understand the urban sprawl phenomenon in the agricultural sites and to predict the trend of this phenomenon in future.
The complex landscape of the Castelli Romani (Alban Hills volcano enclave) shows a remarkable worsening from natural conditions. Primary causes of this degeneration are the pressure of the urban development in the metropolitan area of Rome, and the heavy traffic on main and local roads. These problems interfere with agricultural practices and timber harvest activities. As a consequence, human land-cover and land-use consumption has caused an evident decline to Roman Hills forest and typical agricultural practices, olive groves and vineyards firstly.
The quality of the latter has been analyzed, since at least 20 years, from ESA-ESRIN and University of Rome “Tor Vergata”, as reported in several specialized works [22, 13, 28, 10, 9, 23].
In order to have an idea about the size of these land use changes, we began to use satellite survey information to extract output data for its processing in an Informative System. Therefore, the purpose of the present work is to analyze a small suburban area, near Rome, through satellite images and geo-statistical GIS data. For this reason, our database has been integrated with statistical, typological, dimensional and textual information regarding Frascati D.O.C. vineyard area (that includes five municipalities, covering a territory of about 8000 ha.), providing pattern data for a complete investigation and planning of the area of interest.
2_ STATE OF THE ART
2.1_Urban growth evolution and cultivated areas reduction: The urban sprawl problems.
“Urban sprawl constitutes a kind of urban colonization of the countryside, but that is not a “natural” process induced by necessity, but an exponent of speculative development, private land hoarding and often the private appropriation of values created by public investments.” [11]. Paraphrasing Patrick Geddes [14], who in 1915 wrote “the city is not a
place in a space but a drama in the time”, we can say that the real drama for the natural
and agricultural environment is its fragmentation and decrease forced by the expansion of urban areas. As claimed by Virginio Bettini [ 3], quoting Lewis Mumford's “The myth of the machine”, a city is a structure that fails to achieve any level of balance, that can not be
governed by a feedback function, because the negative feedback of the city, that is the management of directors does not know the subject on which acts their feedback.
A vision of the city compared to a biological species placed in a land without natural enemies or environmental limits, a species that grows at the expense of native forms. A city that turns into a megalopolis, with disregard for the rules, purpose and human needs and to operate on principles such as: power, property, publicity, personality, progress, in a system that is at once an ecological, cultural and personal desert.
Nowadays, unfortunately, we are inclined to think that the extensive growth of urban areas affecting agricultural lands is a normal phenomenon. The impact of urban sprawl in relation with rural areas is evident in many “European megacities”, such as London or Moscow, due to the population move in suburban areas.
But the same problem occurs also in less gigantic urban areas: in Glasgow and Liverpool (UK), the combined urban population was reduced of 38% in 1970; in the same year there was an urban population shift of 12% in Marseille and of 9% in Paris (France), of 26% in Milan and 15%, in Naples (Italy), while the metropolitan areas of those cities increased. On the contrary, in the area of Milan in the Lombardia Region the urban sprawl had a minor and slower impact [32]. In all these cases, we observe that the phenomenon of urban sprawl is often accompanied by urban fragmentation and the spread of a mesh of large size
buildings in the area.
May ultimately determined that “Sprawl” is pattern and pace of development, in which rate of land consumption for urban purposes exceeds the rate of population growth, resulting in an inefficient use of resources and of land.
Critics of sprawl argue that urban expansion encroaches excessively on agricultural land, leading to a loss of amenity benefits from open space as well as the depletion of scarce farmland resources [6] .
This critical phenomena are due to economical and political matters that, not taking into account rural features nor environmental needs, make population move from the center to the periphery of the city.
The remedy is, therefore, only the political choice to plan a city in the opposite direction, reconsidering the functions of the central area.
2.2_The indicators
Models are simplifications of reality, theoretical abstractions that represent systems in such a way that essential features, crucial to the theory, and its applications are identified and highlighted. In this role, the models are a vehicle to enable experimentation with theory, in a predictive sense, and to enhance understanding that may be the first step to predict situations, as yet unrealized, for example in the future [2] .
A similar concept was incorporated in 1995 W.R.I. report [38], which states that
“indicators are an empirical model of reality and not reality itself. “. In the same report, some characteristics, which would make more effective the function of the indicators themselves, are suggested:
1) usefulness and comprehensibility for the user
2) importance for the environment and the pressure of human activities. 3) high capacity for synthesis
In fact, indicators are at the top of the pyramid information, whose base consists of a large number and variety of data and information on various aspects of the environment. The selection and the elaboration of this data require modeling of the phenomena to be studied, also require a simplification of the problems that must be controlled and monitored and a limited number of variables that can be measured and aggregated. Urban sprawl is a phenomenon that lends itself very well to be modeled. Growth of the city on the one side and decrease of crops on the other side can be measured and studied.
In order to study this phenomenon, some scientists [2, 16, 4, 30, 20, 17, 24] have applied many indicators and numeric models in the fields of nature protection, land cover and land use, soil, marine and coastal areas and also urban areas.
In the methodology adopted for a cost benefit analysis in an environmental context, often several way of measuring are used: in particular, the size of the phenomena considered are analyzed using specific indicators suitable for the measurements of different physical, chemical, ecological and social aspects, etc..
The problem, then, becomes that of choosing the optimal indicator for measuring individual factors and make comparisons with alternative methodologies. Indeed,
indicators are only a "sign" of a possible effect on the environment, they are not a measure of the effect itself and, if badly chosen, they can also "indicate" a different effect from the one that will be in fact produced [5].
Here, we present briefly some methodological approaches for the problem and then we discuss a proposal for a specific indicator to describe the consumption of agricultural land, our case study. Especially urban patterns, shaped through formal and informal policies, allowed the identification of driving forces to understand and improve urban planning processes in this important field of research. It is evident that urban sprawl has negative effects on rural areas, as it leads to extensive patterns of peripheral and suburban
development. The spreading of a city and its suburbs over rural land brings changes to land use and, consequently, to agricultural soil consumption.
We review this research field, focusing on the indexes where the number of processes and variables is limited. Among the index data for evaluating the transformation level of landscapes suggested by the above mentioned authors, the followings urban index are shown below:
2.2.1_The DU (Urban Density level)
average percentage between a rural area (or building area) and the total urban sprawl surface for each square Km of land pattern referred to :
Du = Sc/St (1)
where:
St = reference area
However, this index does not always adequately reflect the phenomenon of urban fragmentation [20].
The IFI (Infrastructural Fragmentation Index)
where the index value depends on infrastructural urban areas spreading along highways, railways and road networks.
2.2.2_IFI = Σ (Li *oi) * Np/At *p (2)
where:
Li = Length of the infrastructure (excluding tunnels and viaducts);
oi = Obstruction coefficient of the infrastructure, depending on the type of infrastructure and traffic flow;
Np = Number of parts where the reference territorial unit is fragmented by the road network;
At = Area of the reference territorial unit; p = Perimeter of the reference territorial unit.
This index is much higher in value as the mesh represents dense and occlusive roads.
Linear urban fragmentation can be measured using the Urban Fragmentation Index (UFI):
2.2.3_UFI = Σ(Li * √Si)oi / At (3)
where:
Li = Maximum size of the linear urban barrier of the i type; Si = Surface of the urbanized area of the i type;
oi = Coefficient expressing the level of obstruction that is characteristic of the various types of urbanized areas for the species considered.
It is assumed that for the same size as the composition, the circular shape is one that minimizes environmental fragmentation.
The index value is linked to the shape and linear extension of urbanized areas, for which the urban density, calculated through a buffer around each building, is checked in connection with the urbanized area perimeter together with the circular area perimeter that is a
summation of all densely populated areas (total urban sprawl). The UFI and IFI indexes are valid on regional scale, but on a local scale characteristics of fragmentation can escape identification [33].
The Expected Urban Growth Index IEUP
2.2.4_IEUP = Ap/Aa (4)
where:
Ap = area planned for new urban zones Aa = current urban area
This index uses the urbanized area predicted by the adopted planning instruments along with the actual surface of urbanization to make a forecast of land consumption for urban sprawl.
The Sprawl index (Is)
2.2.5_Is = ce * ta * pt * cr (5)
where:
ce = setting out coefficient ta = accessibility time coefficient pt = slope coefficient
cr = production level of the soil coefficient
At the end of this summary, we must consider that indexes tend to describe the spatial and functional organization of system components.
Often, an index involves more than one aspect of this organization and that results in a loss of relationship between the measure and the specific system component. Moreover, since systems that the indexes tend to measure are typically dynamic, they must be determined explicitly in terms of hypotheses about the processes taking place in the systems, otherwise it is easy to define a genuine correspondence between the value resulting from an index and a corresponding clear and meaningful information. Then, to define a better match between the values calculated from an index and the spatial configuration typical of a dynamic system has been necessary to develop a new specific index for the phenomenon of urban sprawl that we wanted to investigate.
2.3_The information sources
However, accurate and operational modeling of urban growth and land use change still presents us with some major challenges. Predominant among these are data availability and the need for improved methods and theory in modeling urban dynamics [18, 21, 37]. All indexes firstly described are often used based on information obtained from maps or charts frequently obsolete, outdated or updated but with only limited information.
This is (unfortunately) typical of many maps produced in Italy by local authorities such as regions, provinces or municipalities, in which no one takes care of the quality of
information.
To obtain better information on land cover, remote sensing offer good potential as a tool, easy and relatively cheap for mapping and for quantify spatial objects: it is primarily a matter of map scale and sensor resolution. On the other hand, satellite image survey provides real land use classification with images at medium, high and very high resolution and with quality assurance for numerous land use classes. Such data elaborated in a GIS environment can provide a detailed picture of the territory to be examined. However, in the case of the “Corine Land Cover”, produced by the European Union with information taken from satellites, the values of indexes are provided on a too small scale. This hinders the development of GIS to a very fine spatial scale.
In these cases, very high resolution satellite information must be used, which is much more accurate than our regional maps (for example: CTR at 1:10.000). The integration of data from remote sensing in the Frascati DOC area GIS is an effective tool to assess and quantify the reduction of farmland and uncontrolled urban growth. The use of satellite imagery allows two ways to be taken in order to obtain measures of spatial objects: digitization (photo interpretation) and classification (automatic or semi automatic).
This paper has analyzed the first option using VHR satellite images as the basis of information for the development of a dedicated GIS.
Data was then updated by adding information about the cultivation of agricultural crops, olive groves and urban areas, by using a QuickBird image of 2005. Then, obtained data were processed through an “Area Profile" index, for all 5 municipalities and for entire DOC area. This index then was used to calculate and predict the extent of growth of the urban area of Frascati and the loss of our vineyards.
3_THE PROPOSED INDEX 3.1_The logic of this index
Our first objective was to study the human pressure on all the Frascati DOC area and their municipalities to monitor the effects of urban sprawl. The study covers an area of about 8290 hectares and it has been done to highlight the impact of the urban areas growth (urban sprawl) within rural areas and also to identify the productive potential of the remaining countryside areas.
To assess the impact of the urban sprawl on the agricultural areas, this work has developed an index, named Area Profile, based on the topological comparison among different land uses, by using a GIS.
GIS (Geographic Information Systems) is a system of hardware and software used for storage, retrieval, mapping, and analysis of geographic data. Practitioners also regard the total GIS as including the operating personnel and the data that go into the system. Spatial features are stored in a coordinate system (latitude/longitude, state plane, UTM, etc.), which reference to a particular place on the Earth. Descriptive attributes in tabular form are associated with spatial features. Spatial data and associated attributes, in the same
coordinate system, can be layered together for analysis and mapping (http://
www.nwgis.com/gisdefn.htm). GIS have become an essential tool for combining satellite images with various sources of information in models that simulate and provide
interactions of complex anthropic–rural systems. Typically, a Geographical Information System is used for handling maps of different kinds in several different layers, where each layer holds data about a particular kind of feature. Each feature is linked to a position on the graphical image on a map and to a record in an attribute table.
The use of GIS methodology allows the visualization of variables spatial distribution, the use of complex databases, the integration with statistic and geostatistical analysis, the elaboration and integration of information on spatial basis pointing out the relation and the political choices in urban sprawl analysis.
The Area Profile Index (API) is a measure of the spatial profile of each land use class in a reference area, where the spatial profile is evaluated in term of spatial pattern of each land use and spatial relationship among different land uses.
By using the Area Profile Index, a Forecasting Model has been developed, in order to identify the areas with the higher risk of change in a reference period. To asses the accuracy of the Model, a validation analysis has carried out.
To built up the API for a specific typology of land use, we use thegeostatistical analysis with the aim to obtain some basic measuresof the spatial distribution of uses, both for municipals and total DOC areas.
These measures are manly based on:
• density distribution (of urban areas and agricultural practices) analysis;
• Interpolation of data by stocastic method.
To build up the API for each land use class (x), in fact, we:
• calculate the density distribution of the land use x, referred to a 50 x 50 meters grid
• classify the density distribution into 5 classes (i)
• calculate the distribution of the land use surface in each density class (i)
• compare the distribution to the total land use area in class x and to the whole reference area (municipal area and DOC area).
The Area Profile index formula is:
(6)
where :
APIxi = Area Profile Index for the density class i and the use x
Sx = total area for the specific use (x)
Ci = number of cells in class i (density)
Ct = total cells
St = municipal area
In this work, a GIS multirelational database was built and integrated with geophysical, topographic, urbanistic and geostatistical data. In analysing the relationship between urban areas and rural ones, it is important to relate the mode of development and consumption of soil in planning at regional, provincial and municipal levels.
The Area profile Index was defined in order to produce a quantitative descriptive summary of the spatial arrangement of the different land uses, that makes easy to understand the environmental framework of the territory.
For the elaboration of the Area Profile Index we adopted a logic model based on the measurement of the spatial relationship among density distribution of each land use and on the comparison among each distributions and the global amount of each specific land use area.To calculate the API we classify the study area in two land use classes agricultural / urban. The API has been applied in order to analyse the the specificity of a municipality with respect to others and to compare each municipality prfile with the entire production area of the Frascati DOC.
An index that considers only two variables may seem ill-equipped, but in this case we have two variables that are inversely related: increasing the first, the other decreases. For our area, urbanization increase goes always with farmland consuming, and the phenomenon of urban sprawl is prevalent on compact urbanization. This index adds information that characterizes each municipality with a synthetic value, notwithstanding the size of the country. Moreover, this index also takes into account how urban areas and crops are distributed and makes visible that distribution.
The API operates over more or less large areas, generating a summary of the environmental state to assess the profile of the area with the following objectives:
1. Calculate the size of the elements in the analysis; in this case, agricultural and urban extensions;
2. Analyze qualitative and quantitative levels of "compromise" of the components involved;
3. Assess the evolution of these components to control the phenomenon; 4. Articulate appropriate actions for a better land use planning;
5. Predict the environmental impact.
For this last objective, the index is the basis for the forecasting model that is applied only to the municipality of Frascati. The prediction model (ref. cap.4.5) takes as input the values of the indexes (urban / agricultural) and combines them with the weights that were
calculated on the basis of data planning. Then, by applying the API (6) we give a measure of the present environmental conditions; later by applying predictive algorithms (7 - 8) we will give a measure of the changes and an assessment of the effects of changes in dynamic form.
Finally, the entire territory surface has been shaped making patterns of all agricultural areas (vineyards and olive groves) to quantify the economical productive effects of urban sprawl on rural lands.
3.2_Technical application
The urban and agricultural data analysis for Grottaferrata, Frascati, Monteporzio, Roma municipality and whole DOC area, has proceeded with the following procedure.
1. rural and urbanized areas were modeled with polygons produced from QuickBird images (series of 2002, 2004 and 2005). Initially, the shape file of the output data was used to detect only the cultivation of vineyards, and then created a new feature
(cultivations), which also included the cultivation of trees and olive groves and, finally, everything has been updated prior to 2005 and then for the year 2008 by means of a VHR Kompsat2 satellite image.
The main fields of the table attributes are "type" and "area", in order to define the type of crop and to measure the surface. The same type of updating has been used for urban areas (shape file for buildings) in order to analyze the density in that area.
2. Polygons of the shape file represent crops and buildings have been transformed from vector to raster formats. The system is partitioned into physical zones, or cells, which are small enough to illustrate individual and historical characteristics, such as distinct land uses. Thus, data of the entire area of the map are subdivided into a grid of tiny cells, where the value is stored in each of these cells to represent the nature of whatever is present at the corresponding location on the ground. We use a 10 x 10 m. grid to convert the building polygons and a 50 x 50 m grid to convert the polygons concerning crops.
3. From these cells, with the "conversion raster point" we extract the centroid of the polygon.
4. Then, having applied the Kernel density function to “centroids” (a spatial analyzer tool for surveying densely populated areas), a “Grid file” was obtained for estimating the statistical values of the density function. The raster (GRID) file has been reclassified into 5 classes (gridcode value), corresponding to an already acknowledged field “value”. Output data in this field varied from a “very low” to a “very high” value. 5. Subsequently, the raster file was converted back into vector format, preserving the value of the 5 classes in the attribute table, and was cut on the basis of the different boundaries (limits) of selected municipalities.
6. The next step was to create a grid file (vector) with cells of 50 x 50 square meters, which corresponds to an old local length measure called “Pezza or mezza Quarta Frascatana” [26], and add it to the file previously produced.
7. After having reworked the selected fields and counted the cells extracted for each value, the API (6) for both rural and urban areas were calculated to make a characterization of the territory under study.
Here, we illustrate and discuss the application of this index to the whole DOC area and to the 5 municipalities. The application of the index has gone further only for the town of Frascati, since, in fact, we could use the data from the provincial and municipal planning. This allowed us to make a temporal projection for the crops at risk of disappearing.
4_APPLICATION TO THE FRASCATI DOC 4.1_Study area
The city of Rome is characterized by a large Municipal Territory, for which urban
penetration in surrounding Municipalities caused an impressive increase of buildings and population in those areas.
Given the history of demographic changes in the last hundred years, we see that in 1921 the Roman population was some 691,000 individuals.
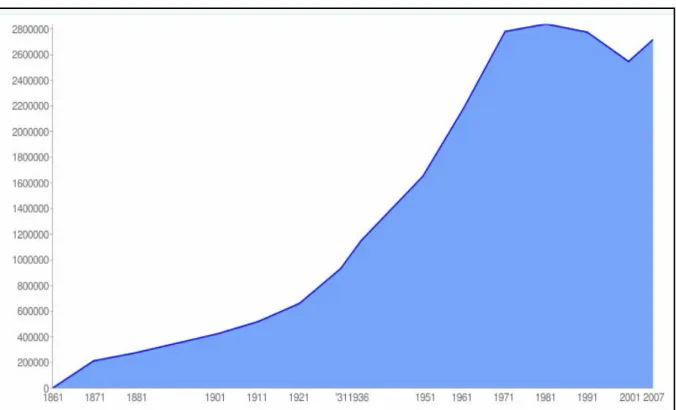
Fig. 1 demography of the city of Rome
Then, since the '30s, the population increased: in 1941 it was already up to 1,415,000 and immediately after the war, with the 1951 census, the Romans were 1,651,754. In the '50s and '60s population continued to grow, especially with new immigrants, and 20 years later, in 1971, there were 2,781,993 inhabitants, an increase of 59%.
The increase of population still continued in 1981 with 2,840,259 residents, but by then it began an opposite phenomenon. From 1981 to 2001 the growth stopped in the capital, with a simultaneous move of population to surrounding municipalities.
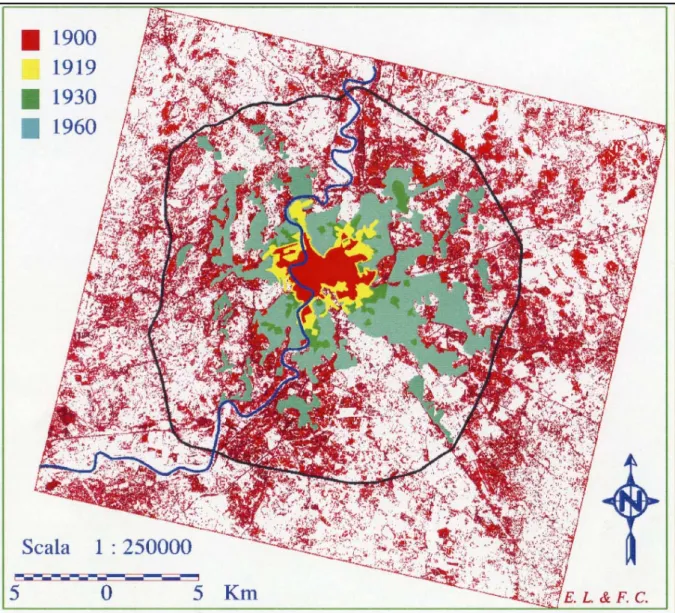
If the size of ancient Rome until 1870 was limited by the city walls, up to 1970's it was contained inside the ring of the GRA, within about 34515 ha. Currently, we can observe a spill of the city outside the GRA and a real urban welding with neighbouring
municipalities.
FIG. 2 The urban sprawl (from Landsat TM 1997 classification) spill out the ring of the GRA and the urban welding with neighbouring municipalities (from E. Loret and F. Cadoni, ASITA 98).
In terms of the buildings settlement, it can be observed that the considerable demand for new residences and a property aggressive market cause forms of consumption of land in the metropolitan hinterland.
This phenomenon is now extremely massive, with wide spread of the "built" on soils agricultural and the consequent fragmentation of the ecosystems.
And this is the unfortunate end of the "Campagna Romana", as it has been transmitted by painters and travelers of the "Grand Tour": the compact city gives way to a polinuclear metropolis with a population density variable from area to area. It is also the beginning of a profound change for the community of surrounding border municipalities, where, within a framework of very lax laws, began the phenomenon of illegal building and the logic of speculation that produces the dispersion of residential and industrial buildings everywhere and the disappearance of traditional agricultural crops, such as vineyards and olive trees.
The area most 'at risk' is the Castelli Romani (Alban Hills volcano), where as many as 8 areas of Denomination of Controlled Origin (DOC) reside: Frascati, Castelli Romani, Colli Albani, Colli Lanuvini, Marino, Montecompatri, Velletri e Zagarolo. Frascati D.O.C vineyards area is situated at about 20 km from the urban center of Rome in the North-West site of the big Laziale Volcano enclave.
Frascati DOC wine production boundaries is included in the administrative area of the following Municipalities: Frascati, Monteporzio Catone, part of Rome and Montecompatri, covering a total rural area of 8297 ha [13].
As far as it concerns medium/high wine factories, we observe a relevant improvement in wine production excellence, which raised the local economy. In fact, the rural area of Frascati DOC wine in 2000 produced an average of 250.000 quintal of grapes that furnishes about 180.000 quintal of Controlled Origin Denomination (DOC) wine.
Twenty one Wine Factories are associated in the Frascati Cooperative. The latter collects grapes from the associated producers and holds a yearly wine production of 25.000.000 bottles of wine [8], of which only the 20% is sold in Italy and the rest exported abroad. A Monitoring System is provided to control both the productive process and the final product trade. This type of agriculture is getting critical due to the progressive loss of rural territory. ISTAT data [19], from local examination (schedario viticolo e denuncie di produzioni) confirms a rural territory surface decrease in the last twenty years.
In Lazio, the vineyards have been reduced to 22150 ha. and the rate of annual reduction, since 1962, stands at 4%, representing a decrease of 1,200 ha per year. This phenomenon is observed especially in the Province of Rome from data reported from 1982 to 2005, where urban sprawl caused a loss in rural territory surface of -63,4 % [34].
Concerning the area of the Frascati DOC, the Lazio Region has published the following data(Albo Camera di Commercio di Roma – Campagna vitivinicola 2006/2007):
return from “Disciplinare” (T/ha) average price 2006 Euro/T declared area 2006 (ha) 13 480 1685,83
4.2_The previous study
Remote sensing and GIS vineyards applications: The BACCHUS project.
This work is largely based on studies carried out in 1996-2004 for the BACCHUS project (Methodological approach for vineyard inventory and management -
EVG1-CT-2002-00075). Bacchus is a Research and Technological Development (RTD) project carried out
by IT experts and producers in 4 European countries (Portugal, Italy, France, Spain) to develop an innovative Geographical Information System for vineyard inventory and
management, based on the use of both airborne multispectral photography (up to 50 cm
resolution) and high resolution satellite images (IKONOS at 80 cm and QUICKBIRD at 60 cm). In Italy the project participants were: the “Consorzio per la tutela del vino Prosecco di Conegliano Valdobbiadene” and the “Consorzio di Tutela della Denominazione Frascati”. In 2004, the Bacchus project concluded with the following result:
“covering an area of about 8297 hectares, 1796 hectares of vineyards were identified…”. However, the analysis conducted in the Bacchus project did not take into consideration the land cultivated with olive trees, often mixed with vineyards: a mosaic of small plots interspersed with buildings.
Moreover, the analysis lacked a complete view of the interactions between agricultural area and urban area.
4.2.1_Cartography, and map data
In building a GIS, the work often requires the use of maps and charts of different types and scale. In Italy, this work poses many difficulties, because the cartographic production is delegated to different agencies, each of which draws charts with different characteristics. For Law 68 of 02.02.1960, the agency for the official State mapping is the Italian
Geographic Military Institute (IGMI), located in Florence. The series of papers produced fully cover the Italian territory in the scales: 1:100.000 (Fogli), 1:50.000 (Quadranti), 1:25.000 (Tavolette) and 1:10.000 (Sezioni).
All these charts use the kilometric grid in the projection UTM/UPS European Datum 1950 with the Hayford ellipsoid (Potsdam vertex). In 1970, with the implementation of
regionalism these regions began the production of maps for their jurisdiction, but with different projections than those used by IGMI. In the case of the Lazio Region, the regional technical map 1:10.000 (CTR) is prepared with the geodetic system Gauss Boaga (Roma 40), using the same ellipsoid of Hayford (International 1909), but with vertex in Rome Mount Mario. This implies an impediment to the perfect overlap of the two types of maps, with errors of 50-60 meters in longitude and up to 180 meters in latitude.
For this reason and also for the fact that the VHR satellite images have now become much more accurate than most maps, we conducted a GPS campaign that has allowed us to very accurately georeference a QuickBird image (50 cm.).
This image, which used a DTM derived from interferometry [28, 13], was the basis for all subsequent georeferencing work.
Even the maps have been geo-referenced in the UTM System “European Datum 1950 F33N”.
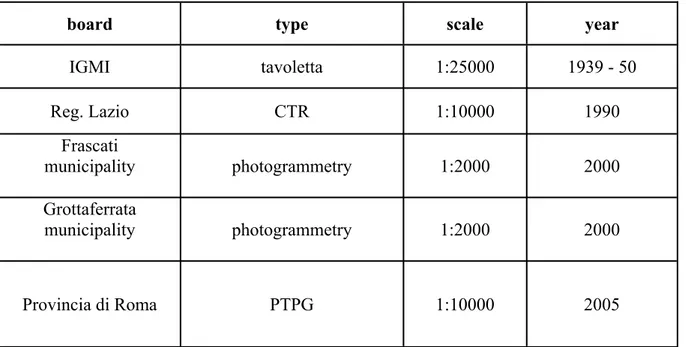
The following maps were are also used:
board type scale year
IGMI tavoletta 1:25000 1939 - 50 Reg. Lazio CTR 1:10000 1990 Frascati municipality photogrammetry 1:2000 2000 Grottaferrata municipality photogrammetry 1:2000 2000 Provincia di Roma PTPG 1:10000 2005
4.2.2_Satellite data
The satellite data were used and interpreted with visual interpretation method to delineate the boundary between the urban environment and the surrounding rural land. Weber [36] showed that it is important to develop a precise and clear definition of urban land use and land cover categories when delineating urban and rural areas from remote sensing. This work has been developed utilizing the technical resources of the European Space Agency (ESA) at ESRIN Laboratories, situated in Frascati (Italy), in collaboration with the DISP “GEOINFORMATION” of the Tor Vergata University in Rome.
The Geographic Information System (GIS) uses dedicated software for image processing and GIS (“Erdas Image 9.1”, “Envi 4.4”, “MapInfo 7”, “ArcInfo 9.3”), which are available on a server network system. In addition, GPS (GARMIN-GPSmap 60csx) were also used and a digital (HP Photosmart) camera to have more detailed pictures and data on the field. Satellite images give a synoptic view of the area and they provide useful information on environmental planning throughout the DOC area, with a detail that ranges from a few meters up to 50 cm. Many satellite images have been integrated into the Information System, but only three types of sensors have provided data for this study: Ikonos, QuickBird, Kompsat2 .
In order to integrate the various data of optical sensors, the images must all be registered with the same coordinates and datum: UTM International 1909, ED 1950, F33N.
Sensor Date Coverage Resolution Bands
IRS1C-pan 02.03.1998 complete 5 m Pan
Ikonos 2 23.06.2000 Not complete 1 m Pan Landsat7-ETM
190/31 06.09.2001 complete 30-15 m Pan + Ms QuickBird basic 05.03.2002 Complete 0.64 m – 2.4 m Pan + Ms Spot 5 21.07.2002 Complete 5 m Pan + Ms
SarDEM 2002 Complete 10 m - QuickBird standard 05.06.2004 complete mosaic 0.64 m – 2.4 m Pan + Ms QuickBird
standard 05.08.2005 Not complete 0.64 m – 2.4 m Pan + Ms ALOS -AVNIR 20.07.2007 complete 10 m Pan + Ms Kompsat 2 07.08.2008 complete 1m Pan + Ms
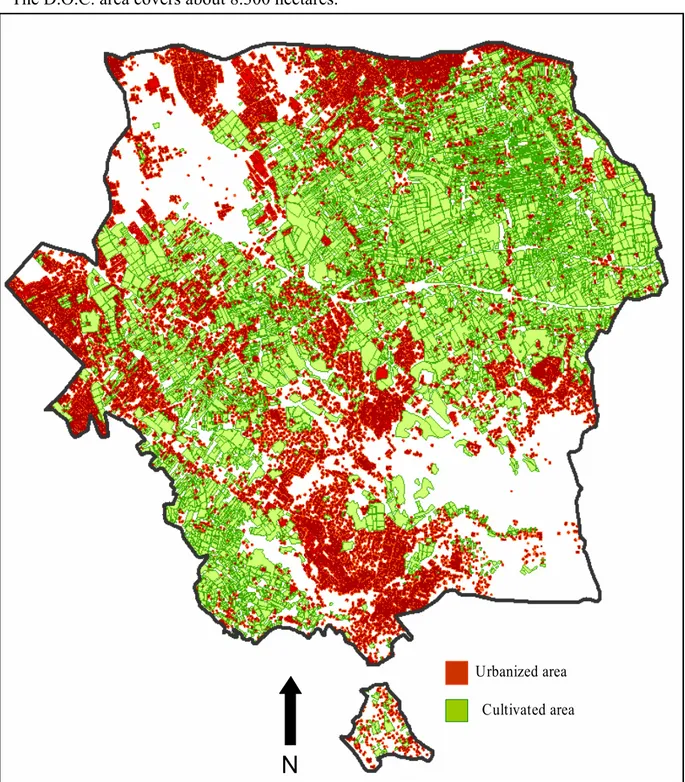
4.3_Application of the index to the entire Frascati DOC area.
The D.O.C. area covers about 8.300 hectares.
N
Urbanized area Cultivated areaN
N
Urbanized area Cultivated areaFIG. 4. Location of crops (green) and urban areas (red) within the DOC boundaries. In these boundaries 5 municipalities are included (2005).
classes Kmq cells density value %
Suedt (B15) Sc5 0.14 95 very high 0.17
25.864 Sc4 0.99 563 high 1.19 Sc3 4.38 2374 medium 5.27 Sc2 13.54 6905 low 16.31 Sc1 63.98 27114 very low 77.06 Sc0 0.15 718 nc 0.18 83.18 37769 100.17 cells correction 83.03 37051 31.09
classes Kmq cells density value %
Sucolt Sc5 0.49 301 very high 0.59
29.660 Sc4 3.51 2052 high 4.25
Sc3 19.04 9459 medium 23.04
Sc2 22.92 11600 low 27.73
Sc1 36.68 16214 very low 44.39
Sc0 0.54 965 nc 0.00
TAB.4. Application of the index: number of involved cells
API
density value Isurb_doc Iscolt_doc
very high 0.001 0.003 high 0.005 0.019 medium 0.020 0.086 low 0.058 0.105 very low 0.228 0.147 total 0.312 0.359
Through statistical GIS procedures, from the “GRID” files cells were counted on the crops and urban areas, and their values are shown in the table 5.
N
N
N
FIG.5. Index values for crops (shades of green) and urban areas (shades of orange).
Note that for the urban area, the "very low" class of cells Sc1, which is equal to 77% of the total, demonstrates the spread of the urbanization (Fig.6).
DOC area index analisys
0.000 0.050 0.100 0.150 0.200 0.250 very high high medium low very low Isurb_doc Iscolt_doc
4.3.1_Grottaferrata municipality
The municipality covers 1825,5 hectares
FIG.7 Location of crops and urban areas in the municipality of Grottaferrata (2005).
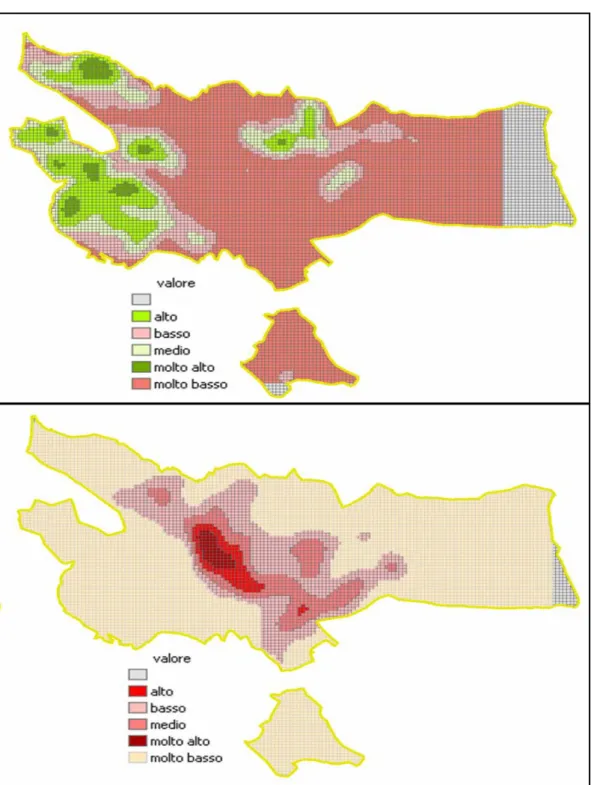
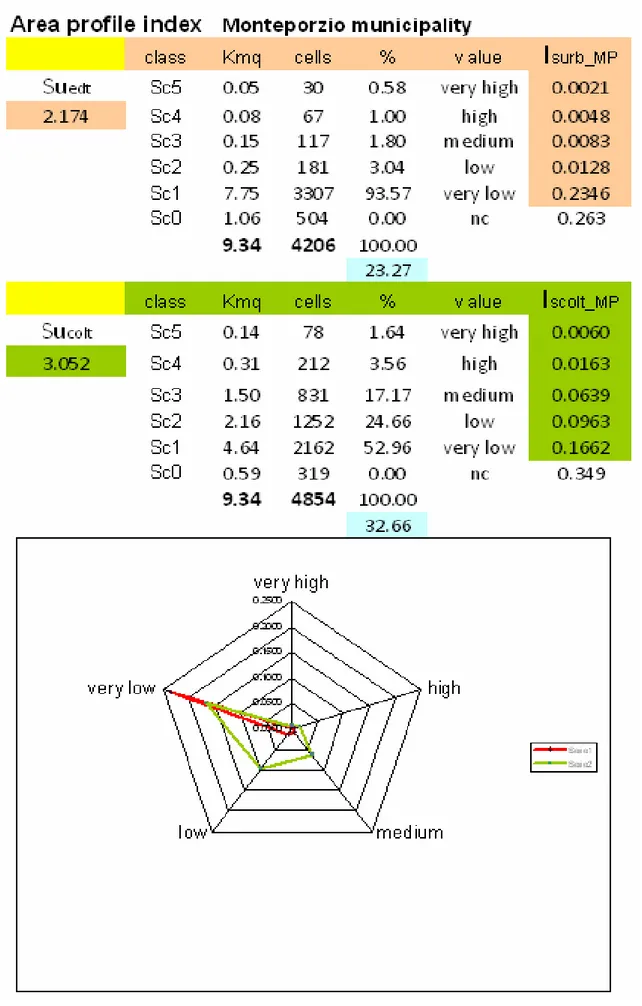
4.3.2_Monteporzio municipality
The municipality covers about 934,4 hectares.
FIG.10. Location of crops and urban areas (2005).
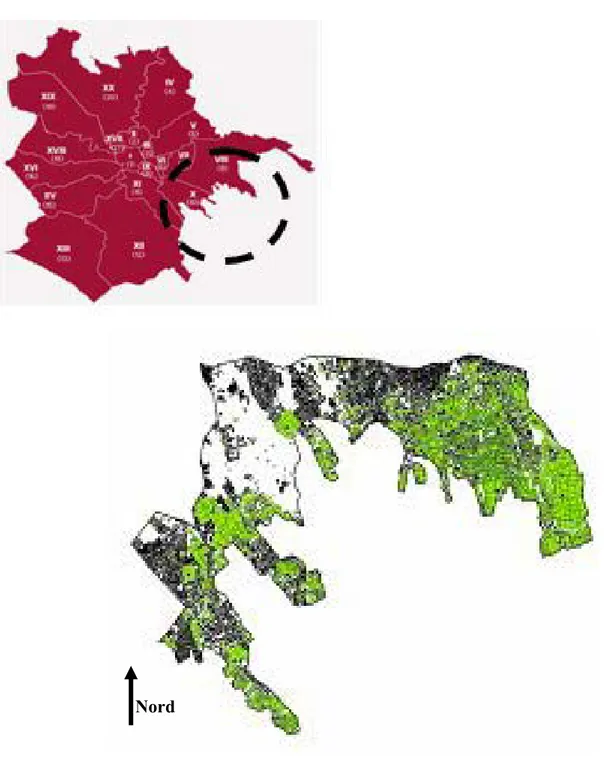
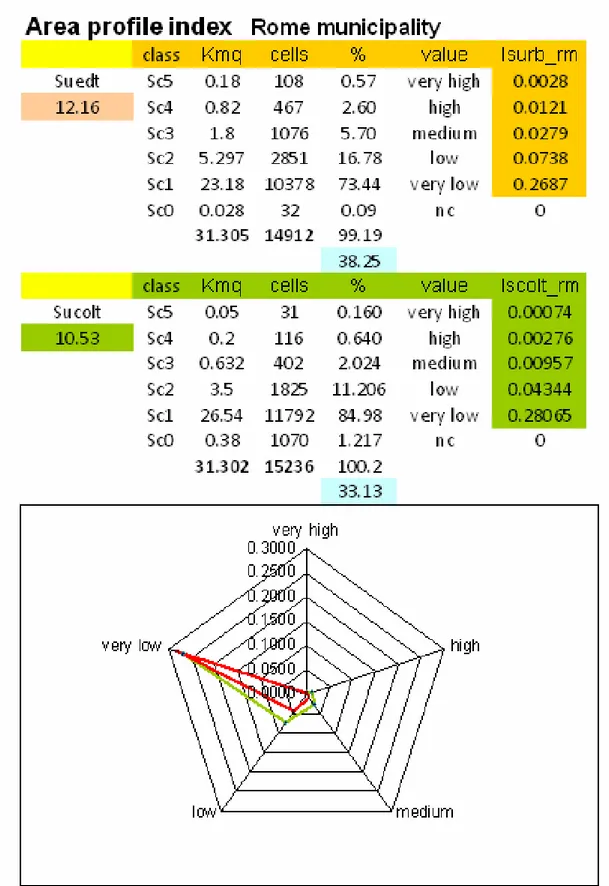
4.3.3_Rome municipality
The Rome DOC area covers at least 3 municipalities of Rome city: VIII , X, XI .
FIG. 13. Up: Rome and its municipalities. Down: location of crops and urban areas.
4.3.4_Montecompatri municipality
In this case, the DOC area extends to only 10% of the entire municipality, therefore an analysis is not significant.
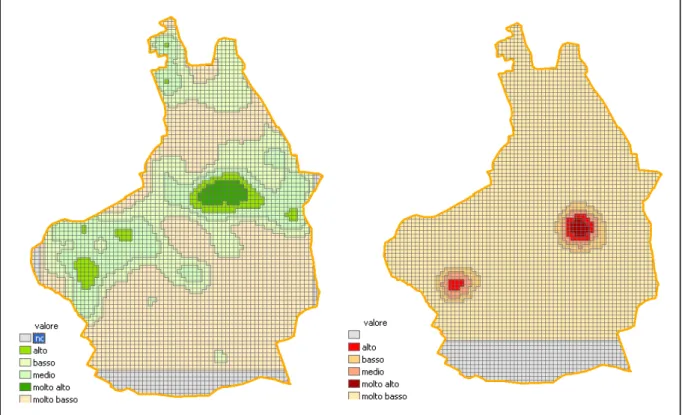
4.3.5_Frascati municipality
The municipality covers about 2259,7 hectares.
FIG. 16. Location of crops and urban areas in the Frascati boundaries (2005).
4.4_The forecasting model
As mentioned, for this municipality much additional information was found, particularly the municipal planning and the provincial planning (PRG/T5).
This data included in the list of attributes of the new file "Fragricoltura" has enabled the development of a predictive model of new urban areas at the expense of agricultural land. In this file, two new fields "tendcolt" and "tendurb” were added in the list of attributes and the values of both are derived from two other fields with antithetical weights: "Urbanval" and "Agrival”. Once introduced into the array, these two weights, related on the planning, intersect on the basis of the algorithms (7 - 8) to obtain scalar values for areas with a high level of risk of change.
The forecasting model is developed using the following formulas:
“Tendurb”= int((Kvali * APurb) + (urbanval – agrival)) (7) And
“Tendcolt” =int((Kvali * APcolt) + (agrival– urbanval)) (8)
Where the matrix fields:
Kval = Kernel density value (gridcode) APurb and APcolt = urban/agricultural index
Urbanval Agrival 1 5 2 4 3/2 2/3 4 2 5 1
TAB. 6 Values for the Urbanval and Agrival fields.
In the following pages, we show the flow chart (Fig. 20, 21, 22) to get the final file, the complete set of commands can be accessed in ”Geoprocessing History” (see annexes). As we can see, steps start with the shape files “colture05frascati” and “edifici_frascati2005” that describe crops and buildings. This first trial ended with the production of 2 vector files: “kdfrcoltgrid” and kdfrurbgrid”, with which it calculates its AP index. Later, the attributes of these two files were added to information on provincial and municipal plans: the file “fragricoltura” is thereby produced.
FIG. 19. Table fields attributes of the “fragricoltura” shape
Because of the urbanization and the consequent fragmentation of crops, there is an important loss of cultivated land. Our analysis focused on the progression of the trend towards urban "tendurb” (equation 7): data in the attributes table (fig. 23) and the coloured shape file predict chronological disappearance of crops in relation to the sprawling city. The resulting prediction on urban growth is a probabilistic map of urbanization at a future date at the expense of farmland. The final results of the model are a forecast of urban extent for the year 2005 and a projection for the future urban growth (2008).
5_VALIDATION
The use of spatial analysis with geostatistical methods rapidly increased in geographical sciences during recent years, especially for the opportunity to highlight and to estimate the values of a variable in the intervals between data points. The end result of this analysis is represented by a map, which shows the spatial distribution of the phenomenon by
calculating the values unknown by means of interpolation.
The interpolation grid is represented graphically by a contour map that shows the
configuration of the surface through curves of same value of the quantity studied [15]. Our first aim was to use the attribute fields from the “fragricoltura” shapefile for improving the anthropic-agricultural prediction trend by using them as a covariant variable data.
A method that can be used for this purpose is cokriging, an optimal method that has been utilized in numerous applications [7], because it is easy to use and has been shown
empirically to perform as well as other methods.
CoKriging is a variant of universal Kriging, a statistical tool developed by Matheron [27] and named in honour of D.G. Krige. The Kriging allows the interpolation of a magnitude in space by calculating a weighted average of known values. The assigned weights depend on the spatial relationship between the measured values in the neighbourhood of unknown point, obtained through analysis of “variogramma”.
The Cokriging allows improves the estimation of a variable undersampled through the combined use of another variable that is in correlation with the first [35].
“Cokriging is a moderately quick interpolator that can be exact or smoothed, depending
on the measurement error model. Cokriging uses multiple datasets and is very flexible, allowing you to investigate graphs of cross-correlation and auto correlation.
Cokriging uses statistical models that allow a variety of map outputs including predictions, prediction standard errors, probability, etc. The flexibility of Cokriging requires the most decision-making. Cokriging assumes that data come from a stationary stochastic process, and some methods assume normally-distributed data” (ArcInfo 9.2).
In our work, the better results on estimated data were obtained by using “tendcol” and “tendurb“ for the co-variant fields. This interpolation values shows in colours in the fig.24.
FIG. 24. Map of the spatial distribution of forecast change in land use, from agricultural to urban, obtained from the semivariogram. The scale represents the probability of change and the
FIG. 25. Analysis flow using “CoKriging method”, where “Tendcolt” and “Tendurb” are fields of co-variant dataset. At the centre of the figure are the 2 vector shapes used to
cut.
Output data set, from the above investigation, is in accordance with our analysis. Also, in this way the orange-red polygons of the agricultural parcels are those in disappearance danger.
Furthermore, to control the validity of tendency data, a VHR Kompsat2 image has been used. This image, taken on the 7th of August 2008, was geo-referenced, pan-sharpened and then inserted in the Informative System with a simple overlay process. With this image, the crops have been updated for 2008 and put in relation with the cultures of 2004.
2008
2002 - 2004
N
2008
2002 - 2004
2008
2002 - 2004
2008
2002 - 2004
N
FIG. 27. In red the missing particles for the Frascati municipality. where in green are the crops that remain in 2008.
A real good analogy between trend data foreseen in 2002/2004 (Bacchus) and the ones estimated in 2008 has been observed. As a matter of fact, in figure 26 and 27 we can notice that cultivated areas in the Frascati municipality were decreasing because of the urban sprawl in four years time.
FIG. 28. Particles of crops that have been urbanized from the 2002 (QuickBird) to the 2008 (Kompsat2).
From table 7, for the same municipality, it can be observed that sprawling problem had a major impact on olive-tree cultivations.
Years Vineyards ha Olive groves ha Total cultivation ha
2002/04 658,0 421,4 1079.4
2008 650.57 371.42 1021.99
Δ negative 7,43 49,98 57,41
N
2008 2002 - 2004N
2008 2002 - 2004FIG. 29. The DOC area. Green: the vineyards present in 2008; Red: the (missing) vineyards present in the 2002.
Years Vineyards ha Olive groves ha Total cultivation ha
2002/04 1943,33 991,51 2934,84
2008 1909,55 914,61 2824,16
Δ negative 33,82 76,90 110,68
TAB. 8 Loss of farmland between 2004 and 2008 for the entire DOC area.
Table 8 and figures 28-29 illustrate the decrease of crops throughout the area DOC. In all cases, the biggest impact comes at the expense of the cultivation of olive trees.
6_DISCUSSION AND CONCLUSION.
The results obtained in this work confirm that the approach using GIS is the most effective way to perform data processing to produce credible simulations of the evolution of a territorial system that is subject to human pressure.
Certainly, the application of the AP index (6) by using only two variables of data
(agricultural/urban) has represented a simplification of the many phenomena that affect the DOC area; this simplification, however, allows a reading of the changes and especially their efficient prediction when the set of the information is complete.
Moreover, to better define the extent of the urban texture we calculated a buffer of only 15 meters ( B15) for the buildings, compared to higher values, up to 50 meters, that have used the urban sprawl index in scientific works [24].
For a better visualization of the situation found in the territory studied, the graphs derived from the application of the AP index for each town, such as Frascati, Grottaferrata, Monteporzio and Rome, are here reported, compared and discussed.
The residential density is the most widely recognized indicator of sprawl with a level that is characterized by low densities of urbanization and scattered and discontinuous “leapfrog” expansion [12]. This low level is the common factor for all four municipalities that have been analysed, as we can see from Table 17.
Municipalities Isurb 1_DOC area 0.228 2_Roma(DOC) 0.269 3_Grottaferrata 0.205 4_Frascati 0.242 5_Monteporzio 0.234
This is even more evident by comparing the "very low" peak in the 5 graphs of Commons and DOC area. This indicates that for all the municipalities concerned the dispersion of the buildings is very high. So, taking into account the proximity to the urban area polarizing most of the great development of road network, it can be stated that this is a good clue to analyze the phenomenon of the urban sprawl.
FIG. 31. The graphic of urban Ap index very low (ref. table ).
However, in some cases the agricultural component (green polygon) is still resisting: if we make a comparison between the 4 towns, we can say that for the Grottaferrata and Rome (DOC) municipalities the crops are overcome by urbanization, whilst for the Frascati and MontePorzio municipalities common agricultural practices are still present (fig. 32).
The applied model has allowed the synthesis of the environmental situation of
municipalities of a region, with the viewing and quantifying of factors that may affect the phenomenon of the consumption of land. This type of analysis could be used by local authorities to perform simulations or estimates of environmental impact, thus becoming an important tool for planning. The model is comparative: the indicators are transformed into a scale of 1 to 5 specially designed for the analyzed area.
In other cases and with an increased number of components, the scale and the subjective weights to be applied to the index may vary.
An interesting application could be the calculation of “AP index” on the components of a land use based on CORINE Land Cover with the legend as proposed in 2006 (level III). In this case, it would be not 2 components only, but a larger number of indicators necessary to make a more accurate estimation of a dynamic phenomenon like that of urban sprawl. For this future work, we would need a very accurate map of land use and with a table of attributes especially designed for these applications. So, we are starting to work on this project using an orthophoto of the year 2008, with a resolution of 50 cm, for the update of the GIS.
Gr ot taf er r at a i ndex anal i sys 0.000 0.050 0.100 0.150 0.200 0.250 ver y hi gh hi gh medi um l ow ver y l ow Isur b_G Iscol t_G Monteporzio indexanalisys 0.0000 0.0500 0.1000 0.1500 0.2000 0.2500 very high high medium low very low Isurb_MP Iscolt_MP
Roma_DOC index analisys
0.000 0.050 0.100 0.150 0.200 0.250 0.300 very high high medium low very low Isurb_rm Iscolt_rm
Fr ascat i i ndex anal i sys
0.000 0.050 0.100 0.150 0.200 0.250 ver y hi gh hi gh medi um l ow ver y l ow Isur b_F Iscol t_F
7_Comment on the current situation
If we evaluate the effect of the recent plans (PRG) drawn up by the town of Frascati, Grottaferrata and Rome, we can easily observe that the phenomenon of urban sprawl is, at the moment, unstoppable.
In the Castelli Romani area this action is greatly favoured by the poor economical value associated with local agriculture sector, although it involves a larger number of
involved people. The very fragmented parcels that form the Frascati region is definitely one structural issue to be considered for explain the urban sprawl in the area.
Systematically, in the last 30 years we have lost about 1% of the surface per year. In the very last years an additional problem has started due to the very low price paid to the grape producers. In fact in the last 3 years this revenue does not cover the cost of production and many producers (especially the small one) are abandoning the agriculture activity. In particular in the last 2-3 years more than 10% of the Frascati DOC surface has been abandoned, with great environmental effects.
Political support actions are required at all level for containing such dramatic fenomenon.
Bibliography
1. Batty M., 1976, “Urban Modelling”- casa.ucl.ac.uk
2. Batty M., Jiang B., 1999 - Multi-agent simulation: new approaches to exploring space time dynamics in GIS - eprints.ucl.ac.uk
3. Bettini V. 1996 “Elementi di ecologia urbana” Einaudi Torino
4. Biondi M., Corridore G., Romano B., Tamburini P., Tetè P., 2003-Evaluation and planning control of the ecosystem fragmentation due to urban development - ERSA Congress, August, Jyvaskyla, Finland.
5. Bresso M., Russo R. , Zeppetella A. 1990 “ Analisi dei progetti e valutazione di impatto am bientale” Franco Angeli Milano.
6. Brueckner J.K 2001 Brookings-Warton papers on urban affairs :2001.
7. Cocco, A., Cossu, Q.A., Erre, P., Luciano, P., 2006. "Applicazioni geostatistiche e di tecnolo gie GIS per l’analisi delle fluttuazioni spaziali di Lymantria dispar. (Lepidoptera Lymantriida e)". 9° Convegno nazionale di agrometeorologia. AIAM 2006. Torino, 6–8 giugno 2006. 8. Colpizzi F. - 2000 “Chianti e Frascati a difesa delle proprie radici”, Agricoltura nuova n°5. 9. Del Frate F. , Duca R., Solimini D., 2007. "The potential of hyperspectral and multi-angle
CHRIS/Proba images in vegetation identi_cation and monitoring", Envisat Symposium, Montreux (Switzerland), April 23-27, 2007.
10. Duca R., Del Frate F., 2006 "Hyperspectral CHRIS Proba imagery over the area of Frascati and Tor Vergata: rerecent advances on radiometric correction and atmospheric calibration", 4th CHRIS Proba Workshop ESA ESRIN Frascati (Italy), 19 September 2006
11. http://www.espon.eu/export/sites/default/Documents/Programme/ESPON2006Programme/ Annual Reports/espon_2006_final_implementation_report_29.06.2009.pdf
12. Frenkel Amnon , Ashkenazi Maya 2005 _ Measuring Urban Sprawl; How Can We Deal With It? ERSA 2005. 45th Congress of the European Regional Science Association "Land Use and
Water Management in a Sustainable Network Society" Vrije Universiteit Amsterdam 23-27
August 2005
13. Fusco L., Loret E.,Minchella A., Antunes J. 2004 “ Il Progetto BACCHUS, una applicazione di tecniche avanzate per il rilevamento e la gestione di superfici vitate”ASITA Roma. 14. Geddes P. (1915), Città in evoluzione, (ediz. ital., 1970) Milano, Il saggiatore. 15. Golden Software, 2002 Surfer 8 userr’s guide. Golden Software Inc. , Golden USA. 16. Herold M., Goldstein N.C., Clarke K.C. 2003 - Remote Sensing of Environment, -
jena.de
17. Ioannilli M., Ambrosanio M. 2006, “Significato ed utilizzabilita’ delle misure sullo stato dell’ ambiente: l’esigenza di un nuovo approccio multidisciplinare – 16th Meeting of the Italian Society of Ecology . Viterbo-Civitavecchia 19-22 settembre 2006.
18. Irwin, E. G., & Geoghegan, J. (2001). Theory, data, methods: Developing spatially explicit economic models of land use change. Agriculture, Ecosystems and Environment, 85, 7– 23. 19. ISTAT, 1992, Compendio Statistico Italiano, Roma.
20. La Rovere M., Battisti C., Romano B., 2006, Integrazione dei parametri eco-biogeografici ne-gli strumenti di pianificazione territoriale, Atti XXVII Conferenza Italiana di Scienze Regiona-li, Pisa 12-14 ottobre 2006, AISRE.
21. Longley, P. A., & Mesev, V. (2000). On the measurement and generalization of urban form. Environment and Planning A, 32, 473– 488.
22. Loret E., Cadoni F., Canali G., Lichtenegger J., Fusco L. 1997” Costruzione di un sistema in-formativo geografico per l'area del vino DOC Frascati” ASITA Parma.
23. Loret E., Fusco L., Pecci A., Pesolillo S. Comandini F. 2007 “Approccio alla zonazione vitivi-nicola nell'area del Frascati DOC attraverso tecniche di Remote Sensing e GIS” in: “Modelli per la difesa delle piante” a cura di Severini M. e Pesolillo S., ARACNE Editrice ISBN 978-88-548-2586-4.
24. Malcevschi S., Poli G. 2008 (INDICATORI PER IL PAESAGGIO IN ITALIA – RACCOLTA DI ESPERIENZE – gennaio 2008, CATAP ).
25. Mandelbrot, B. B. (1983). The fractal geometry of nature. New York, NY:Freeman Wegener, M. (1994). Operational urban models: State of the art. Journal of the American Planning Association, 60(1), 17– 30.
26. Martini A., 1883 “Manuale di metrologia” Loescher Torino . Ed. digitale a cura di Guido Mu-ra, Milano – Biblioteca Nazionale Braidense 2003.
27. Matheron, G. 1963 – Principles of Geostatistics- Economic Geol. 58 :1246-1266.
28. Minchella A. (2004) “Orthorectification of QuickBird imagery using an external InSAR DEM
for integration in a Geographical Information System (GIS)”, IEEE Gold remote Sensing
Conference
29. http://www.nwgis.com/gisdefn.htm
30. Romano B. 2004_ Environmental fragmentation tendency: the sprawl index ERSA Aug. 2004, Porto, Portugal
31. Reid Ewing, Rolf Pendall, Don Chen, MEASURING SPRAWL AND ITS IMPACT _ Smart Growth America Washington, D.C.
32. Savitch H., 2000 - “Dreams and Realities: Coping with Urban Sprawl”, 19 Virginia Environmental Law Journal pp. 333, 342
33. Tamburini G. , Properzi P., Romano B., Di Ludovico D. 2000 THE “NATURAL” TOWN . METHODOLOGY HYPOTHESIS FOR DEFRAGMENTATION OF THE URBAN ORGANISM Proceedings World Conference The Human being and the City, Università di Napoli Federico II, Napoli 6-8.9.2000
34. Tempesta G.,Fiorilo M.,Ciolfi G.,Agresta M., Casadei G., 2007 “Analisi del sistema vitivinicolo Laziale: passato, presente, tendenza.” Rivista di Viticoltura ed Enologia n.60
35. Wackernagel, H., 2001. Multivariate geostatistics. In: El-Shaarawi A., Piegorsch W. (eds) En-cyclopedia of Environmetrics, vol. 3, 1344-1347, Wiley, Chichester.
36. Weber, C. (2001). Remote sensing data used for urban agglomeration delimitation. - In J. P. Donnay, M. J. Barnsley, & P. A. Longley (Eds.), Remote sensing and urban analysis ( pp. 155– 167). London: Taylor and Francis
37. Wegener, M. (1994). Operational urban models: State of the art. Journal of the American Planning Association, 60(1), 17– 30.
38. WorldResources Institute (WRI) 1995 – Environmental indicators: A systematic approach to measuring and reporting on environmental policy performance in the context of sustainable development, Brussel
List of Acronymous
CLC: Corine Land Cover CTR: Carta Tecnica Regionale DTM: Digital Terrain Model
D.O.C.: Denominazione di origine controllata
EOP-SA: Earth Observation Programme Science Application ESA: European Space Agency
ESRIN: European Institute of Space Research GIS: Geographic Information System GRA: Grande Raccordo Anulare
IGMI: Istituto Geografico Militare Italiano ISTAT: Istituto Nazionale di Statistica PRG: Piano Regolatore Generale
PTPG: Piano Territoriale Paesistico Generale UTM: Universal Transverse Mercator VHR: Very High Resolution
8 _ Acknowledgements
First of all, I would like to thank my tutor Prof. Maria Ioannilli for her thoughtful guidance during this thesis. She provided me with many helpful suggestions, important advice and patience during the course of this work.
I thank Dr. Luigi Fusco for initiating this line of research and for his help and his precious advices.
I thank Prof. Maurizio Fea for help and the precious advice and for having supervised the overhaul of the present work.
I thank Dr. Juerg Lichtenegger for having supervised the first step of the present work and i thank him for teaching me the basics of remote sensing and the Geographic Information Systems.
I am also very grateful to Dr. Francesco Sarti for the hospitality and helpful collaboration with his research group of EOP-SA, by ESA / ESRIN (Frascati).
Annexes
Roma 1 2 3 4 5 6 7 8 9 10 11 12 13 15 16 17 18 19 20 1) Albano Laziale 2) Ariccia 3) Artena 4 Castel Gandolfo 5) Ciampino 6) Colonna 7) Frascati 8) Genzano 9) Grottaferrata 10) Lanuvio 11) Lariano 12) Marino 13) MonteCompatri 14) MontePorzio 15) Nemi 16) Palestrina 17) Rocca di Papa 18) Rocca Priora 19) S. Cesareo 20) Velletri DOC Area Annexes 1The Frascati D.O.C. vineyards area and the municipality inside.
Annexes 2_ SPOT 5_07.2002 and 20 classes classification
Municipality Area ha. Coltures ha. % Buildings ha. % Grottaferrata 1825,5 342,8 18,78 425,38 23,30 MontePorzio 934,4 305,2 32,66 217,4 23,27 Roma (DOC) 3178,8 1078 33,91 1216 38,25 Frascati 2259,7 1021,9 45,22 683,7 30,26 Total DOC 8198 2748 33,52 2542 31,01
Annexes 3_ coltures and the urban areas updated to august 2008 (from Kompsat2 satellite image).
METADATA
Title: fragricoltura.shp
Presentation format: digital map; Data format: Shapefile
Dataset language: English ; Spatial representation type: vector
Resource's bounding rectangle:
Extent type: Full extent in decimal degrees
*West longitude: 12.625908
*East longitude: 12.707147
*North latitude: 41.854569
*South latitude: 41.79645
Coordinate system: ED_1950_UTM_Zone_33N
*Extent contains the resource: Yes
*West longitude: 302916.102694
*East longitude: 309497.720652
*North latitude: 4636257.64569
*South latitude: 4629978.250859
*Level of topology for this dataset: geometry only
Geometric objects: *Name: fragricoltura
*Object type: complexes
Geoprocessing History
:Process:
*Date: 20090217
*Time: 132821
*Tool location: C:\Program
Files\ArcGIS\ArcToolbox\Toolboxes\ConversionTools.tbx\RasterToPolygo n
*Command issued: RasterToPolygon kdfrcolt5 "C:\dottorato06
\gis_TV\indici frascati\analisiagricola\kdfrcolt.shp" NO_SIMPLIFY VALUE
Process:
*Date: 20090217
*Time: 133045
*Tool location: C:\Program
Files\ArcGIS\ArcToolbox\Toolboxes\Analysis Tools.tbx\Clip
*Command issued: Clip kdfrcolt Frascati_bound_region
"C:\dottorato06\gis_TV\indici frascati\analisi agricola\kdcoltfr.shp" #
Process:
*Date: 20090217
*Time: 134049
*Tool location: C:\Program
Files\ArcGIS\ArcToolbox\Toolboxes\Analysis Tools.tbx\Union
*Command issued: Union "kdcoltfr #;frascatigrid50 #"
"C:\dottorato06\gis_TV\indici frascati\analisi agricola\kdfrcoltgrid.shp" ALL # GAPS
Process:
*Date: 20090217
*Time: 140824
*Tool location: C:\Program
Files\ArcGIS\ArcToolbox\Toolboxes\Analysis Tools.tbx\SpatialJoin
*Command issued: SpatialJoin kdfrcoltgrid kdfrurbgrid
"C:\dottorato06\gis_TV\indici frascati\franalisitendenze\fr_urb_colt.shp" JOIN_ONE_TO_ONE KEEP_ALL "ID 'ID' true true false 10 Double 0 10