RESEARCH ARTICLE
Comparative performance evaluation of
Wako
β-glucan test and Fungitell assay for the
diagnosis of invasive fungal diseases
Elena De Carolis1, Federica Marchionni1, Riccardo Torelli1, Morandotti Grazia Angela1, Livio Pagano2, Rita Murri1, Gennaro De Pascale3, Giulia De Angelis1,4,
Maurizio SanguinettiID1,4*, Brunella Posteraro4,5
1 Dipartimento di Scienze di Laboratorio e Infettivologiche, Fondazione Policlinico Universitario A. Gemelli
IRCCS, Rome, Italy, 2 Dipartimento di Diagnostica per Immagini, Radioterapia, Oncologia ed Ematologia, Fondazione Policlinico Universitario A. Gemelli IRCCS, Rome, Italy, 3 Dipartimento di Scienze
dell’Emergenza, Anestesiologiche e della Rianimazione, Fondazione Policlinico Universitario A. Gemelli IRCCS, Rome, Italy, 4 Dipartimento di Scienze Biotecnologiche di Base, Cliniche Intensivologiche e Perioperatorie, UniversitàCattolica del Sacro Cuore, Rome, Italy, 5 Dipartimento di Scienze
Gastroenterologiche, Endocrino-Metaboliche e Nefro-Urologiche, Fondazione Policlinico Universitario A. Gemelli IRCCS, Rome, Italy
Abstract
The Fungitell assay (FA) and the Wakoβ-glucan test (GT) are employed to measure the serum/plasma 1,3-β-D-glucan (BDG), a well-known invasive fungal disease biomarker. Data to convincingly and/or sufficiently support the GT as a valuable alternative to the FA are yet limited. In this study, we evaluated the FA and the GT to diagnose invasive aspergil-losis (IA), invasive candidiasis (IC), and Pneumocystis jirovecii pneumonia (PJP). The FA and GT performances were compared in sera of patients with IA (n = 40), IC (n = 78), and PJP (n = 17) with respect to sera of control patients (n = 187). Using the manufacturer’s cut-off values of 80 pg/mL and 11 pg/mL, the sensitivity and specificity for IA diagnosis were 92.5% and 99.5% for the FA and 60.0% and 99.5% for the GT, respectively; for IC diagnosis were 100.0% and 97.3% for the FA and 91.0% and 99.5% for the GT, respectively; for PJP diagnosis were 100.0% and 97.3% for the FA and 88.2% and 99.5% for the GT, respec-tively. When an optimized cutoff value of 7.0 pg/mL for the GT was used, the sensitivity and specificity were 80.0% and 97.3% for IA diagnosis, 98.7% and 97.3% for IC diagnosis, and 94.1% and 97.3% for PJP diagnosis, respectively. At the 7.0-pg/mL GT cutoff, the agree-ment between the assays remained and/or became excellent for IA (95.1%), IC (97.3%), and PJP (96.5%), respectively. In conclusion, we show that the GT performed as well as the FA only with a lowered cutoff value for positivity. Further studies are expected to establish the equivalence of the two BDG assays.
Introduction
Invasive aspergillosis (IA), invasive candidiasis (IC), andPneumocystis pneumonia (PJP,
previ-ously known as PCP) represent the most prevalent invasive fungal diseases (IFDs) worldwide
a1111111111 a1111111111 a1111111111 a1111111111 a1111111111 OPEN ACCESS
Citation: De Carolis E, Marchionni F, Torelli R,
Angela MG, Pagano L, Murri R, et al. (2020) Comparative performance evaluation of Wako β-glucan test and Fungitell assay for the diagnosis of invasive fungal diseases. PLoS ONE 15(7): e0236095.https://doi.org/10.1371/journal. pone.0236095
Editor: Jeffrey Chalmers, The Ohio State University,
UNITED STATES
Received: December 1, 2019 Accepted: June 30, 2020 Published: July 29, 2020
Peer Review History: PLOS recognizes the
benefits of transparency in the peer review process; therefore, we enable the publication of all of the content of peer review and author responses alongside final, published articles. The editorial history of this article is available here:
https://doi.org/10.1371/journal.pone.0236095 Copyright:© 2020 De Carolis et al. This is an open access article distributed under the terms of the
Creative Commons Attribution License, which permits unrestricted use, distribution, and reproduction in any medium, provided the original author and source are credited.
Data Availability Statement: All relevant data are
within the manuscript and its Supporting Information files.
[1]. These diseases mainly affect immunocompromised (or immunosuppressed) hosts, causing estimated over 1.6 million deaths annually [2]. Causative agents of IC include different Can-dida species [3], whereas the main cause of IA remainsAspergillus fumigatus [4] and PJP is uniquely caused byPneumocystis jirovecii, formerly Pneumocystis carinii [5]. As IFD symp-toms can be subtle and/or nonspecific, it is difficult to identify and treat the cause of disease, especially in patients with hematological malignancies [6]. Furthermore, microbiological con-firmation of IFD with conventional, culture-dependent methods may yield false-negative results [7], hence, molecular, culture-independent methods to enhance the diagnostic sensitiv-ity need to be developed [8]. Thus, pending the microbiological diagnosis, an empirical treat-ment targeting infectious and non-infectious causes may be necessary [6].
As broad fungal biomarker for IFD (the only notable exception are mucormycosis, crypto-coccosis, and blastomycosis) [9–12], serum 1,3-β-D-glucan (BDG) has shown wide utility in
specific clinical settings [13], including IA, IC, and PJP [14]. In a meta-analysis, Heet al.
focused on the accuracy of cutoff values to diagnose IFD obtained with BDG detection assays [15]. One was the Fungitell assay (FA; Associates of Cape Cod, East Falmouth, MA), FDA cleared and Conformite´ Europe´enne (CE) marked, which has been most used in the Western Hemisphere (Europe and United States), and another was the Wakoβ-glucan test (GT; FUJI-FILM Wako Pure Chemical Corporation, Osaka, Japan), CE marked, which has recently been introduced in Europe.
Both assays rely on the BDG ability to activate factor G, a serine protease zymogen, in the
Limulus (horseshoe crab) coagulation cascade. Activated factor G converts the inactive
pro-clotting enzyme to the active form, which in turn cleaves an artificial substrate used for colori-metric (FA) or turbidicolori-metric (GT) detection. Although BDG concentrations are measured through spectrophotometric readings, dissimilarity of cutoff values between the assays may be related to differences in the standards and/or affinity/reactivity of reagents in each assay [16]. Using the proposed 80 pg/mL (FA) and 11 pg/mL (GT) cutoff values [15], a recent comparison of the two assays for PJP diagnosis showed GT to be more specific and FA to be more sensitive, at a statistically significant level [17]. Interestingly, the sensitivity of GT equaled that of FA (at a cutoff of �60 pg/mL) and the specificity was significantly better than that of the FA, when the GT cutoff value lowered from 11 pg/mL to 3.616 pg/mL [17]. Consistently, previous work showed sensitivities of the FA for both IC (i.e., candidemia) and PJP diagnoses to be superior to those of the GT [18]. Again, lowering the GT cutoff value to �3.8 pg/mL resulted in sensi-tivities of the GT that became acceptable for candidemia (with a decreasing specificity from 98.0% to 91.0%) and excellent for PJP, respectively [18]. However, while more data are required to support the GT as a valuable alternative to the FA (especially for patients with can-didemia), not enough data exist about the GT to diagnose IA.
Therefore, we compared the performance of the GT with that of the FA in well-character-ized groups of patients with IA, IC, and PJP, with reference to appropriate control patients. Similar to previous studies [17,18], we also tried to define the optimal GT cutoff values which could allow to reliably exclude IFD (mainly due toAspergillus, Candida, or P. jirovecii).
Materials & methods
Ethics statement
This study was conducted at the Fondazione Policlinico Universitario A. Gemelli (FPG) IRCCS of Rome, Italy, and was approved by the Ethics Committee of the FPG (application number 38367/19) and a waiver of informed consent was granted. Sample processing and data analysis were performed anonymously.
Funding: M.S. received funding from FUJIFILM
Wako Pure Chemical Corporation to perform this study. The funders had no role in study design, data collection and analysis, decision to publish, or preparation of the manuscript.
Competing interests: I declare that FUJIFILM
Wako Pure Chemical Corporation provided reagents and funding for this study. This does not alter our adherence to PLOS ONE policies on sharing data and materials. FUJIFILM Wako Pure Chemical Corporation had no role in study design, data collection and analysis, decision to publish, or preparation of the manuscript.
Study design
We conducted a retrospective performance assessment study on archived patients’ serum sam-ples, which had been collected as part of routine clinical care at the FPG IRCCS, a large tertiary care hospital in Rome, Italy. We used serum instead of plasma samples because of our previous findings showing that the two sample types may be considered equivalent [19]. Samples were from adult patients (mainly oncology/hematology patients) who were classified as having proven or probable IFD according to the 2008 European Organization for the Research and Treatment of Cancer/Mycoses Study Group (EORTC/MSG) criteria [20]. Samples were also from patients who were classified as having PJP if they had clinical signs and symptoms of respiratory infection (i.e., dyspnea, cough, or hypoxemia) supported with radiological findings (e.g., diffuse ground glass opacities on chest radiograph) and with positive
Pneumocystis-spe-cific PCR and/or immunofluorescence staining results of respiratory samples [21]. To enhance the robustness of the analysis, only patients with proven or probable IFDs were evaluated as IFD cases. Serum samples from patients who had major risk factors for IFD but who did not meet the criteria for proven or probable disease (i.e., who had no evidence of IFD) were included as controls. Furthermore, no diagnoses were based on detection of BDG (see below), which is part of the mycological criteria for the 2008 EORTC/MSG classification of patients with proven/probable/possible or no IFD [20]. At the time of writing this article—and shortly after completion the study, the EORTC/MSG education and research consortium updated def-initions of IFDs [22]. However, according to the 2019 EORTC/MSG criteria, no reclassifica-tion was required for either IA or IC, while PJP cases were all classifiable as proven IFD, in our study [22].
We initially considered all the patients with a first serum BDG sample collected for routine mycological testing eligible. Then, we included only the patients for whom a classification as proven or probable IA (or IC) according to the 2008 EORTC/MSG definitions was available. All patients’ samples were from the closest time (± 2 days) when evidence or no evidence of IFD was obtained for cases and controls, respectively, and were stored at –80˚C until the study time.
Serum BDG measurement
Before BDG testing, frozen serum samples were thawed at room temperature and briefly vor-texed. The same investigator tested each sample’s aliquots with the FA and the GT in parallel and in a blinded manner for each patient’s disease classification at the time of testing. The two assays were performed in accordance with the manufacturer’s instructions. In both assays, the BDG measurement relies on a modification of theLimulus amebocyte lysate (LAL), which
results in colorimetric (FA) or turbidimetric (GT) reaction changes. Briefly, for the FA 5μL of serum (in duplicate) was used and the LAL reaction was monitored at 37˚C for 40 min in an ELx808 microplate reader (BioTek Instruments, Winooski, VT). By comparing with a stan-dard curve, the mean optical density change over time was calculated to determine the sam-ple’s BDG concentration. A positivity threshold of 80 pg/mL was used throughout the study. For the GT, 100μL of serum was used and the LAL reaction (i.e., gelation) was monitored at 37˚C for a maximum of 90 min in a MT-6500 toxinometer (FUJIFILM Wako Pure Chemical Corporation). By comparing with a calibration curve (supplied with each lot by the manufac-turer), the gelation time was calculated to determine the sample’s BDG concentration. A posi-tivity threshold of 11 pg/mL was initially used in the study (see below for posiposi-tivity threshold optimization). Samples with positive results of > 500 pg/mL (FA) or > 600 pg/mL (GT) were diluted and retested.
Data collection and statistical analysis
Statistical analysis was performed using GraphPad Prism version 8.2 (GraphPad Software, La Jolla, CA) and MedCalc Statistical Software version 19.0.7 (MedCalc Software bvba, Belgium). Patients’ demographics and BDG data were expressed as percentages or medians with inter-quartile ranges (IQR), respectively. To determine sensitivity and specificity of BDG assays, together with their respective 95% confidence intervals (CIs), we constructed 2× 2 tables using IFD (IA, IC, or PJP) patients as true cases and non-IFD patients as controls. For both assays, receiver operating characteristic (ROC) curves were generated and cutoff values were derived to assess the diagnostic accuracy of serum BDG for case (IFD) versus control (non-IFD) patients. The highest Youden index indicated the optimal BDG cutoff. Variables were com-pared using chi-square test and Mann-Whitney U test, as appropriate, whereas differences in performance parameters between BDG assays were assessed using McNemar’s test. Agreement between BDG assays was determined by Spearman’s correlation, whereas the strength of agree-ment was determined by Cohen’s kappa statistic. Thus, values higher than 0.80 represented excellent agreement, values between 0.80 and 0.4 represented substantial to moderate agree-ment, and values lesser than 0.4 represented fair to slight agreement. Statistical significance was set at a < .05P-value.
Results
Study samples
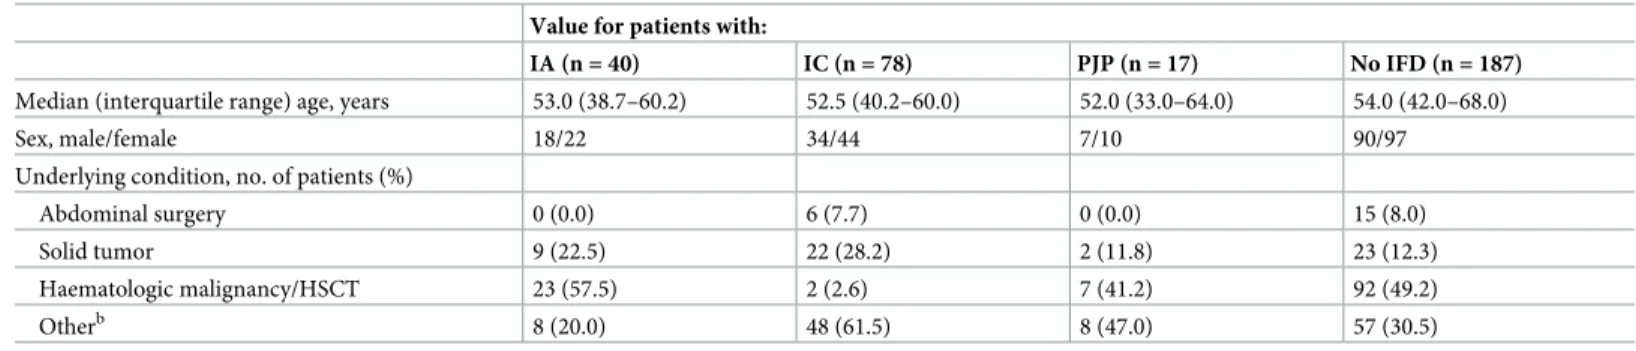
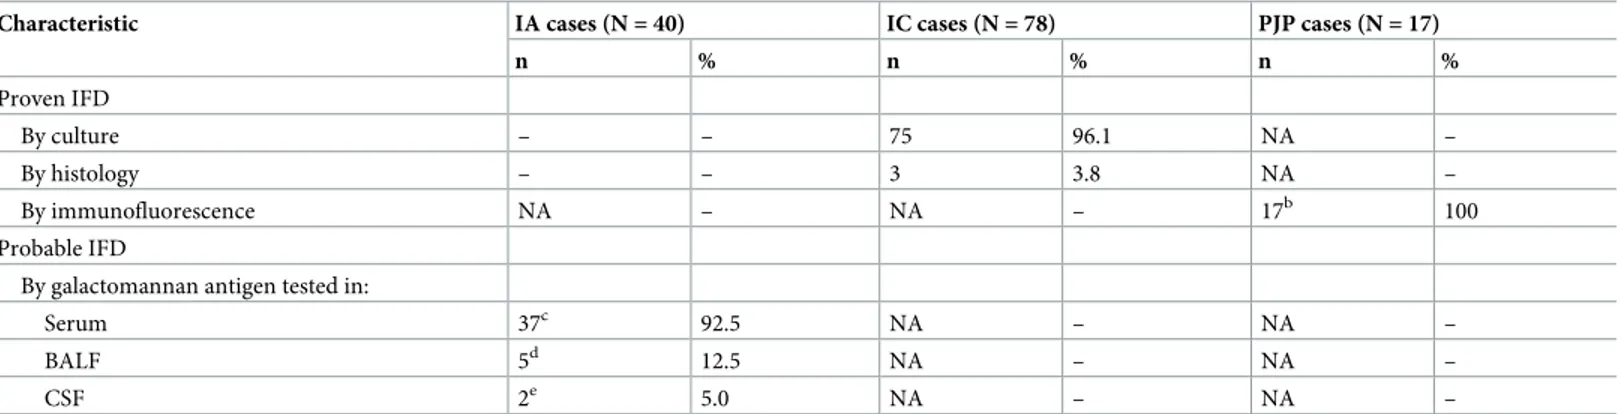
Table 1shows demographics for the 322 patients from whom 322 serum samples were tested with two BDG assays (FA and GT), of which 78 samples were from proven IC (75 candidemia and 3 intraabdominal candidiasis) cases, 40 samples from probable IA (38 pulmonary and 2 disseminated aspergillosis) cases, and 17 samples from PJP cases. For all 135 cases, fungal dis-ease classification (proven or probable) was obtained as previously described [20,21]. We also included 187 samples from 187 patients, for whom clinical, radiographic, and microbiological findings indicated no evidence of IFD (controls).Table 2shows details about the mycological evidence used to classify the 135 cases as IFD.
Performances of the FA and the GT
The FA (cutoff for positivity, �80 pg/mL) and the GT (cutoff for positivity, �11 pg/mL) gave positive results in 132 (97.8%) and 110 (81.5%) of 135 IFD samples, respectively. Of 187
Table 1. Characteristics of 322 patients from whom serum samples were tested for BDG measurementa. Value for patients with:
IA (n = 40) IC (n = 78) PJP (n = 17) No IFD (n = 187)
Median (interquartile range) age, years 53.0 (38.7–60.2) 52.5 (40.2–60.0) 52.0 (33.0–64.0) 54.0 (42.0–68.0)
Sex, male/female 18/22 34/44 7/10 90/97
Underlying condition, no. of patients (%)
Abdominal surgery 0 (0.0) 6 (7.7) 0 (0.0) 15 (8.0)
Solid tumor 9 (22.5) 22 (28.2) 2 (11.8) 23 (12.3)
Haematologic malignancy/HSCT 23 (57.5) 2 (2.6) 7 (41.2) 92 (49.2)
Otherb 8 (20.0) 48 (61.5) 8 (47.0) 57 (30.5)
BDG, 1,3-β-D-glucan; IA, invasive aspergillosis; IC, invasive candidiasis; PJP, Pneumocystis jirovecii pneumonia; IFD, invasive fungal disease; HSCT, hematopoietic stem cell transplantation.
a
BDG testing was performed in parallel with the Fungitell assay (FA) and the Wakoβ-glucan test (GT). b
Includes patients in intensive care and infectious disease units.
control samples, 182 (97.3%) and 186 (99.5%) had negative results with the FA and the GT, respectively. The one patient with a false-positive result by the GT was highly positive by the FA. Overall, the median BDG concentration was 398 pg/mL with the FA and 31.63 pg/mL with the GT. In IA cases, the median (IQR) BDG concentrations were 201 (119–377) pg/mL and 14.07 (7.45–41.46) pg/mL for the FA and the GT, respectively. These levels were signifi-cantly higher than the levels in controls (0 (0–11) and 0 (0–0), respectively;P < .0001). Using
the aforementioned cutoff values, the percentages of sensitivity and specificity were 92.5 and 99.5 for the FA, and 60.0 and 99.5 for the GT, respectively (Table 3). The sensitivity of FA was significantly greater than the sensitivity of GT (92.5% versus 60.0%,P < .001).
In IC cases, the median (IQR) BDG concentrations were 516 (250–837) pg/mL and 45.57 (16.10–109.9) pg/mL for the FA and the GT, respectively. These levels were significantly higher than the levels in controls (P < .0001). Using the aforementioned cutoff values, the percentages
of sensitivity and specificity were 100.0 and 97.3 for the FA, and 91.0 and 99.5 for the GT, respectively (Table 3). The sensitivity of FA was significantly greater than the sensitivity of GT (100.0% versus 91.0%,P < .001).
In PJP cases, the median (IQR) BDG concentrations were 512 (404–639) pg/mL and 46.88 (26.43–166.3) pg/mL for the FA and the GT, respectively. These levels were significantly higher than the levels in controls (P < .0001). Using the aforementioned cutoff values, the percentages
of sensitivity and specificity were 100.0 and 97.3 for the FA, and 88.2 and 99.5 for the GT, respectively (Table 3). The sensitivity of FA was significantly greater than the sensitivity of GT (100.0% versus 88.2%,P = .01).
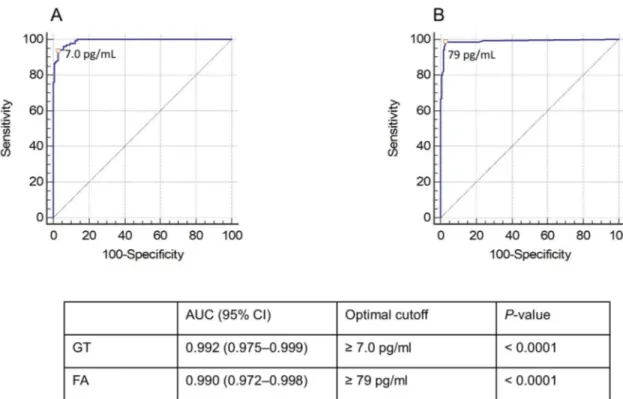
To improve the GT diagnostic performance, we determined the optimal positivity threshold for the GT (7.0 pg/mL) with the highest Youden index, which corresponds to the maximal sen-sitivity and specificity combination. As depicted inFig 1, ROC analysis for proven/probable IFD versus no IFD at the optimized cutoff value generated an area under the curve (AUC) of 0.992 (95% CI, 0.975–0.999). Using the 7.0-pg/mL cutoff, the percentages of sensitivity and
Table 2. Mycological characteristics of IFD casesa.
Characteristic IA cases (N = 40) IC cases (N = 78) PJP cases (N = 17)
n % n % n % Proven IFD By culture – – 75 96.1 NA – By histology – – 3 3.8 NA – By immunofluorescence NA – NA – 17b 100 Probable IFD
By galactomannan antigen tested in:
Serum 37c 92.5 NA – NA –
BALF 5d 12.5 NA – NA –
CSF 2e 5.0 NA – NA –
NA, Not applicable; BALF, bronchoalveolar lavage fluid; CSF, cerebrospinal fluid. aAll IFD cases were classified as described in the text.
b15 cases were also PJP-specific PCR positive.
cThe median (interquartile range) value of galactomannan index (optical density [OD] of sample/OD of cutoff control) was 1.6 (1.3–2.1). Indices of �0.5 were considered positive.
dTwo cases had positive galactomannan detection results also in serum samples. Indices were 0.8 (serum) and 1.5 (BALF) in one case and 0.9 (serum) and 2.2 (BALF) in the other case.
eTwo cases had positive galactomannan detection results also in CSF samples.
specificity for the diagnosis of proven/probable IFD were 80.0 and 97.3 for IA, 98.7 and 97.3 for IC, and 94.1 and 97.3 for PJP, respectively (Table 3). Only for IA, the sensitivity of FA remained significantly greater than the sensitivity of GT (92.5% versus 80.0%,P < .03).
Simi-larly, we performed a ROC analysis for the FA using an optimized cutoff of 79.0 pg/mL, and this resulted in an AUC of 0.990 (95% CI, 0.972–0.998). Additionally, we tried to define whether a different cutoff value would be required for IA compared to IC or PJP. The values for GT determined with the highest Youden index were 2.6 pg/mL for IA and 7.0 pg/mL for both IC and PJP, whereas those for FA were 79 pg/mL for IA, 105 pg/mL for IC, and 88 pg/mL for PJP.
Comparability of the FA and GT results
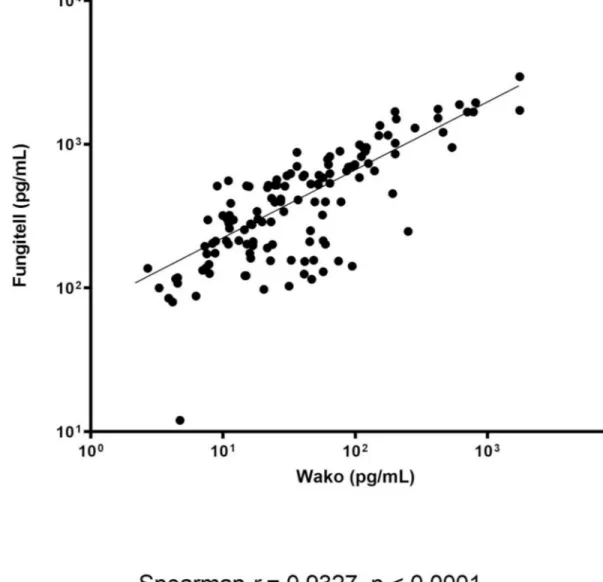
Assessing the quantitative agreement between the assays showed that a significant correlation between the BDG levels measured by the FA and the GT for IFD and non-IFD patient samples (Fig 2). In particular, these levels correlated significantly—although differently—for the IA (r = 0.670 and P < .0001; n = 40), IC (r = 0.703 and P < .0001; n = 78), and PJP (r = 0.667 and
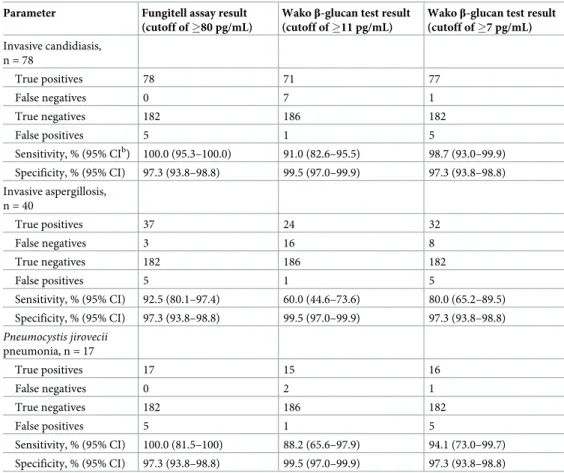
Table 3. Performance of the Fungitell assay and the Wakoβ-glucan test using indicated cutoffs to distinguish between IFD and non-IFD patientsa.
Parameter Fungitell assay result (cutoff of �80 pg/mL)
Wakoβ-glucan test result (cutoff of �11 pg/mL)
Wakoβ-glucan test result (cutoff of �7 pg/mL) Invasive candidiasis, n = 78 True positives 78 71 77 False negatives 0 7 1 True negatives 182 186 182 False positives 5 1 5 Sensitivity, % (95% CIb) 100.0 (95.3–100.0) 91.0 (82.6–95.5) 98.7 (93.0–99.9) Specificity, % (95% CI) 97.3 (93.8–98.8) 99.5 (97.0–99.9) 97.3 (93.8–98.8) Invasive aspergillosis, n = 40 True positives 37 24 32 False negatives 3 16 8 True negatives 182 186 182 False positives 5 1 5 Sensitivity, % (95% CI) 92.5 (80.1–97.4) 60.0 (44.6–73.6) 80.0 (65.2–89.5) Specificity, % (95% CI) 97.3 (93.8–98.8) 99.5 (97.0–99.9) 97.3 (93.8–98.8) Pneumocystis jirovecii pneumonia, n = 17 True positives 17 15 16 False negatives 0 2 1 True negatives 182 186 182 False positives 5 1 5 Sensitivity, % (95% CI) 100.0 (81.5–100) 88.2 (65.6–97.9) 94.1 (73.0–99.7) Specificity, % (95% CI) 97.3 (93.8–98.8) 99.5 (97.0–99.9) 97.3 (93.8–98.8) a
Serum samples from 135 patients with invasive fungal disease (IFD) and from 187 patients without evidence of IFD (non-IFD controls) were tested with the Fungitell assay (FA) and the Wakoβ-glucan test (GT). The manufacturers’ cutoff values (FA, �80 pg/mL, and GT, �11 pg/mL) and, only for the GT, the optimized cutoff value (�7 pg/mL) were used as sample’s positivity thresholds.
b
CI, confidence interval.
P = .004; n = 17) patient samples. Assessing the qualitative agreement between the assays
showed that an excellent (or substantial) concordance regarding the results (positive/negative) obtained with the FA (cutoff for positivity, �80 pg/mL) and GT (cutoff for positivity, �11 pg/ mL). This occurred with the samples from patients with IFD (91.8% agreement; Cohen’s kappa statistic, 0.82), IA (91.6% agreement; Cohen’s kappa statistic, 0.67), IC (95.0% agree-ment; Cohen’s kappa statistic, 0.88), and PJP (96.0% agreeagree-ment; Cohen’s kappa statistic, 0.76), respectively. Using the optimized GT cutoff value (�7.0 pg/mL), the concordance between the assays remained and/or became perfect for the samples from patients with IFD (95.6% agree-ment; Cohen’s kappa statistic, 0.91), IA (95.1% agreeagree-ment; Cohen’s kappa statistic, 0.83), IC (97.3% agreement; Cohen’s kappa statistic, 0.93), and PJP (96.5% agreement; Cohen’s kappa statistic, 0.81), respectively.
Discussion
To the best of our knowledge, two retrospective case-control studies have carefully evaluated the GT—the last approved BDG assay on the European market of s—in comparison with the FA in serum samples [17,18]. Using a similar study design, we compared the GT with the FA to diagnose IFD in 322 patients categorized into IC (n = 78), IA (n = 40), PJP (n = 17), and non-IFD (n = 187) groups. Indeed, we established the overall GT and FA performances in two patient groups (135 with IFD and 187 without IFD), as well as the specific GT and FA perfor-mances in the IA, IC, and PJP groups with respect to the non-IFD group. Importantly, to com-pare the GT with the FA results, we followed the strategy of testing all archived patient samples in parallel, which reduces the bias due to probability of BDG degradation during sample stor-age, as successfully shown [17]. In contrast, Friedrichet al. performed FA measurement at the
time of sampling and GT measurement on long-term stored samples [18].
Fig 1. Receiver operating characteristic (ROC) curves of the GT (A) and the FA (B). The optimized thresholds for positivity in both
assays (7.0 pg/mL and 79 pg/mL, respectively) are marked with a dot.
By applying the manufacturer’s recommended cutoffs for positivity, we showed that the sensitivity of the FA was higher than the sensitivity of the GT in IFD patients overall (97.8% versus 81.5%, respectively) and, in particular, IA (92.5% versus 60.0%, respectively), IC (100% versus 91.0%, respectively), or PJP (100% versus 88.2%, respectively) patients. While the PJP values in our study are very similar to those reported by Friedrichet al. in PJP patients
(sensi-tivity of FA and GT were 100% and 88.9%, respectively) [18], our IC values differ substantially from those reported by Friedrichet al. in candidemia patients (sensitivity of FA and GT were
86.7% and 42.5%, respectively) [18]. However, our findings are surprising, particularly if com-pared to the results of several meta-analyses published over recent years [9–11]. The pooled sensitivity and specificity of BDG for invasive fungal infections (excludingP. jirovecii
infec-tions) varied from 76.0% and 85.0% [10], 76.8% and 85.3% [9] to 80.0% and 82.0% [11], respectively. Conversely, in one meta-analysis [11], the pooled sensitivity and specificity for PJP were 96.0% and 84.0%, respectively.
Fig 2. Correlation between the BDG concentrations (pg/mL) determined by the FA and GT assays. https://doi.org/10.1371/journal.pone.0236095.g002
In agreement with the results by meta-analyses [9–11] but in marked contrast with those by Friedrichet al. [18], one study [23] showed a sensitivity of 67.0%—neighbor, albeit still distant, to ours—and a specificity of 93.0% for the GT in a similar-sized cohort of patients with candi-demia. Like in the Friedrichet al.’s study [18], applying a decreased cutoff of 7 pg/mL allowed Dichtlet al. to obtain a sensitivity of 73.0%, while specificities in both the studies remained as
high as 91.0% [18] and 93.0% [23]. Another study by Dichtlet al. [24] conducted in the setting of PJP, showed that the specificity of GT—using an 11-pg/mL cutoff—was 100% in 25 control individuals who tested negative forP. jirovecii DNA by quantitative real-time PCR from
respi-ratory samples. In the same study [24], the GT sensitivity increased from 86.0% to 91.0% after exclusion of the cases with slightly positive PCR results—that are usually negative in micros-copy. Thus, our data unravel unexpected features of both GT and FA, which seem to subvert the paradigms of specificity as a “FA weakness” and of sensitivity as a “GA weakness” [25].
The reasons for conflicting results among studies are unknown, but we cannot exclude the influence of factors as a possible explanation for the observed differences in BDG assays’ sensi-tivity and specificity. For example, findings from stratified (subgroup) analyses in two inde-pendent meta-analysis studies led to observe a lower EORTC/MSG diagnostic accuracy attributable to lower sensitivity compared to similar criteria (e.g., histopathological examina-tion and/or microbiological culture from blood or sterile material) [11,15]. In the present study, we used the 2008 EORTC/MSG criteria for both IA and IC [20], and 3 (1.3%) of 78 patients had an IC diagnosis based on histology only. Unlike us, Friedrichet al. [18] exclusively used mycological culture from blood as a reference standard. Although blood culture serves to document the proven presence of invasive fungal infection [20], three patients with false-posi-tive BDG results in the study by Friedrichet al. had negative blood cultures but were positive
for the mannan antigen [18], which is a highly specific serum biomarker for IC [26]. Further-more, fungal antigen levels in the blood are generally higher in culture-positive cases, so the inclusion of patients based on a blood culture positive may not allow a correct appraisal of the BDG performance [23]. In our study, the median (IQR) value of galactomannan OD index in 40 patients diagnosed with probable IA was 1.6 (1.3–2.1), giving a measure of moderately high fungal burdens in these patients. This could indicate later infection stages in these patients— that in turn could result in higher BDG values—unless the exposure to mold-active antifungal prophylaxis in many patients could have masked their actual galactomannan levels [8]. Ultimately, for all analyses, we used a mixed control group of patients with different (albeit partially overlapping) risk factors for IFD [8,27], which could skew the BDG diagnostic parameters. To exclude this possibility, we performed a rough analysis using control sub-groups. Interestingly, we found no one or slight differences in specificities when they were cal-culated with patients only at risk of IC (97.6% [FA] and 99.4% [GT]), IA (100% for both FA and GT), or PJP (99.1% [FA] and 100% [GT]) (data not shown).
Unlike IA, where the low sensitivity (60.0%) makes the GT not suitable for diagnosis using the manufacturer’s recommended cutoff value of 11 pg/mL, the sensitivities of the GT in IC (91.0%) and PJP (88.2%) were already good without lowering the cutoff value. However, the GT sensitivity in IA increased to 80.0% with a positivity threshold of 7.0 pg/mL and without compromising specificity (97.3%). Applying the 7.0-pg/mL cutoff value, the GT sensitivity also increased for both IC (from 91.0% to 98.7%) and PJP (from 88.2% to 94.1%), whereas at this cutoff the specificity for both IC and PJP slightly decreased (from 99.5% to 97.3%). Interest-ingly, the GT cutoff value proposed in this study was almost twice the value proposed else-where, such as 3.8 in candidemia [18] and 3.616 in PJP [17]. Of note, our value also encompasses IA, and this is not surprising because BDG testing for yeast or yeast-like fungi such asCandida species and P. jirovecii may require a cutoff value different from that required
BDG assay may be different depending on the pathogen and host [14]. Therefore, it should be mandatory to interpret BDG results in relation to not only the specific pathogen, but also the specific patient population [28].
Our comparison of two BDG assays showed that both quantitative correlation and qualita-tive agreement between the FA and the GT were very good. However, one of the assays failed to categorize patients correctly. In particular, 13 IA, 7 IC, and 2 PJP samples provided false negative results only with the GT, because the BDG content in these samples did not reach the positivity threshold recommended by the manufacturer. Lowering the GT cutoff value allowed us to recover 5 IA, 6 IC, and 1 PJP samples as true positive samples, thereby indicating that the manufacturer’s cutoff value might not be appropriate for patients with IA, IC, and PJP. This was in agreement with the observations reported elsewhere [17,18].
With the present study, we aimed to provide further data about the role of serum BDG in the diagnosis of IFDs by means of a comparative assessment of both assays in terms of sensitiv-ity and specificsensitiv-ity using a large number of patient samples. However, we acknowledge the unavoidable limitations of the study. First, we did not explore whether lower sensitivity of the GT, particularly in IA samples, could be due to the use of serum instead of plasma, which the GT manual has listed as a principal specimen for clinical investigation. Nevertheless, we previ-ously showed that serum samples effectively equate plasma samples for BDG measured with GT in patients with probable or proven fungal diseases [19]. Second, we did not assess the predictive value of both assays because of the artificially high prevalence of IFD in our test pop-ulation influencing the value. However, we well know that, at least for candidemia, high sensi-tivity and negative predictive value for serum BDG are both helpful to exclude disease in order to withhold treatment [29]. Third, we waived to compare both assays for important features such as their layout and workflow. However, we experimented that GT is technically less com-plex than the FA regarding the possibility either of testing samples individually or up to 16 samples in parallel, as well as the use of a standard curve provided by the manufacturer and, above all, more simplicity to execute the assay. Fourth, unlike previous studies [17,18], the number of PJP case tested by us was very small.
In conclusion, while confirming the good diagnostic accuracy of serum BDG assay [30], our findings support and/or extend the diagnostic value of both FA and GT into clinical set-tings such as IA, IC, and PJP. We show that the GT performed almost as the FA after optimiz-ing the GT cutoff value for positivity. Further studies are yet necessary to establish the equivalence of both assays in order to provide equally reliable BDG results that can ultimately help clinicians with hard-to-diagnose fungal diseases.
Supporting information
S1 Data. (CSV) S2 Data. (CSV) S3 Data. (CSV) S4 Data. (CSV)Author Contributions
Conceptualization: Elena De Carolis, Maurizio Sanguinetti, Brunella Posteraro.
Data curation: Riccardo Torelli, Morandotti Grazia Angela, Rita Murri, Gennaro De Pascale,
Giulia De Angelis, Maurizio Sanguinetti.
Formal analysis: Elena De Carolis, Federica Marchionni, Riccardo Torelli, Livio Pagano, Rita
Murri, Gennaro De Pascale, Giulia De Angelis.
Funding acquisition: Maurizio Sanguinetti.
Methodology: Morandotti Grazia Angela, Livio Pagano, Giulia De Angelis, Brunella
Posteraro.
Supervision: Maurizio Sanguinetti, Brunella Posteraro. Validation: Elena De Carolis, Brunella Posteraro. Writing – original draft: Brunella Posteraro. Writing – review & editing: Maurizio Sanguinetti.
References
1. Bongomin F, Gago S, Oladele RO, Denning DW. Global and multi-national prevalence of fungal dis-eases—estimate Precision. J Fungi (Basel). 2017; 3:E57.
2. Almeida F, Rodrigues ML, Coelho C. The still underestimated problem of fungal diseases worldwide. Front Microbiol. 2019; 10:214.https://doi.org/10.3389/fmicb.2019.00214PMID:30809213
3. Lamoth F, Lockhart SR, Berkow EL, Calandra T. Changes in the epidemiological landscape of invasive candidiasis. J Antimicrob Chemother. 2018; 73(suppl_1):i4–i13.https://doi.org/10.1093/jac/dkx444
PMID:29304207
4. Lass-Flo¨rl C, Cuenca-Estrella M. Changes in the epidemiological landscape of invasive mould infec-tions and disease. J Antimicrob Chemother. 2017; 72 (suppl_1):i5–i11.https://doi.org/10.1093/jac/ dkx028PMID:28355462
5. Ma L, Cisse´ OH, Kovacs JA. A molecular window into the biology and epidemiology of Pneumocystis spp. Clin Microbiol Rev. 2018; 31:e00009–18.https://doi.org/10.1128/CMR.00009-18PMID:29899010 6. Periselneris J, Brown JS. A clinical approach to respiratory disease in patients with hematological
malig-nancy, with a focus on respiratory infection. Med Mycol. 2019; 57(Suppl_3):S318–S327.
7. Drgona L, Khachatryan A, Stephens J, et al. Clinical and economic burden of invasive fungal diseases in Europe: focus on pre-emptive and empirical treatment of Aspergillus and Candida species. Eur J Clin Microbiol Infect Dis. 2014; 33(1):7–21.https://doi.org/10.1007/s10096-013-1944-3PMID:24026863 8. Patterson TF, Donnelly JP. New concepts in diagnostics for invasive mycoses: non-culture-based
methodologies. J Fungi (Basel). 2019; 5:E9.
9. Karageorgopoulos DE, Vouloumanou EK, Ntziora F, Michalopoulos A, Rafailidis PI, Falagas ME. β-D-glucan assay for the diagnosis of invasive fungal infections: a meta-analysis. Clin Infect Dis. 2011; 52 (6):750–770.https://doi.org/10.1093/cid/ciq206
10. Lu Y, Chen YQ, Guo YL, Qin SM, Wu C, Wang K. Diagnosis of invasive fungal disease using serum (1!3)-β-D-glucan: a bivariate meta-analysis. Intern Med. 2011; 50(22):2783–2791.https://doi.org/10. 2169/internalmedicine.50.6175
11. Onishi A, Sugiyama D, Kogata Y, et al. Diagnostic accuracy of serum 1,3-β-D-glucan for Pneumocystis jiroveci pneumonia, invasive candidiasis, and invasive aspergillosis: systematic review and meta-analy-sis. J Clin Microbiol. 2012; 50(1):7–15.https://doi.org/10.1128/JCM.05267-11
12. Karageorgopoulos DE, Qu JM, Korbila IP, Zhu YG, Vasileiou VA, Falagas ME. Accuracy ofβ-D-glucan for the diagnosis of Pneumocystis jirovecii pneumonia: a meta-analysis. Clin Microbiol Infect. 2013; 19 (1):39–49.https://doi.org/10.1111/j.1469-0691.2011.03760.x
13. Theel ES, Doern CD.β-D-glucan testing is important for diagnosis of invasive fungal infections. J Clin Microbiol. 2013; 51(11):3478–3483.
14. McCarthy MW, Petraitiene R, Walsh TJ. Translational development and application of (1!3)-β-D-glu-can for diagnosis and therapeutic monitoring of invasive mycoses. Int J Mol Sci. 2017; 18:E1124.
15. He S, Hang JP, Zhang L, Wang F, Zhang DC, Gong FH. A systematic review and meta-analysis of diag-nostic accuracy of serum 1,3-β-D-glucan for invasive fungal infection: focus on cutoff levels. J Microbiol Immunol Infect. 2015; 48(4):351–361.https://doi.org/10.1016/j.jmii.2014.06.009
16. Finkelman MA. Pneumocystis jirovecii infection: cell wall (1!3)-β-D-glucan biology and diagnostic util-ity. Crit Rev Microbiol. 2010; 36(4):271–281.https://doi.org/10.3109/1040841X.2010.484001
17. Mercier T, Guldentops E, Patteet S, Beuselinck K, Lagrou K, Maertens J. Beta-D-glucan for diagnosing Pneumocystis pneumonia: a direct comparison between the Wakoβ-glucan assay and the Fungitell assay. J Clin Microbiol. 2019; 57:e00322–19.https://doi.org/10.1128/JCM.00322-19
18. Friedrich R, Rappold E, Bogdan C, Held J. Comparative analysis of the Wakoβ-glucan test and the Fungitell assay for diagnosis of candidaemia and Pneumocystis jirovecii pneumonia. J Clin Microbiol. 2018; 56:e00464–18.https://doi.org/10.1128/JCM.00464-18
19. De Carolis E, Marchionni F, Torelli R, et al. Comparable serum and plasma 1,3-β-D-glucan values obtained using the Wakoβ-glucan test in patients with probable or proven fungal diseases. J Clin Micro-biol. 2019; 57:e00149–19.https://doi.org/10.1128/JCM.00149-19
20. De Pauw B, Walsh TJ, Donnelly JP, et al. Revised definitions of invasive fungal disease from the Euro-pean Organization for Research and Treatment of Cancer/Invasive Fungal Infections Cooperative Group and the National Institute of Allergy and Infectious Diseases Mycoses Study Group (EORTC/ MSG) Consensus Group. Clin Infect Dis. 2008; 46(12):1813–1821.https://doi.org/10.1086/588660
PMID:18462102
21. Alanio A, Hauser PM, Lagrou K, et al. ECIL guidelines for the diagnosis of Pneumocystis jirovecii pneu-monia in patients with haematological malignancies and stem cell transplant recipients. J Antimicrob Chemother. 2016; 71(9):2386–2396.https://doi.org/10.1093/jac/dkw156PMID:27550991
22. Donnelly JP, Chen SC, Kauffman CA, et al. Revision and update of the consensus definitions of inva-sive fungal disease from the European Organization for Research and Treatment of Cancer and the Mycoses Study Group Education and Research consortium. Clin Infect Dis. 2019 Dec 5. [ahead of print].
23. Dichtl K, Seybold U, Wagener J. Serological biomarkers of candidemia: a retrospective evaluation of three assays. Infection. 2019; 47(2):217–224.https://doi.org/10.1007/s15010-018-1224-3PMID:
30264200
24. Dichtl K, Seybold U, Wagener J. Evaluation of a turbidimetricβ-d-glucan test for detection of Pneumo-cystis jirovecii pneumonia. J Clin Microbiol. 2018; 56(7):e00286–18.https://doi.org/10.1128/JCM. 00286-18
25. Yoshida K, Shoji H, Takuma T, Niki Y. Clinical viability of Fungitell, a new (1!3)-β-D: -glucan measure-ment kit, for diagnosis of invasive fungal infection, and comparison with other kits available in Japan. J Infect Chemother. 2011; 17(4):473–477.https://doi.org/10.1007/s10156-010-0198-6
26. Held J, Kohlberger I, Rappold E, Busse Grawitz A, Ha¨cker G. Comparison of (1->3)-β-D-glucan, man-nan/anti-mannan antibodies, and Cand-Tec Candida antigen as serum biomarkers for candidemia. J Clin Microbiol. 2013; 51(4):1158–1164.https://doi.org/10.1128/JCM.02473-12
27. Danion F, Rouzaud C, Dure´ault A, et al. Why are so many cases of invasive aspergillosis missed?. Med Mycol. 2019; 57(Supplement_2):S94–S103.https://doi.org/10.1093/mmy/myy081PMID:30816963 28. Hou TY, Wang SH, Liang SX, Jiang WX, Luo DD, Huang DH. The screening performance of serum
1,3-beta-D-glucan in patients with invasive fungal diseases: a meta-analysis of prospective cohort studies. PLoS One. 2015; 10:e0131602.https://doi.org/10.1371/journal.pone.0131602PMID:26146829 29. Posteraro B, Tumbarello M, De Pascale G, et al. (1,3)-β-D-glucan-based antifungal treatment in
criti-cally ill adults at high risk of candidaemia: an observational study. J Antimicrob Chemother. 2016; 71 (8):2262–2269.https://doi.org/10.1093/jac/dkw112
30. Murri R, Camici M, Posteraro B, et al. Performance evaluation of the (1,3)-β-D-glucan detection assay in non-intensive care unit adult patients. Infect Drug Resist. 2018; 12:19–24.https://doi.org/10.2147/ IDR.S181489