2021-02-11T08:37:48Z Acceptance in OA@INAF
Active Galactic Nuclei in Dusty Starbursts at z = 2: Feedback Still to Kick in Title
Rodighiero, G.; Enia, A.; DELVECCHIO, IVAN; Lapi, A.; Magdis, G. E.; et al. Authors
10.3847/2041-8213/ab222e DOI
http://hdl.handle.net/20.500.12386/30311 Handle
THE ASTROPHYSICAL JOURNAL LETTERS Journal
877 Number
AGN IN DUSTY STARBURSTS AT z=2: FEEDBACK STILL TO KICK IN
G. Rodighiero,1, 2 A. Enia,1 I. Delvecchio,3 A. Lapi,4, 5 G. E. Magdis,6, 7, 8 W. Rujopakarn,9 C. Mancini,1, 2 L. Rodr´ıguez-Mu˜noz,1 R. Carraro,10 E. Iani,1 M. Negrello,11
A. Franceschini,1 A. Renzini,2 C. Gruppioni,12 M. Perna,13 I. Baronchelli,1 A. Puglisi,3 P. Cassata,1 E. Daddi,3 L. Morselli,1 and J. Silverman14, 15
1Dipartimento di Fisica e Astronomia, Universit´a di Padova, Vicolo dell’Osservatorio, 3 35122 Padova, Italy 2INAF Osservatorio Astronomico di Padova, vicolo dellOsservatorio 5, I-35122 Padova, Italy
3Laboratoire AIM-Paris-Saclay, CEA/DSM-CNRS-Universit Paris Diderot, Irfu/Service dAstrophysique, CEA-Saclay,
Service dAstrophysique, F-91191 Gif-sur-Yvette, France
4SISSA, Via Bonomea 265, 34136 Trieste, Italy
5IFPU - Institute for fundamental physics of the Universe, Via Beirut 2, 34014 Trieste, Italy
6Cosmic Dawn Center at the Niels Bohr Institute, University of Copenhagen and DTU-Space, Technical University of
Denmark
7Niels Bohr Institute, University of Copenhagen, Lyngbyvej 2, DK-2100 Copenhagen, Denmark
8Institute for Astronomy, Astrophysics, Space Applications and Remote Sensing, National Observatory of Athens,
GR-15236 Athens, Greece
9Department of Physics, Faculty of Science, Chulalongkorn University, 254 Phayathai Road, Pathumwan, Bangkok
10330, Thailand
10Instituto de F´ısica y Astronom´ıa, Universidad de Valpara´ıso, Gran Bretana 1111, Playa Ancha, Valpara´ıso, Chile 11School of Physics and Astronomy, Cardiff University, The Parade, Cardiff CF24 3AA, UK
12Osservatorio di Astrofisica e Scienza dello Spazio Istituto Nazionale di Astrofisica, via Gobetti 93/3, I-40129,
Bologna, Italy
13INAF - Osservatorio Astrofisico di Arcetri, Largo Enrico Fermi 5, I-50125 Firenze, Italy
14Kavli Institute for the Physics and Mathematics of the Universe (WPI), Todai Institutes for Advanced Study, the
University of Tokyo, Kashiwanoha, Kashiwa, 277-8583, Japan
15Department of Astronomy, School of Science, The University of Tokyo, 7-3-1 Hongo, Bunkyo, Tokyo 113-0033, Japan (Received January 20, 2019; Revised March 12, 2019; Accepted May 20, 2019)
Submitted to ApJ ABSTRACT
We investigate a sample of 152 dusty sources at 1.5 < z < 2.5 to understand the connection of enhanced Star-Formation-Rate (SFR) and Black-Hole-Accretion-Rate (BHAR). The sources are Herschel-selected, having stellar masses M∗ > 1010M and SFR (∼ 100 − 1000M /yr) elevated
(> 4×) above the star-forming ”main sequence”, classifying them as Starbursts (SB). Through a mul-tiwavelength fitting approach (including a dusty torus component), we divided the sample into active SBs (dominated by an AGN emission, SBs-AGN,∼ 23% of the sample) and purely star-forming SBs (SBs-SFR). We visually inspected their HST/UV-restframe maps: SBs-SFR are generally irregular and composite systems;∼ 50% of SBs-AGN are instead dominated by regular compact morphologies.
Corresponding author: G. Rodighiero
We then found archival ALMA continuum counterparts for 33 galaxies (12 AGN and 21 SBs-SFR). For these sources we computed dust masses, and, with standard assumptions, we also guessed total molecular gas-masses. SBs turn to be gas rich systems (fgas = Mgas/(Mgas+M∗)' 20%−70%),
and the gas fractions of the two SB classes are very similar (fgas = 43± 4% and fgas = 42± 2%).
Our results show that SBs are consistent with a mixture of: 1) highly star-forming merging systems (dominating the SBs-SFR), and 2) primordial galaxies, rapidly growing their M∗ together with their
Black Hole (mainly the more compact SBs-AGN). Anyway, feedback effects have not reduced their fgas yet. Indeed, SBs at z = 2, with relatively low bolometric AGN luminosities in the range
1044 < L
bol(AGN ) < 1046 erg/s (compared to bright optical and X-ray quasars), are still relatively
far from the epoch when the AGN feedback will quench the SFR in the host and will substantially depress the gas fractions.
1. INTRODUCTION
The existence of a natural correlation be-tween stellar mass and SFR for the bulk of star forming galaxies (i.e. the so called Main Se-quence, hereafter MS,Daddi et al. 2007;Magdis
et al. 2010; Whitaker et al. 2012; Speagle et
al. 2014) and the identification of highly star-forming outliers above it, implies that two main processes of galaxy growth occur: 1) a secu-lar growth along a (quasi) steady state, and 2) stochastic episodes of major galaxy growth, possibly driven by major mergers that trigger short-lived and intense starbursts (SB). Simi-larly, two different ways of Black Hole (BH) growth seem to hold. Likely, secular processes dominate the growth of intermediate-to-low lu-minosity BHs, e.g. through continuous gas refu-elling (Mullaney et al. 2012). Instead, the most luminous population of AGN may experience a different growth history strictly connected to the starburst activity in off-MS galaxies. In-deed, SBs show the following indications of en-hanced AGN activity: 1) higher average X-ray luminosities (Rodighiero et al. 2015, and Car-raro et al., in prep) 2) higher AGN fraction (up to 50-80%) both in the local Universe ( Alexan-der & Hickox 2012), and at high-z (Bongiorno
et al. 2012; Perna et al. 2018), compared to
MS galaxies (∼ 25 − 30%, Brusa et al. 2009) This implies that the AGN duty cycle is higher above the MS, and the black hole accretion rate (BHAR) more efficient.
Many observational efforts have been devoted to understand what triggers the fast gas con-sumption rate in these spectacular sources (
Sil-verman et al. 2015; Cibinel et al. 2018;
Cal-abr`o et al. 2019). Mergers are often invoked as the more likely mechanism, although it is still not clear if this is sufficient to explain the en-hanced star formation of SBs compared to nor-mal galaxies (Silverman et al. 2018). Some au-thors suggest that the merger mechanism en-hancing SFR in many SBs could be
responsi-ble also for the AGN ignition (e.g. Di Matteo et al. 2005; Capelo et al. 2015; Steinborn et al. 2018). This scenario is, however, still quite de-bated (e.g. Mancuso et al. 2016; Wang et al. 2019).
In this Letter, we investigate the properties of starbursts in COSMOS at 1.5 < z < 2.5. We study their morphologies, AGN contribution and molecular gas contents (for a sub-sample with an ALMA continuum observation) to infer potential observational evidences of feedback in-duced by AGN.
We adopt a Chabrier (2003) IMF assuming a standard cosmology with H0 = 70, Ωλ = 0.7,
Ω0 = 0.3.
2. DUSTY STARBURSTS AT 1.5 < Z < 2.5: SAMPLE SELECTION
We adopt the Herschel far-Infrared catalog, associated to the COSMOS2015 sample (Laigle et al. 2016), to select a sample of highly star-forming dusty galaxies at the peak of the cosmic SFR density (i.e. 1.5 < z < 2.5). PACS and SPIRE-Herschel data are originally from the PEP (Lutz et al. 2011) and HerMES (Oliver et
al. 2012) surveys, with corresponding
photome-try extracted with a 24µm priors PSF fitting procedure. Sources identification, multiwave-length photometry, M∗ and redshifts are from
the COSMOS2015 sample. Starbursts (SBs) are selected to have a SFR well elevated above the MS at z = 2, at least a factor 4, as inRodighiero et al. (2011).
2.1. SED fitting: SFR and AGN computation We fit the multiwavelength SEDs of the Herschel sources to derive their physical char-acterization. We used both the MAGPHYS (da
Cunha et al. 2008), and the SED3FIT (Berta
et al. 2013) SED-fitting codes, the latter
ac-counting for an additional AGN component (dusty torus). MAGPHYS relies on the en-ergy balance between the dust-absorbed stellar continuum and the reprocessed dust emission
9.5
10.0
10.5
11.0
11.5
12.0
log M
∗[M
]
10
110
210
3SFR
[M
/y
r]
COSMOS15 SBs-SFR SBs-AGN MS 4-MS ALMA detectionFigure 1. Sample selection in the SFR-M∗ plane for the COSMOS field at 1.5 < z < 2.5. Orange
stars mark the original Herschel sample. Blue and red stars show the position of SBs-AGN and SBs-SFR, respectively (see Section 2.1). Black open circles indicate the SB sources with an ALMA detection. Black dots are star-forming BzK (Daddi et al. 2007). We report as dashed cyan lines evolutionary tracks of galaxies
(Lapi et al. 2018) starting with different initial SFR and final total M∗ (time follows the arrows direction,
see discussion in Section 6.2). The vertical black dashed line marks the mass limit of our SBs selection (see text for details).
at infrared wavelengths. SED3FIT combines the emission from stars, dust heated by star formation, and a possible AGN-torus compo-nent from the library of Feltre et al. (2012). We fitted each observed SED by using the best available redshift (either spectroscopic or pho-tometric) as input. The SFR was derived from the total IR (rest frame [8-1000] µm) luminosity taken from the best-fit galaxy SED (subtracted by the AGN luminosity, if present), assuming a
Kennicutt (1998) conversion.
Out of 1790 Herschel detected sources at 1.5 < z < 2.5, we identified a sample of 164 SBs (see Figure 1). We limit our analysis to M∗ >
1010M
(to ensure an unbiased mass complete
selection, seeLaigle et al. 2016) reducing the SB sample to 152 objects.
2.2. AGN classification
In order to quantify the relative incidence of a possible AGN component, we fitted each indi-vidual observed SED. The fit obtained with the AGN is preferred if the reduced χ2 value of the
best fit (at ≥99% confidence level, on the ba-sis of a Fisher test) is significantly smaller than that obtained from the fit without the AGN (see
Delvecchio et al. 2014). From our analysis, 35
out of 152 starbursts (about 23%) show a sig-nificant AGN component. In the following, we will refer to these two classes as SBs with ev-idences of a nuclear activity (SBs-AGN) and SFR dominated SBs (SBs-SFR), respectively.
We have verified that out of 152 SBs in our starting sample, only eight are classified as X-ray AGN (Laigle et al. 2016), six of which are identified by our AGN classification. This check ensures that we recover the bulk (i.e. 75%) of the classical X-ray/AGN selection1, extending the sample to include also the most obscured active sources (e.g.Bongiorno et al. 2012; Grup-pioni et al. 2016).
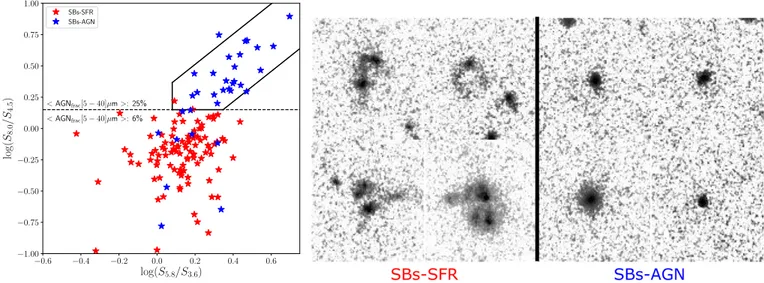
Moreover, since at 1.5 < z < 2.5 the IRAC bands span the rest-frame near-IR where the galaxy stellar emission peaks, to ensure that the AGN classification is not contaminated we per-formed a further test. Thus, to verify if substan-tially old stellar populations could bias the AGN selection, we computed the mass weighted ages of all SBs in our sample with and without the dusty torus component: in spite of a significant scatter (∼0.3dex), no offset is observed in the measured average stellar ages of the systems, both for SBs-SFR and SBs-AGN (probing that the SED3FIT software correctly recovers, in a statistical sense, the near-IR light arising from the stellar populations and from the torus). We have also tested our AGN selection procedure against classical IRAC/Spitzer colour-colour di-agnostics, as the one proposed by Donley et al.
(2012), finding that∼ 80% of the SBs-AGN fall into the AGN region, while just one of the SBs-SFR are mis-classified as AGN (see Fig.2, left panel). A comparison with the average frac-tion of the luminosities coming from the AGN component at [5-40]µm in the SED modelling,
1 As a consistency check, for X-ray undetected
SBs-AGN, we computed the expected [2-10]keV X-ray fluxes, derived from the AGN bolometric luminosities obtained by the SED fitting procedure described in Section 2.1. By applying a suited bolometric correction (Yang et al. 2018), and a K-correction=(1 + z)Γ−2 (with Γ = 1.5,
consistently with the stacked Hardness Ratios of our sources), we obtain a median F[2-10]keV on the order of ∼ 1.7 × 10⁻¹⁵keV, right below the limit of the Chandra
detectability in this band (∼ 1.9 × 10⁻¹⁵ keV,Marchesi et al. 2016)
confirms that sources lying above the dashed line in the left panel of Fig.2 have four times larger AGN contributions (25% vs 6%, in terms of the light fraction arising from the torus in the mid-IR) with respect to the sources below the same line. This indicates that the procedure adopted in this work to classify AGN preferen-tially selects sources dominated by a torus com-ponent at mid-IR wavelengths (as expected). The comparison of our AGN selection criterium with the colour-colour plot presented in Fig. 2 (left panel) shows that our SBs-AGN sample is highly reliable2(contamination≤ 20%), but not necessarily complete (Donley et al. 2012).
3. UV-RESTFRAME HST MORPHOLOGICAL ANALYSIS We performed a visual inspection on the COS-MOS/HST ACS i-band images of the 140 (out of 152) SBs for which the data are available (corresponding to the UV-restframe at z = 2). Excluding undetected sources (9 out of 33 SBs-AGN, 39 out of 107 SBs-SFR), this analysis re-veals that the two starburst classes have sta-tistically different typical morphologies: SBs-SFR are disturbed systems (56 out of 68, i.e. ∼82±11% of the HST detected sample), with evident tidal interaction between multiple com-ponents (possibly ongoing mergers or clumpy disks); SBs-AGN are (13 out of 24 detection, ∼55±15%) dominated by regular compact and symmetric morphologies. We note that for Type 1 sources the HST imaging would be domi-nated by the AGN outshining the hosts. From our SED fitting, we estimate that just a frac-tion of the compact SBs-AGN are consistent with a Type 1 classification, lowering to ∼34%
2Even if starburst templates are a dominant
contam-inant of mid-IR AGN selection techniques (Rodighiero et al. 2007;Donley et al. 2012) have demonstrated that their conservative selection minimizes the inclusion of purely star-forming LIRGS and ULIRGS, whose tem-plates begin to enter the IRAC selection region only at z > 2.7.
the percentage of compact AGN in the sample, still significantly higher then the corresponding value among the SBs-SFR (∼18%). To over-come the uncertainties related to our SED fit-ting approach on the classification of Type 1 AGN, and the shallowness of the X-ray Chandra data in COSMOS, we rely on a stacking proce-dure to compute separately the average soft (S) and hard (H) X-ray fluxes for the different AGN morphological classes. We used the CSTACK tool3 (v3.1, T. Miyaji) and derive the average Hardness Ratio, HR = (H−S)/(H +S), of our SBs-AGN sample (see details on the procedure
inRodighiero et al. 2015). We found that
com-pact, i-band undetected and extended sources have compatible HR =−0.12±0.11, 0.02±0.31, −0.04 ± 0.13, respectively. This result suggests that all AGN in our classification have similar levels of extinction, with column densities on the order of NH ∼ 1022− 1023 (see Rodighiero
et al. 2015). This is inconsistent with a
dom-inant budget of unobscured AGN light arising at UV wavelengths among the compact sources (that could potentially influence rapid morpho-logical transformations in the hosts, e.g. Pierce et al. 2010). Indeed, these NH values are in the
typical range of obscuration observed for Type 2 AGN at z = 2 (Marchesi et al. 2016).
By including also the i-band undetected sources, the fraction of visual compact sources would be ∼11±3% and ∼39±7% for SBs-SFR and SBs-AGN, respectively. Typical examples of the different classes are shown in Figure
2. We caution that this morphological anal-ysis is limited by the shallowness of the COS-MOS/HST imaging, but also by the huge dust extinction associated to the SBs, that allows only a minor contribution of un-absorbed UV light to escape the obscured star-forming re-gions (Puglisi et al. 2017). Despite these im-portant limitations, we interpret our results as
3 http://cstack.ucsd.edu/cstack/
a supporting evidence that SBs-AGN are prob-ably more compact and dense sources, likely corresponding to a final merger stage (as many local ULIRGs, Sanders et al. 1988).
3.1. ALMA continuum counterparts We searched for possible ALMA millimetric counterparts of the SBs in the public archive, adopting a search radius of 2.5”. The final sam-ple includes 33 sources with a clear detection over 3σ, mostly in band 7 at 870µm (with 4 un-detected sources that we do not include in this work), with few of them detected also in band 3 or 2. The measurement sets were cali-brated running the data reduction scripts with the Common Astronomy Software Applications (CASA). Fluxes and associated errors were eval-uated with CASA, by fitting the emissions with a bi-dimensional Gaussian, and are reported in Table 3.1. For the 33 ALMA detected sources, we included the sub-mm fluxes in the observed SED and we performed a second fitting run, as described in Section2.1. The updated physical parameters are reported in Table3.1.
4. RESULTS
In this Section, we report the main results of our analysis of the gas masses computed for the SBs with an ALMA continuum detection. Out of 33 sources, 12 objects turn to be SBs-AGN, thus representing 36% of our sample. We note that this limited ALMA detected data-set is quite representative of the whole SB popu-lation in this redshift range (in terms of M∗,
elevation above the MS and AGN content, see Figure1).
4.1. Comparison sample
For comparative analyses, we use the refer-ence sample compiled by Sargent et al. (2014) andPerna et al.(2018), including ’typical’ star-forming galaxies at z≤ 3 with measurements of their CO luminosity. Local ULIRGs and high-z starbursts with a CO detection are added.
−0.6 −0.4 −0.2 0.0 0.2 0.4 0.6 log(S5.8/S3.6) −1.00 −0.75 −0.50 −0.25 0.00 0.25 0.50 0.75 1.00 log (S8. 0 /S 4. 5 ) <AGN frac[5− 40]µm >: 25% <AGNfrac[5− 40]µm >: 6% SBs-SFR SBs-AGN
Figure 2. Left panel: Colour-colour IRAC plot of the 152 SBs selected in COSMOS. Blue stars are classified as SBs-AGN (35 in total), red stars as SBs-SFR (117). Black lines mark the position of the AGN selection criteria fromDonley et al.(2012). The mean value of the sample AGN contribution (in percentage units) between [5-40]µm over and below this value is reported. Right panel: Morphological examples of SFR dominated starbursts (left) and AGN dominated starbursts (right). HST-ACS cutouts have a size of 5” x 5”.
Detailed references for the various samples in-cluded are reported inSargent et al. (2014) and
Perna et al. (2018). We added the recent
com-pilation of SBs by Silverman et al. (2015) and Silverman et al. (2018), at z ∼ 1.6.
4.2. Dust and molecular gas masses Dust masses (Mdust) have been derived
fol-lowing the procedure described in Magdis et al.
(2012a, 2017) by fitting the SED in the
IRAC-ALMA observed frame with the Draine & Li
(2007) models. The total gas mass (Mgas, which
incorporates both the molecular and atomic phases) can be inferred from the dust mass through the metallicity dependent gas-to-dust ratio (GDR, e.g.Eales et al. 2010;Magdis et al.
2012a): Mgas = Mdust/GDR(Z). For
consis-tency with Mgas estimates of SBs in the
lit-erature, we adopt GDR ≈ 30, that based on
Magdis et al. (2012a) corresponds to a
CO-to-Mgas αco conversion factor of 0.8 M / (K km
s−1 pc2), typically used for strong starbursts.
For completeness we also infer Mgas estimates
with GDR ≈ 95 that corresponds to solar gas-phase metallicity that could be considered as
a lower limit (on metallicity, hence upper limits on GDR and thus on Mgas) for dust
obscured SBs (e.g. Puglisi et al. 2017). These Mgas estimates are consistent (within 0.15dex)
with the average Mgas estimates derived based
on the monochromatic flux densities in the R-J tail of the SED (one or more of 870, 1300, and 3000 µm in our case) and the recipe presented inScoville et al. (2017).
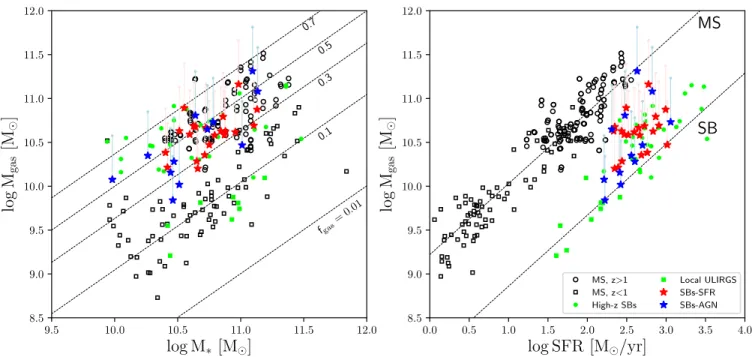
4.3. Gas masses and gas fractions in SBs-AGN and SBs-SFR
We report in Figure 3 (left panel) the gas masses of the SBs as a function of their M∗,
divided into SBs-AGN and SBs-SFR (blue and red filled stars, respectively). The SB popula-tion is dominated by gas rich galaxies, with gas fractions (defined as fgas = Mgas/(Mgas+ M∗))
spanning the range 20%-70%. This is simi-lar to the typical fgas (∼ 50%) of the
nor-mal star-forming sources at similar z (open cir-cles). Local star-forming galaxies (both MS and ULIRGs/SBs) are instead much gas poorer, with fgas ∼ 10%, as expected on the basis of
ID RA DEC z logLIR logLAGN logM∗ logMgas AGN F870 µm F1.3mm F3.0mm
COSMOS15 [deg] [deg] [L ] [erg/s] [M ] [M ] [mJy] [mJy] [mJy]
182648 150.64316 1.558194 1.6887 11.115 45.595 10.4616 9.840 yes 0.49±0.10 - -221280 149.76807 1.617000 2.3220 11.185 43.945 10.4703 10.282 yes 1.11±0.22 - -244448 150.01202 1.652130 (1.5180) 10.645 - 10.7505 10.472 no 2.01±0.25 - -280968 149.79010 1.711870 1.7844 11.343 - 10.4035 10.384 no 1.33±0.25 - -323041 149.81653 1.779770 2.0933 11.244 44.135 10.5122 10.018 yes 1.38±0.46 - -349784 150.48938 1.821710 1.9693 11.100 - 10.8425 10.628 no 1.59±0.34 - -386956 150.34194 1.880208 2.2493 11.346 - 10.6594 10.201 no 1.88±0.30 - -505526 150.42101 2.068100 2.2684 10.666 45.245 11.0934 11.313 yes 11.93±0.71 - -506667 150.72984 2.071170 2.4433 11.200 - 10.5955 10.590 no 2.23±0.77 - -524710 149.76853 2.099614 2.1059 11.321 - 10.4187 10.214 no 1.72±0.23 - -571598 150.61642 2.167971 1.5052 11.167 - 10.8600 10.792 no 5.39±0.23 - -578926 150.40103 2.180390 (2.3341) 11.567 - 10.9570 10.617 no 2.05±0.55 - -600601 150.13265 2.211946 1.9875 10.752 45.605 11.1349 11.081 yes 8.27±0.44 2.46±0.10 -605409 149.76813 2.219876 (1.7766) 11.112 - 10.8708 10.585 no 3.78±1.03 - -640026 150.03663 2.270976 1.7977 11.313 44.185 10.2632 10.349 yes 1.09±0.27 - -642313 149.60419 2.275064 2.0069 11.254 - 10.6391 10.677 no 1.77±0.31 - -651584 149.92196 2.289929 2.3341 11.600 - 10.8786 10.626 no 4.93±0.34 - -734578 149.52823 2.413200 1.9641 11.765 - 10.5523 10.893 no - 1.88±0.23 -745498 150.46551 2.429549 1.6332 10.731 - 10.7144 10.355 no 3.47±0.34 - -747590 150.22447 2.433010 1.6351 10.903 - 10.6513 10.285 no 1.60±0.24 - -752016 150.33683 2.439920 2.2682 11.585 - 10.7232 10.665 no 4.50±0.31 - -754372 150.06907 2.444010 2.4355 11.439 45.595 11.0108 10.468 yes 4.86±0.65 - 0.275±0.065 769248 150.25528 2.466839 (2.2640) 10.903 - 10.5134 10.629 no 3.80±0.42 - -794848 150.09341 2.507339 2.1990 11.365 45.975 10.7362 10.648 yes 3.09±0.25 - -810228 150.11307 2.528020 2.0167 11.264 - 10.6265 10.687 no - - 0.137±0.060 815012 150.60329 2.536536 (2.2872) 11.119 - 11.1034 10.692 no 6.70±0.35 - -818426 150.72202 2.541904 2.2664 11.607 45.935 10.6405 10.807 yes 1.01±0.30 - -842595 149.99796 2.578227 2.4200 11.693 44.205 10.7809 10.732 yes 1.97±0.32 - -902320 150.03726 2.669600 (1.5990) 10.274 - 10.9826 11.162 no 6.41±0.39 - 0.147±0.057 917423 149.99218 2.693436 2.1284 11.330 - 10.7933 10.581 no 1.77±0.34 - -917546 150.16165 2.691588 (1.9745) 10.937 44.785 10.4437 10.156 yes 1.39±0.25 - -951838 150.26832 2.749270 2.0186 11.128 45.535 9.9814 10.076 yes 1.60±0.24 - -980250 150.01611 2.792355 1.7598 10.533 - 11.1303 10.875 no 5.03±0.25 -
-time (e.g. Magdis et al. 2012b; Tacconi et al. 2018, and references therein).
When looking at the separate gas fractions of SBs-AGN and SBs-SFR, we do not observe a significant difference, providing average values of fgas = 43 ± 4% and fgas = 42 ± 2% for the
two classes, respectively.
To shed more light on our analysis in the most efficient star-forming sources, we study (right panel of Figure3) the distribution of Mgas as a
function of SFR, in order to compare the star
formation efficiency (i.e. SFE = SFR/Mgas) of
SBs-AGN and SBs-SFR. Our sample turns to be ”SFR-selected” by construction, with SFR ≥ 150M /yr due to the requirement of being
Herschel selected (see Figure1). We then ob-serve that SBs lie on a contiguous sequence of increasing SFE, that fills the gap between the two paradigmatic sequences of normal galaxies and ULIRG/SBs (dotted lines, as from Sargent et al. 2014), usually interpreted as the main loci of two extremely different SF modes. Our
re-9.5 10.0 10.5 11.0 11.5 12.0 log M∗ [M ] 8.5 9.0 9.5 10.0 10.5 11.0 11.5 12.0 log Mgas [M ] 0.7 0.5 0.3 0.1 fgas =0.01 0.0 0.5 1.0 1.5 2.0 2.5 3.0 3.5 4.0 log SFR [M /yr] 8.5 9.0 9.5 10.0 10.5 11.0 11.5 12.0 log Mgas [M ] MS SB MS, z>1 MS, z<1 High-z SBs Local ULIRGS SBs-SFR SBs-AGN
Figure 3. Left panel: Mgas versus M∗ for the SBs with an ALMA detection (blue stars: SBs-AGN; red
stars: SBs-SFR). Mgasare evaluated adopting a solar metallicity and an αCOof 0.8, corresponding to a DGR
of 30, and represent our reference values; light points and relative connectors still refer to solar metallicity, but with αCO = 1.0. Formal errors are smaller then the difference computed with the two methods. Loci
of constant gas fraction (i.e. Mgas/(Mgas+ M∗)), are shown with dotted lines. Open black squares (circles)
represent MS galaxies at z < 1(> 1) as compiled by Sargent et al. (2014) and Perna et al. (2018). Green symbols show local ULIRGs (filled squares) and high-z starbursts (filled circles). Right panel: Mgas versus
SF R. Empirical model curves (dashed lines) for MS and ULIRGs/SB are described inSargent et al.(2014). sults support recent works suggesting the
exis-tence of a continuous increase in SFE with ele-vation from the main sequence, as opposed to a bimodal distribution (Silverman et al. 2018).
5. DISCUSSION
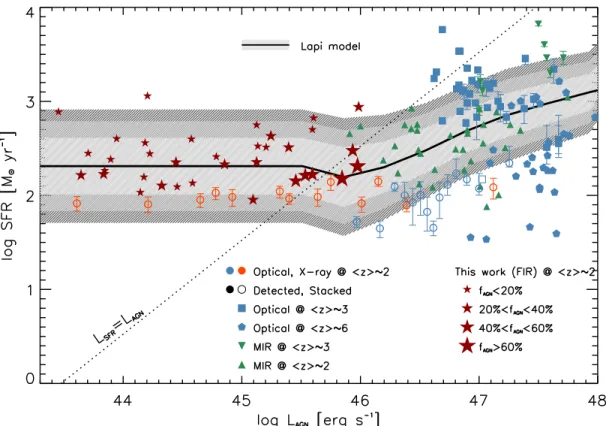
5.1. Comparison with the merger triggered SB-QSO evolutionary sequence As mentioned in Section 1, we can compare our results with the expectations of the AGN-galaxy co-evolutionary scenario, that predicts a luminous IR phase of buried SMBH growth, co-existing with a starburst (likely arising from a merger, Koss et al. 2018; Donley et al. 2018) before feedback phenomena deplete the cold molecular gas reservoir of the galaxy and an op-tically luminous quasar (QSO) shines out (
Hop-kins et al. 2008). On one side, we have
quali-tatively observed that starbursts including an
AGN have on average more compact and nucle-ated UV-restframe morphologies with respect to ”inactive” SBs, suggesting that they are kept in a different dynamical evolutionary phase. This could correspond to the key transition when the late mergers trigger a high SFR, before the fully developed AGN phase. Simulations and obser-vations, indeed, suggests a temporal delay be-tween the peak of the SFR and the peak of the BHAR (Rodighiero et al. 2015; Bergvall et al.
2016; Lapi et al. 2016). On the other side, we
did not find a significant reduction of gas frac-tions in the SBs-AGN hosts compared to ”inac-tive” SBs-SFR. We argue that, if major mergers are the main triggering mechanism of obscured BHAR in SBs, feedback phenomena (producing large outflows from the central BH) are not ef-ficient in removing significant amount of molec-ular gas in the host galaxies.
Figure 4. Co-evolution plane between bolometric AGN luminosity and SFR in the hosts z > 1.5. The gray shaded areas show the average locus of the evolutionary tracks from the model of Lapi et al. (2018), adopting a SFR detection threshold around 102M
yr−1. Orange symbols refer to X-ray AGNs, green to
mid-IR selected AGNs, blue to optically selected QSO. Complete references are reported in Bianchini et al.
(2018). We include all SBs-AGN from our original sample (red filled stars): size of the symbol is proportional to the AGN luminosity contribution in the 5-40 µm range, derived from SED3F IT . SFR for the SBs in our sample is derived from LIR in Table 1.
5.2. Starbursts as primordial galaxies An alternative interpretation for the proper-ties of the off-MS galaxies is provided by an in-situ co-evolution scenario (Lapi et al. 2018), en-visaging high-z galaxy evolution to be mainly ruled by the interplay between in-situ processes like gas infall, compaction, star formation, ac-cretion onto the hosted central SMBHs, and re-lated feedback processes (with wet galaxy merg-ers having a minor role at z > 1). In this framework z ∼ 2 sources with SFR > a few 102M
constitute the progenitor of local
mas-sive spheroids with stellar mass M∗ > 1011M .
During their star-forming phase, lasting some 108 yr, these galaxies feature a nearly constant
SFR and a linearly increasing stellar mass. In the SFR-M∗ diagram they follow an almost
hor-izontal track (see cyan tracks in Fig.1) while moving toward the galaxy MS locus; there they will have acquired most of their mass before being quenched by energy/momentum feedback from the SMBH.
Being in the early stages of their evolution, the SBs can host only a rather small SMBH, originating a bolometric AGN luminosity LAGN
weaker than that LSF R associated to the SFR
in the host. However, the BH mass is expected to grow exponentially generating a noticeable statistical variance in LAGN at given SFR. As
a consequence, in the SFR vs. LAGN plane,
SBs are expected to populate a strip parallel to the LAGN axis, and located to the left of
the locus where LSF R = LAGN (see Figure 4
are expected to be obscured and with luminos-ity still not powerful enough to originate sub-stantial feedback effects on the ISM of the host galaxy; thus, the SFR and the gas mass of the host are still not much affected. The compact morphologies of SBs-AGN (possibly linked to a forming bulge) could indicate that these sources are observed when the host stellar mass and the BH mass are reaching their maximum, just be-fore the feedback gets into action and the BHAR and SFR gets quenched (Lapi et al. 2014); fur-ther size evolution of the stellar component may be induced by the feedback itself and by late-time mass addition from dry mergers (see Lapi et al. 2018).
6. SUMMARY
In conclusion, the results presented in this work are consistent with the idea that the SB population could be filled by a mixture of: 1) a class of highly star-forming merging sources (preferentially among the SBs-SFR), and 2) pri-mordial galaxies, quickly accreting their M∗
to-gether with their BH (mainly the SBs-AGN). If the level of AGN luminosity (proportional to BHAR) is also correlated with the power of feedback, then IR-selected SBs are mainly low-luminosity AGN, and feedback effects have not yet started to eventually reduce the gas frac-tion of the objects (as observed for local Seyfert in a similar AGN luminosity range, Rosario et al. 2018). As time passes, the galaxies will get older, the luminosity of the AGN will overwhelm
that of the SFR in the host (moving toward the bottom right region of Fig.4), removing gas and dust from the ISM and quenching the SFR and the accretion itself. The systems will then shine as a bright optical quasar (blue symbols in Fig.4), before turning into passive sources. To better constrain the dominant nature of star-bursts (mergers versus in-situ formation and evolution), much larger samples are required to provide a statistical description of the gas con-tent in this population and to understand the impact of the co-evolving obscured central ac-tivity. An important discriminating factor will be provided by future spatially resolved kine-matic studies of the stellar or gas components (JW ST , ALM A), currently available for just few sources (e.g.Silverman et al. 2018).
GR, CM, AR and AP acknowledge support from PRIN-SKA ESKAPE-HI (PI L.Hunt) and from the STARS@UniPD grant. GR and AL are supported by PRIN MIUR 2017 prot. 20173ML3WW 002 Opening the ALMA win-dow on the cosmic evolution of gas, stars and supermassive black holes. MP acknowledges support from the ESO Scientific Visitor Pro-gramme. GEM acknowledges support from the Villum Fonden research grant 13160, the Cosmic Dawn Center of Excellence, the ERC Consolidator Grant funding scheme (project ConTExt, grant number 648179). We thank Marcella Brusa for fruitful discussions.
REFERENCES Alexander, D. M., & Hickox, R. C. 2012, NewAR,
56, 93
Bergvall, N., Marquart, T., Way, M. J., et al. 2016, A&A, 587, A72
Berta, S., Lutz, D., Santini, P., et al. 2013, A&A, 551, A100
Berta, S., Lutz, D., Genzel, R., F¨orster-Schreiber, N. M., & Tacconi, L. J. 2016, A&A, 587, A73
Bianchini, F., Fabbian, G., Lapi, A., et al. 2018, arXiv:1806.06516
Bongiorno, A., Merloni, A., Brusa, M., et al. 2012, MNRAS, 427, 3103
Brusa, M., Fiore, F., Santini, P., et al. 2009, A&A, 507, 1277
Calabr`o, A., Daddi, E., Puglisi, A., et al. 2019, A&A, 623, A64
Capelo, P. R., Volonteri, M., Dotti, M., et al. 2015, MNRAS, 447, 2123
Chabrier, G. 2003, PASP, 115, 763
Cibinel, A., Daddi, E., Sargent, M. T., et al. 2018, arXiv:1809.00715
da Cunha, E., Charlot, S., & Elbaz, D. 2008, MNRAS, 388, 1595
Daddi, E., Dickinson, M., Morrison, G., et al. 2007, ApJ, 670, 156
Delvecchio, I., Gruppioni, C., Pozzi, F., et al. 2014, MNRAS, 439, 2736
Di Matteo, T., Springel, V., & Hernquist, L. 2005, Nature, 433, 604
Donley, J. L., Koekemoer, A. M., Brusa, M., et al. 2012, ApJ, 748, 142
Donley, J. L., Kartaltepe, J., Kocevski, D., et al. 2018, ApJ, 853, 63
Draine, B. T., & Li, A. 2007, ApJ, 657, 810 Eales, S. A., Smith, M. W. L., Wilson, C. D.,
et al. 2010, A&A, 518, L62
Feltre, A., Hatziminaoglou, E., Fritz, J., & Franceschini, A. 2012, MNRAS, 426, 120
Gruppioni, C., Berta, S., Spinoglio, L., et al. 2016, MNRAS, 458, 4297
Hopkins, P. F., Hernquist, L., Cox, T. J., & Kereˇs, D. 2008, ApJS, 175, 356
Kennicutt, Jr., R. C. 1998, ARA&A, 36, 189 Koss, M. J., Blecha, L., Bernhard, P., et al. 2018,
Nature, 563, 214
Laigle, C., McCracken, H. J., Ilbert, O., et al. 2016, ApJS, 224, 24
Lapi, A., Raimundo, S., Aversa, R., et al. 2014, ApJ, 782, 69
Lapi, A., Aversa, R., & Danese, L. 2016, in The Interplay between Local and Global Processes in Galaxies,, 7
Lapi, A., Pantoni, L., Zanisi, L., et al. 2018, ApJ, 857, 22
Lutz, D., Poglitsch, A., Altieri, B., et al. 2011, A&A, 532, A90
Magdis, G. E., Rigopoulou, D., Daddi, E., et al. 2017, A&A, 603, A93
Magdis, G. E., Daddi, E., B´ethermin, M., et al. 2012, ApJ, 760, 6
Magdis, G. E., Daddi, E., Sargent, M., et al. 2012, ApJL, 758, L9
Magdis, G. E., Rigopoulou, D., Huang, J.-S., et al. 2010, MNRAS, 401, 1521
Mancuso, C., Lapi, A., Shi, J., et al. 2016, ApJ, 833, 152
Marchesi, S., Lanzuisi, G., Civano, F., et al. 2016, ApJ, 830, 100
Mullaney, J. R., Daddi, E., B´ethermin, M. 2012, ApJL, 753, 30
Oliver, S. J., Bock, J., Altieri, B., et al. 2012, MNRAS, 424, 1614
Perna, M., Sargent, M. T., Brusa, M., et al. 2018, ArXiv e-prints, arXiv:1807.03378
Pierce, C. M., Lotz, J. M., Primack, J. R., et al. 2010, MNRAS, 405, 718
Puglisi, A., Daddi, E., Renzini, A., et al. 2017, ApJL, 838, L18
Rodighiero, G., Cimatti, A., Franceschini, A., et al. 2007, A&A, 470, 21
Rodighiero, G., Daddi, E., Baronchelli, I., et al. 2011, ApJL, 739, L40
Rodighiero, G., Brusa, M., Daddi, E., et al. 2015, ApJL, 800, L10
Rosario, D. J., Burtscher, L., Davies, R. I., et al. 2018, MNRAS, 473, 5658
Sanders, D. B., Soifer, B. T., Elias, J. H., et al. 1988, ApJ, 325, 74
Sargent, M. T., Daddi, E., B´ethermin, M., et al. 2014, ApJ, 793, 19
Scoville, N., Lee, N., Vanden Bout, P., et al. 2017, ApJ, 837, 150
Silverman, J. D., Daddi, E., Rodighiero, G., et al. 2015, ApJL, 812, L23
Silverman, J. D., Rujopakarn, W., Daddi, E., et al. 2018, ApJ, 867, 92
Speagle, J. S., Steinhardt, C. L., Capak, P. L., & Silverman, J. D. 2014, ApJS, 214, 15
Steinborn, L. K., Hirschmann, M., Dolag, K., et al. 2018, ArXiv e-prints, arXiv:1805.06902 Tacconi, L. J., Genzel, R., Saintonge, A., et al.
2018, ApJ, 853, 179
Wang, L., De Lucia, G., Fontanot, F., & Hirschmann, M. 2019, MNRAS, 482, 4454 Whitaker, K. E., van Dokkum, P. G., Brammer,
G., & Franx, M. 2012, ApJL, 754, L29 Yang, G., Brandt, W. N., Vito, F., et al. 2018,