Absence of flash-lag when judging global shape from local positions
Daniel Linares
*, Joan Lo´pez-Moliner
Grup Recerca Neurocie`ncia Cognitiva, Parc cientı´fic-Universitat de Barcelona, Spain Received 14 June 2006; received in revised form 5 October 2006
Abstract
When a flash is presented aligned with a moving stimulus, the former is perceived to lag behind the latter (the flash-lag effect). We
study whether this mislocalization occurs when a positional judgment is not required, but a veridical spatial relationship between moving
and flashed stimuli is needed to perceive a global shape. To do this, we used Glass patterns that are formed by pairs of correlated dots.
One dot of each pair was presented moving and, at a given moment, the other dot of each pair was flashed in order to build the Glass
pattern. If a flash-lag effect occurs between each pair of dots, we expect the best perception of the global shape to occur when the flashed
dots are presented before the moving dots arrive at the position that physically builds the Glass pattern. Contrary to this, we found that
the best detection of Glass patterns occurred for the situation of physical alignment. This result is not consistent with a low-level
con-tribution to the flash-lag effect.
! 2006 Elsevier Ltd. All rights reserved.
Keywords: Flash-lag effect; Glass pattern
1. Introduction
In view of the biological relevance of detecting moving
objects, neural mechanisms have been postulated so as to
reduce (
Whitney & Murakami, 1998; Whitney, Murakami,
& Cavanagh, 2000
) or correct (
Nijhawan, 1994
) the
inevi-table neural delays associated with their visual processing.
The flash-lag effect, in which a briefly flashed object
pre-sented aligned with a moving one in the retina is perceived
to lag behind it, has been suggested as the most convincing
evidence for the existence of such mechanisms (
Nijhawan,
1994; Whitney & Murakami, 1998; Whitney et al., 2000
),
although other alternative explanations have been
pro-posed (rev.
Krekelberg & Lappe, 2001; Nijhawan, 2002
).
It is still an open question where in the visual pathway
the mislocalization takes place, but some
neurophysiologi-cal studies suggest a low-level contribution of these special
mechanisms for the processing of moving stimuli that
could occur as early as in the retina (
Berry, Brivanlou,
Jor-dan, & Meister, 1999
) or LGN (
Orban, Hoffmann, &
Duy-sens, 1985
).
If there is a contribution of early visual areas to the
spa-tial mislocalization between moving and flashed stimuli,
then this mislocalization can be expected to occur at a
spa-tially local level and independently of the task. Here, we
test this prediction by performing a form detection task
in which a precise spatial local relationship between
mov-ing and flashed information is needed to perceive a global
shape.
Specifically, we used a concentric Glass pattern (
Glass,
1969
). Concentric Glass patterns consist of a large number
of pairs of dots. The first dot of each pair is positioned
ran-domly within the stimulus area. The position of the second
dot is determined by rotating the radial vector
correspond-ing to the first dot by a fixed amount. The pattern creates
the visual impression of a rotary visual structure (see
Fig. 1
). In our experiment one dot of each pair was flashed
while the other was presented in motion (all the moving
dots had the same direction). The best global form is
0042-6989/$ - see front matter ! 2006 Elsevier Ltd. All rights reserved. doi:10.1016/j.visres.2006.10.013
* Corresponding author. Present address: Hospital de Sant Joan de Deu,
Edifici Docent, C/ Santa Rosa, 39-57, planta 4a, 08950
Esplugues-Barcelona, Spain. Fax: +34 93 600 97 88. E-mail address:[email protected](D. Linares).
physically obtained when the flashed dots of each pair are
physically aligned (see inset of
Fig. 1
). However, if there is
a flash-lag effect for each pair then the best global form
should occur when the flashed dots are presented before
the moving dots arrive at the position of physical
align-ment. As in the flash-lag, this would be so because a
per-ceived (not physical) alignment would allow one to
recover the global shape. By varying the timing at which
the flashed dots were presented we explored when the best
performance was achieved in a global form detection task.
2. Methods
Stimuli were displayed on a 19 in. CRT monitor (Philips Brilliance 109P4) at a refresh rate of 100 Hz and viewed binocularly from a distance of 50 cm in a dimly lit room. The dots (size: 0.16 deg· 0.16 deg) were shown within a circular aperture with a diameter of 23 deg of visual angle on a dark background. Three observers participated in the experiment, the first author (D.L.) and two observers who were naı¨ve with respect to the purposes of the study (M.L., S.S.). Observers reported normal, or correct-ed to normal, visual acuity and color vision. Observers were instructcorrect-ed to maintain fixation on a cross presented at the center of the aperture. Observers were tested in two sessions for each of the conditions that will next be explained.
2.1. Moving dots condition
Each trial consisted of two successive intervals temporally separated by one second. The concentric Glass pattern was presented at random in either the first or the second interval. After each trial, the observer had to indicate which interval contained the concentric Glass pattern.
The interval that contained the concentric Glass pattern consisted of 400 dots (luminance 23 cd/m2) moving at 6 deg/s. All the dots moved in the same direction. The direction was chosen at random from all possible directions in the plane and so was the initial location of each dot within the circular aperture. When a moving dot reached the limit of the invisible aperture, then it appeared on the opposite site of the aperture. After 500 ms, another 400 dots (flashed dots, luminance 93 cd/m2) were
displayed for 10 ms to build the concentric Glass pattern (see Fig. 1).
The moving dots kept moving for 500 ms after the flashed dots were pre-sented and then disappeared. So each interval lasted for one second and the concentric Glass pattern was available just for one frame (10 ms). The luminance was measured with steady presentation of the dots. The luminance of the flashed dots was greater in order to equate the perceived luminance.
The concentric Glass pattern was built by presenting a flashed dot at a distance of 0.32 deg from each moving dot (distance between the centers) in a direction perpendicular to the radial vector corresponding to the mov-ing dot. The interval that did not contain the concentric Glass pattern was identical except that the direction between each moving dot and its asso-ciated flashed dot was chosen at random.
We have just described the situation of physical alignment: the flashed dots were displayed at the time relative to the position of the moving dots that allowed to built the concentric Glass pattern. We refer to this situa-tion as the one corresponding to a relative timing of zero. But in each trial we varied this relative timing in a way that sometimes the flashed dots were presented before the moving dots arrive at the position of physical align-ment (positive relative timings) and sometimes the flashed dots were pre-sented after (negative relative timings). We used 10 relative timings ranged from !100 to 120 ms. Each relative timing was sampled 20 times within a single session according to the method of constant stimuli.
2.2. Static dots condition
This condition was identical to the moving dots condition, except for the fact that the dots that we previously referred to as moving dots here remained still for one second. The relative positions between the fixed dot and the corresponding flashed dot matched those that we used in the moving dots condition. As before the flashed dots were presented for 10 ms. This condition was used to examine how much the shift of half of the dots blurred the Glass pattern in absence of motion. For the sake of clarity, we keep using the term ‘‘relative timing’’ although here it has only a spatial meaning. We used the same 10 relative timings as before and were sampled 20 times.
2.3. One-dot position judgment condition
Each trial consisted of a single dot moving at a 6 deg/s in a random direction for one second. The initial position was chosen randomly within the area of the circular aperture. When a moving dot reached the limit of Fig. 1. Representation of the stimulus in the moving dots condition for a relative timing of zero. In the real experiment the contrast was reversed (white dots on black background).
the aperture, it was replaced as in the moving dots condition. After 500 ms, another dot was flashed during 10 ms at a distance of 0.32 deg per-pendicularly to the direction of the motion of the moving dot. This situa-tion corresponded to a relative timing of zero, but in addisitua-tion to this value we used other values depending on whether the flashed dot was presented before (positive values) or after (negative values). In each trial, subjects had to judge the position of the moving object (behind or ahead) with respect to the flashed dot along the direction of the moving dot. In order for the psychometric functions to be saturated, we used different relative timings depending on the observer ranging from !150 to 300 ms. Each rel-ative timing was sampled 20 times.
2.4. Set-of-dots position judgment condition
This condition was similar to the one-dot position judgment condition. In this case, however, participants had to compare the spatial localization of two overlapped populations of dots: a moving population and a flashed population. The moving population consisted of 15 dots moving laterally
(all in the same direction) at a 6 deg/s. The direction (leftwards or right-wards) was constant within one session but changed between sessions. These dots were initially located randomly within a squared aperture (side of 3.95 deg). The density of the dots was the same as in the moving dots condition. The center of the aperture was located at a random position within a circular aperture of 12 deg of diameter relative to the fixation point. The dots moved for 500 ms, and then another 15 dots were flashed for 10 ms. The relative location between the dots of each pair was the same as in the one-dot position judgment condition. Participants were asked to report whether the flashed population appeared ahead or behind the mov-ing population.
2.5. Data analysis
The following model was fitted to the data points for the moving and the static dots conditions: pðcorrectÞ ¼ ðpmax! 0:5Þ % expð!ðx ! lÞ2=rÞþ
0:5 where pmaxstands for the maximum number of correct responses,land
rare the mean and deviation of the Gaussian, respectively.
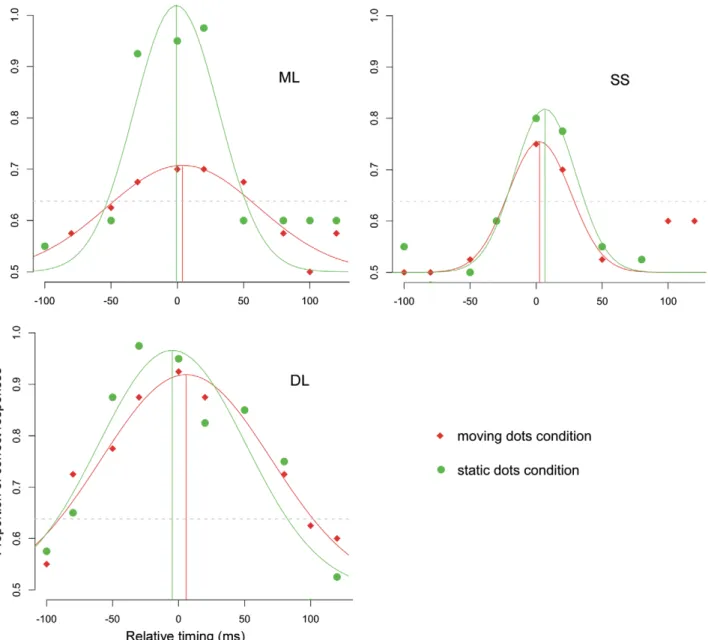
Fig. 2. Proportion of correct responses as a function of the relative timing for each observer. The distribution of solid circles corresponds to the static dots condition and the solid diamonds to the moving dots condition. The solid line denotes the best fit of a Gaussian curve scaled between 0.5 and 1. The horizontal dotted lines denote the upper limit of the chance performance interval according to a binomial distribution.
For the position judgment task, the set of data from each participant provided a distribution of the proportion of trials in which the moving dot is perceived behind the flashed dot as a function of the relative timing. We fitted a cumulative Gaussian to obtain the point of subjective equality (the mean of the distribution), which served as a measure of the flash-lag effect.
3. Results
Fig. 2
shows the percent of correct detection as a
func-tion of the relative timing for the moving dots condifunc-tion
and the static dots condition (individual results).
If a flash-lag effect occurs between each pair of dots,
then we expect the mean of the Gaussian for the moving
dots condition to be shifted to the right relative to the static
dots condition and this shift be significantly different from
zero. By eye analysis one can easily see that the means are
very close to the zero timing. We ran a parametric
boot-strap (
Efron & Tibshirani, 1993
) as conducted in
Kanai,
Sheth, and Shimojo (2004) and Lo´pez-Moliner and Linares
(2006)
for each participant and obtained the 95%
confi-dence intervals (CI) for the means of the two conditions.
For all participants the CI intervals completely overlapped
and always contained the zero.
For both conditions, the detection performance was
over chance not only for the zero relative timing, but
also for relative timings near zero. This means that for
small shifts of half of the dots the Glass pattern was
still available for detection. Larger shifts would be
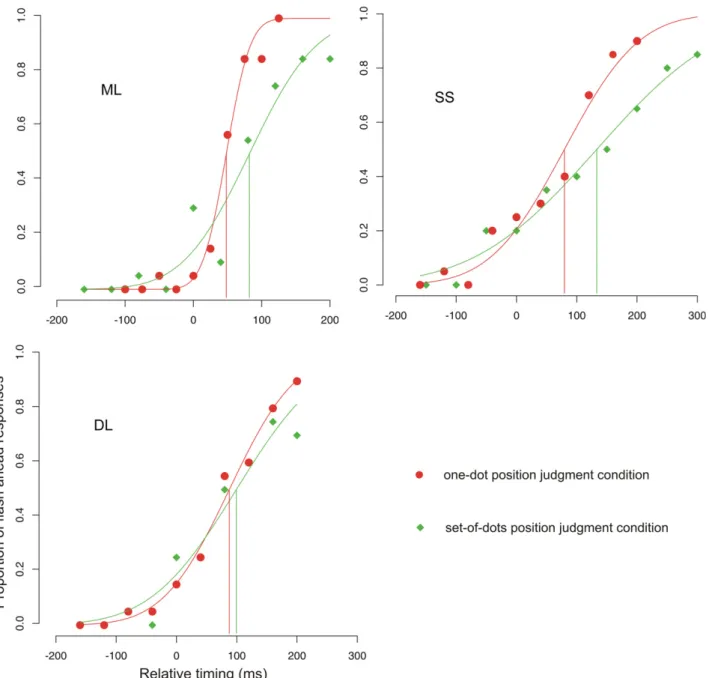
Fig. 3. Proportion of flash ahead responses as a function of the relative timing for each observer. The distribution of solid circles corresponds to the one-dot position judgment condition and the solid diamonds to the set-of-one-dots position judgment condition. The solid lines denote the best cumulative Gaussian curve.
necessary for the Glass pattern to get blurred.
Chung,
Kham, and Oh (2005)
actually showed that the effect
of shifting a small distance half of the dots in a circular
Glass pattern results in a shift of the focus of the Glass
pattern in a direction orthogonal to that in which the
dots were shifted. A small shift of focus could be
observed in our stimuli for small relative timings, for
which the global form can yet be often recovered.
How-ever, our naive subjects became aware of this shift only
when they were explicitly told to look at it in a set of
post-experiment trials.
The results of the position judgment tasks are
summa-rized in
Fig. 3
. For the position judgment task of a single
moving dot and its flashed partner, we found a mean
flash-lag effect of 72 ms (Observer ML: mean of 49 ms
and deviation of 30 ms; observer SS: mean of 80 ms and
deviation of 97 ms; observer DL: mean of 88 ms and
deviation of 86 ms). A significant flash-lag effect was also
found for the position judgment task between the two
populations of dots. The mean flash-lag effect was of
125 ms (Observer ML: mean of 82 ms and deviation
of 80 ms; observer SS: mean of 133 ms and deviation of
160 ms; observer DL: mean of 100 ms and deviation of
112 ms).
4. Discussion
Our results demonstrate that mislocalizations between
moving and flashed stimuli do not always happen.
Specifi-cally, we show that the local spatial relationships between
moving and flashed dots are preserved when they are used
to detect a global shape. This result is not consistent with a
low-level contribution to the flash-lag effect which would
predict a mislocalization in all situations, and suggests
the involvement of higher visual areas.
When the task, however, required reporting local
rela-tive positions between a single moving dot and its flashed
‘‘partner’’ a typical flash-lag was found. In order to explore
the position judgment task in a situation more similar to
that corresponding to the moving dots condition, the task
was also performed using sets of dots. In this case, a
signif-icant flash-lag effect was also found. Therefore, it seems
that a necessary condition for the flash-lag to appear is
the performance of a position judgment task.
Glass patterns (
Glass, 1969
) have been extensively used
to explore local and global stages of the visual form
path-way (
Wilson & Wilkinson, 1998
), as the visual system must
identify local orientation cues and combine them to extract
the global structure. It has been suggested that area V4
could be involved in the global stage of processing (
Wilson
& Wilkinson, 1998
) given that neurons in macaque V4 have
been reported to be selective for complex shapes similar to
Glass patterns, including radial, concentric and hyperbolic
gratings (
Gallant, Braun, & Van Essen, 1993
). Our finding
suggests that the spatial relationship between moving and
flashed information is maintained at this level. This
howev-er cannot be conclusive, as it has been shown that the
dis-tortions in the retinotopic map of V4 do not always
correspond to perceptual mislocalizations (
Sundberg,
Fal-lah, & Reynolds, 2006
).
The flash-lag illusion is a robust effect and, to our
knowledge, only one study has found a lack of
mislocaliza-tion between flashes and moving objects (
Kanai &
Verstra-ten, 2006
). Kanai and Verstraten found that when a ring
was flashed surrounding a moving disk, the percept
corre-sponding to the disk split in two: one disc was perceived
ahead of the flashed ring which reproduced the flash-lag
effect, but the other appeared just centered inside the
flashed ring showing no relative spatial mislocalization.
They also found that when the disc did not fill in
complete-ly the ring, oncomplete-ly the percept corresponding to the
mislocal-ized ring occurred. Therefore, they attributed the
perception of the veridical localization to a filling-in
pro-cess. In our case, as there is a spatial separation, though
small, between moving and flashed dots we think that
fill-ing-in might not be the cause. Anyway, these two sets of
results (Kanai and Verstraten and ours) show that
some-times the spatial relationship between moving and flashed
stimuli are preserved running counter to a low-level
expla-nation of the flash-lag effect.
Acknowledgments
We thank Eli Brenner, Ryota Kanai, and two
anony-mous reviewers for their comments and suggestions. This
research was supported in part by Grant
TINS2004-04363-C03-02 from the Ministerio de Educacion y Ciencia
of the Spanish government.
References
Berry, M. J., Brivanlou, I. H., Jordan, T., & Meister, M. (1999). Anticipation of moving stimuli by the retina. Nature.
Chung, C. S., Kham, K., & Oh, C. (2005). Bistable Glass-pattern motion reveals two different processes. Vision Research, 45, 2752–2758. Efron, B., & Tibshirani, R. J. (1993). An Introduction to the Bootstrap.
New York: Chapman and Hall.
Gallant, J. L., Braun, J., & Van Essen, D. C. (1993). Selectivity for polar, hyperbolic, and Cartesian gratings in macaque visual cortex. Science, 259, 100–103.
Glass, L. (1969). Moire´ effect from random dots. Nature, 223, 578–580. Kanai, R., Sheth, B. R., & Shimojo, S. (2004). Stopping the motion and
sleuthing the flash-lag effect: spatial uncertainty is the key to perceptual mislocalization. Vision Research, 44, 2605–2619.
Kanai, R., & Verstraten, F. A. (2006). Visual transients reveal the veridical position of a moving object. Perception, 35, 453–460.
Krekelberg, B., & Lappe, M. (2001). Neuronal latencies and the position of moving objects. Trends in Neurosciences, 24, 335–339.
Lo´pez-Moliner, J., & Linares, D. (2006). The flash-lag effect is reduced when the flash is perceived as a sensory consequence of our action. Vision Research, 46, 2122–2129.
Nijhawan, R. (1994). Motion extrapolation in catching. Nature, 370, 256–257.
Nijhawan, R. (2002). Neural delays, visual motion and the flash-lag effect. Trends in Cognitive Sciences, 6, 387–393.
Orban, G. A., Hoffmann, K. P., & Duysens, J. (1985). Velocity selectivity in the cat visual system. I. Response of LGN cells to moving bar
stimuli: a comparison with cortical areas 17 and 18. Journal of Neurophysiology, 54, 1026–1049.
Sundberg, K. A., Fallah, M., & Reynolds, J. H. (2006). A motion-dependent distortion of retinotopy in area V4. Neuron, 49, 656–657. Whitney, D., & Murakami, I. (1998). Latency difference, not spatial
extrapolation. Nature Neuroscience, 1, 656–657.
Whitney, D., Murakami, I., & Cavanagh, P. (2000). Illusory spatial offset of a flash relative to a moving stimulus is caused by differential latencies for moving and flashed stimuli. Vision Research, 40, 137–149. Wilson, H. R., & Wilkinson, F. (1998). Detection of global structure in Glass patterns: implications for form vision. Vision Research, 38, 2933–2947.