1
1H-NMR-based metabolomic analysis of the effect of moderate wine consumption
on subjects with cardiovascular risk factors
Rosa Vázquez-Fresno1*, Rafael Llorach1*,Francesca Alcaro 1
, Miguel Ángel Rodríguez2, Maria Vinaixa2, Gemma Chiva-Blanch3, Ramon Estruch3, Xavier Correig2,Cristina Andrés-Lacueva1
1
Nutrition and Food Science Department, XaRTA, INSA, Pharmacy Faculty, University of Barcelona, Av. Joan XXIII s/n, 08028 Barcelona, Spain. INGENIO-CONSOLIDER Program, Fun-c-food CSD2007-063, Ministry of Science and Innovation, Barcelona, Spain. 2Metabolomics Platform, CIBER de Diabetes y Enfermedades Metabólicas Asociadas (CIBERDEM), IISPV, Universitat Rovira i Virgili, Avda. Països Catalans 26, 43007 Tarragona, Spain. 3Department of Internal Medicine, Hospital Clinic, Institut d’Investigació Biomèdica August Pi i Sunyer (IDIBAPS), University of Barcelona, Villarroel 170, 08036 Barcelona, Spain. CIBER 06/03: Fisiopatología de la Obesidad y la Nutrición and RETIC 06/0045 Alimentación Saludable, Instituto de Salud Carlos III, Madrid, Spain.
*equal contribution Correspondance: Cristina Andrés-Lacueva, Nutrition and Food Science Department, Pharmacy Faculty, University of Barcelona, Av. Joan XXIII s/n, 08028 Barcelona, Spain.
E-mail: [email protected]. Fax: +34.934035931
ABSTRACT
Moderate wine consumption is associated with health-promoting activities. An H-NMR-based metabolomic approach was used to identify urinary metabolomic differences of moderate wine intake in the setting of a prospective, randomized, crossover and controlled trial. Sixty-one male volunteers with high cardiovascular risk factors followed three dietary interventions (28 days): dealcoholized red wine (RWD) (272ml/day, polyphenol-control), alcoholized red wine (RWA) (272ml/day) and gin (GIN) (100ml/day, alcohol-control). After each period, 24h-urine samples were collected and analyzed by 1H-NMR. According to the results of an one-way-ANOVA, significant markers were grouped in four categories: alcohol-related markers (ethanol); gin-related markers; wine-related markers; and gut microbiota markers (hippurate and 4-hydroxphenylacetic acid). Wine metabolites were classified into two groups; first, metabolites of food metabolome: tartrate (RWA and RWD), ethanol and mannitol (RWA); and second, biomarkers which relates to endogenous modifications after wine consumption, comprising branched-chain amino acid (BCAA) metabolite (3-methyl-oxovalerate). Additionally, a possible interaction between alcohol and gut-related biomarkers has been identified. To our knowledge, this is the first time that this approach has been applied in a nutritional intervention with red wine. The results show the capacity of this approach to obtain a comprehensive metabolome picture including food metabolome and endogenous biomarkers of moderate wine intake.
Abbreviations: BCAA, brached-chain amino acids; BAS, Basal; RWD, dealcoholized red wine; RWA, red wine alcoholized; δ, chemical shift; s, singlet; d,doublet; t, triplet; q, quadruplet; m, multiplet; Keywords: Biomarkers /Metabolomics/ Nuclear Magnetic Resonance / urinary profile / wine intake Total Number of words: 5.083
2
1 Introduction
Cardiovascular disease (CVD) is one of the main causes of mortality in western countries. Diet and lifestyle are recognized as the major modifiable risk factors in CVD [1]. The low incidence of coronary heart disease (CHD) in Mediterranean countries has been partly ascribed to the dietary habits of their inhabitants [2, 3]. As one of the mains components of Mediterranean diet, wine and its constituents, especially polyphenols, may provide additional health-promoting benefits [4] [5, 6]. Results of several clinical and epidemiological studies have showed the protective effect of a moderate wine consumption against CVD [7], particularly with regards to oxidative stress [8, 9], inflammation and vascular function [10-12], the main causes behind the development of CVD [13]. However, there are discrepancies on the effects of the different types of alcoholic drinks (wine, beer and liquors) on the cardiovascular system and whether the possible protective mechanisms of alcoholic beverages are due to their alcoholic component (ethanol), their non-alcoholic constituents, mainly polyphenols, or both [14, 15]. Therefore, new biomarkers of wine and alcohol consumption are needed in order to increase the knowledge on the effects of these beverages on the cardiovascular system and to clarify their protective mechanisms of CVD.
Foodomics is considered a new discipline that studies food and nutrition fields through advanced omics- technology application: genomic, transcriptomic, proteomic, and /or metabolomic [16] using sensitive methods (NMR, GC-MS, LC-MS, CE) to detect and quantify changes in dietary patterns [17]. 1 H-NMR-based metabolomics is a very robust technique for metabolomic applications enabling the simultaneous detection of a wide range of structurally different metabolites [18], and it can facilitate the discovery of new candidates for biomarkers of disease risk [19-21]. Similarly, NMR-based metabolomics can provide information, in combination with dietary intake, about the development of different diseases, as published by Vinaixa et al., who assessed the effect of dietary cholesterol on the progressive development of fatty liver disease [22]. As far as red wine polyphenol intake is concerned, van Dorsten et al. used a dry mix of red wine and red grape juice extracts to assess the metabolic fate of red wine polyphenols in humans by GS-MS and NMR-metabolomics [23]. Despite this use of extracts from red wine, as far we know, no reports on metabolomic studies using wine (as a beverage) in a nutritional intervention with either animals or humans are available.
As a result, the aim of the present study is to apply, for the first time to our knowledge, a 1H-NMR-based metabolomic strategy in order to investigate the effect of wine intake on the human metabolome in a urinary profile, identifying the most relevant markers of consumption and the endogenous effect of this beverage on human volunteers.
2 Material and Methods
2.1 Subjects and Study design
A total of 61 high-risk subjects aged ≥55 years without documented coronary heart disease (CHD: ischemic heart disease – angina/recent or past myocardial infarction/previous or cerebral vascular accident, peripheral vascular disease) were recruited for the study. The subjects included had diabetes mellitus or more than 3 of the following CHD risk factors: tobacco smoking, hypertension, hypercholesterolemia, plasma LDL cholesterol ≥160 mg/dl, plasma HDL cholesterol <40 mg/dl, obesity [BMI (in kg/m2) ≥30], and/or a family history of premature CHD (first-line male relatives < 55 years or females < 65 years). Participants had to voluntarily give signed informed consent. Subjects with a previous history of cardiovascular disease, any severe chronic disease, alcoholism or other toxic abuse were excluded. The study was a prospective, randomized, crossover and controlled trial. As a result of random computer-generated selection, participants were asked to take either, 272ml/day of red wine (hereafter, RWA) (about 30g ethanol/day), 272ml/day of dealcoholized red wine (hereafter, RWD, polyphenols control) or 100ml/day of gin (hereafter, GIN, alcohol control), every day for four weeks (28 days). 24-hour urine samples were collected on the last day of each period as well as the basal time. In order to evaluate the metabolic profiles, urine samples were analyzed by 1
H-NMR after each intake. All participants received all three interventions. Subjects had forbidden other alcoholic beverages 15-d before the first intervention and during the study, also asked not to change their dietary pattern during the study. A 7-d food record questionnaire was validated in our population [24]
3
monitoring nutrient intake at the beginning of the study and after each intervention, also a medical record and Minnesota Leisure Time Physical Activity Questionnaire validated in Spain [25] were performed. The wine used for the interventions (RWA and RWD) was elaborated with Merlot grape variety. The daily dose of alcohol was the same in both the RWA and GIN periods and the polyphenol composition of the wine is detailed in Table 1[26]. The total phenolic content of the 3 beverages was determined by the Folin-Ciocalteu method [27], the phenolic profile of RWA and RWD and resveratrol and piceid contents were measured by using HPLC-diode-array detection [28],[29].2.2 Sample Preparation
The urine samples were thawed, vortexed and centrifuged at 13200 rpm for 5 min. The supernatant (600 µl) from each urine sample was mixed with an internal standard solution [120 µL, consisting of 0.1% TSP (3-(trimethylsilyl)-proprionate-2,2,3,3-d4, chemical shift reference), 2 mM of sodium azide (NaN3, bacteriostatic agent), and 1.5M KH2PO4, in 99% deuterium water (D2O)]. The optimized pH of the buffer was set at 7.0, with a KOD solution, to minimize variations in the chemical shifts of the NMR resonances. This mixture was transferred to a 5 mm NMR tube.
2.3 1H-NMR Data Acquisition and Processing
The 1H-NMR spectra were acquired on a Varian-Inova-500 MHz NMR Spectrometer with presaturation of the water resonance using a NOESYPRESAT pulse sequence. During the acquisition, the internal temperature was kept constant at 298 K. An exponential window function was applied to the free induction decay (FID) with a line-broadening factor of 0.3 Hz prior to the Fourier transformation. For each sample, FIDs were collected into 32 K data points (128 scans) with a spectral width of 14 ppm, an acquisition time of 2 s, relaxation delay of 5 s, and a mixing time of 100 ms. NMR spectra were phased, baseline corrected and calibrated (TSP, 0.0ppm) using TopSpin software (version 3.0, Bruker). After baseline correction, two different approaches were subsequently used to summarize spectral data. On the one hand, original spectral data was bucketed in equal-size domains of 0.005 ppm [30-32] using ACD/NMR Processor 12.0 software (Advanced Chemistry Development, Inc.). On the other hand, intensities of each 1H-NMR region conveniently identified in the urine 1D-NMR spectra were integrated for each sample entering the study (profiling integration) using the AMIX 3.8 software package (Bruker, GmBH). In both cases, the spectral region between 4.68 and 5.08 ppm was excluded from the data set to avoid spectral interference from residual water.
2.4 Statistical analysis
Datasets derived from the two above-mentioned integrations were submitted to MetaboAnalyst, a web-based platform for comprehensive analysis of metabolomic data [33]. The two different matrices were row-wise normalized (rows were samples) by the sum of the intensities of the spectra [34] and column-wise normalized (columns were metabolites) using Pareto scaling [21] prior to being analyzed by ANOVA test. Fisher’s LSD test for multiple comparisons was applied as a post-hoc test; a p<0.05 was considered to indicate statistical significance. In addition, we performed a correlation test (Pearson’s correlation) [33] for verification when two or more signals came from the same metabolite. Correlation values close to 1 indicate a strong correlation, while values lower than 0.5 indicate a weak correlation, and values very close to 0 indicate no correlation.
2.5 Metabolite Identification
Metabolite identification was performed according to Chenomx NMR Suite 7.0 profiler (Chenomx Inc. Edmonton, Canada) by comparing NMR spectral data to those available in databases such as the Human
Metabolome Database (HMDB; www.hmdb.ca), the Biological Magnetic Resonance Data Bank (BMRB,
www.bmrb.wisc.edu), and the Madison Metabolomics Consortium Database (MMCD, mmcd.nmrfam.wisc.edu), along with the existing NMR-based metabolomics literature [35-37].
4
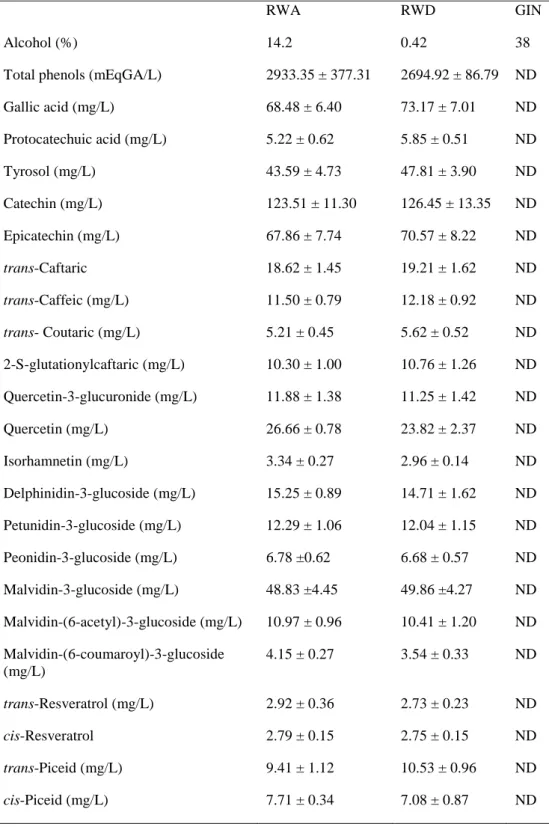
Table 1. Phenolic composition of beverages used in the study: RWA, RWD, and GIN (non significant
differences were found for any of the phenolic compounds between RWA and RWD (student's t test for independent samples). Mean ± SD.
RWA RWD GIN
Alcohol (%) 14.2 0.42 38
Total phenols (mEqGA/L) 2933.35 ± 377.31 2694.92 ± 86.79 ND
Gallic acid (mg/L) 68.48 ± 6.40 73.17 ± 7.01 ND Protocatechuic acid (mg/L) 5.22 ± 0.62 5.85 ± 0.51 ND Tyrosol (mg/L) 43.59 ± 4.73 47.81 ± 3.90 ND Catechin (mg/L) 123.51 ± 11.30 126.45 ± 13.35 ND Epicatechin (mg/L) 67.86 ± 7.74 70.57 ± 8.22 ND trans-Caftaric 18.62 ± 1.45 19.21 ± 1.62 ND trans-Caffeic (mg/L) 11.50 ± 0.79 12.18 ± 0.92 ND trans- Coutaric (mg/L) 5.21 ± 0.45 5.62 ± 0.52 ND 2-S-glutationylcaftaric (mg/L) 10.30 ± 1.00 10.76 ± 1.26 ND Quercetin-3-glucuronide (mg/L) 11.88 ± 1.38 11.25 ± 1.42 ND Quercetin (mg/L) 26.66 ± 0.78 23.82 ± 2.37 ND Isorhamnetin (mg/L) 3.34 ± 0.27 2.96 ± 0.14 ND Delphinidin-3-glucoside (mg/L) 15.25 ± 0.89 14.71 ± 1.62 ND Petunidin-3-glucoside (mg/L) 12.29 ± 1.06 12.04 ± 1.15 ND Peonidin-3-glucoside (mg/L) 6.78 ±0.62 6.68 ± 0.57 ND Malvidin-3-glucoside (mg/L) 48.83 ±4.45 49.86 ±4.27 ND Malvidin-(6-acetyl)-3-glucoside (mg/L) 10.97 ± 0.96 10.41 ± 1.20 ND Malvidin-(6-coumaroyl)-3-glucoside (mg/L) 4.15 ± 0.27 3.54 ± 0.33 ND trans-Resveratrol (mg/L) 2.92 ± 0.36 2.73 ± 0.23 ND cis-Resveratrol 2.79 ± 0.15 2.75 ± 0.15 ND trans-Piceid (mg/L) 9.41 ± 1.12 10.53 ± 0.96 ND cis-Piceid (mg/L) 7.71 ± 0.34 7.08 ± 0.87 ND
5
3 Results and discussions
The total phenolic content of the 3 beverages used in this study, the phenolic profile of RWA and RWD and resveratrol and piceid content are presented in table 1. 1H- NMR resonance assignments with chemical shifts and multiplicity of the signals elucidated in 1H- NMR spectra of urine of the participants are shown in Table 2. Results performed by multivariate techniques were no consistent and difficult to interpret so we choose ANOVA test to analyze selected NMR signals to determine statistical differences between interventions of the individuals [38, 39]. ANOVA test is effective determining whether a given set of NMR signals contains interesting information. The significant bins returned by the ANOVA test (p<0.05) for both techniques are shown in Table 3. Results showed that significant bins from the two above-mentioned integrations were in consonance. The box plots with the Fisher’s LSD test for multiple comparisons are shown in Fig. 1. Additionally, in order to present an overview of the whole representative spectrum, the significant metabolites of each spectrum in basal and the three dietary interventions are shown (Fig. 2).Identified markers were grouped in four categories, namely: alcohol-related markers; gin-related markers; wine-related markers; gut microbiota markers.
Table 2. 1H-NMR resonance assignments with chemical shifts for signals identified in samples of human urine.
Code Metabolite δ (H1 shift) ppm Multiplicity
1 Acetate 1.93 s 2 Acetoacetate 2.27 s 3 Acetone 2.24 s 4 cis-Aconitate 3.11; 5.75 s; s 5 Acetylcarnitine 2.15 s 6 Alanine 1.49 d 7 Betaine 3.27 s 8 Carnitine 3.23 s 9 Citrate 2,68 + 2,55 d + d 10 Creatine 3,94, 3,04 s; s 11 Creatinine 3,06; 4.06 s; s 12 Dimethylamine (DMA) 2.72 s 13 Ethanol 1.19; 3.69 t; q 14 Formate 8.46 s 15 Fucose 5.20 d 16 Glycine 3.57 s 17 Glycylproline 3.94 s 18 Glucose 3.50; 4.66; 5.25; m; d; d 19 Hippurate 3.98; 7.57; 7.64; 7.84; d; tt; t; dd 20 Histidine 7.08 s 21 2-Hydroxyisobutyrate 1.36 s 22 3-Hydroxyisovalerate 1.26 s 23 3-hydroxymandelate 6.82 s 24 4-Hydroxyphenylacetate 6.87 d 25 Indole-3-acetate 7.51 d 26 Lactate 1.33 d
6
Table 2. continued
Code Metabolite δ (H1 shift) ppm Multiplicity
27 Leucine 0,96 t 28 Lysine 1.73 m 29 Malonate 3.12 s 30 Mannitol 3.69; 3.77; 3.80, 3.87 dd; m; d; dd 31 n-Methylhistidine 7.09 s 32 1-Methylnicotinamide 4.47 s 33 Methylsuccinate 1.07 d 34 3-Methyl-2-oxovalerate 1.10 d 35 N-N Dimethylglycine (DMG) 2.93 s 36 Tartrate 4.35 s 37 N-Phenylacetylglycine (PAG) 7.35; 7.43; m; m 38 Succinate 2.41 s 39 Taurine 3.43; 3.26 t; t 40 Trigonelline 4.43; 8.08; 8.85; 9.13; s; m; m; s 41 Trimethylamine (TMA) 2.89 s 42 Trimethylamine-N-oxide (TMAO) 3.27 s 43 Threonine 1.33 d 44 Tyrosine 6.90 d 45 Urea 5.75-5.90 m 46 Valine 0,98; 1,05 d; d
s, singlet; d, doublet; dd: double doublet; t, triplet; tt: double triplet; q: quadruplet; m, multiplet.
Alcohol-related markers: A significant presence of ethanol (δ 1.19 (t), and δ 3.69 (q)) was detected in the
urine of participants after RWA and GIN consumption, which suggests that this presence may correspond to the ethanol from the beverage (both gin and red wine). In fact, ethanol has been found in wine by NMR [40]. With regard to human samples, ethanol has been identified in the urine of healthy Caucasian volunteers who, after two days of abstinence from alcoholic beverages, consumed sake and rice wine [41]. The presence of ethanol in urine was recently used as an indicator of non-compliance of dietary protocol in a metabolomic experiment in which alcohol intake was forbidden [42]. In our case, we view the presence of ethanol in the interventions that has the alcoholic component in the dietary protocol (RWA and GIN), concluding that the identified ethanol could be considered as a biomarker of the overall compliance of dietary interventions.
Gin-related markers: Two correlating signals (δ2.13(s) and 5.69 (s), fig. 3A) were excreted in statistically
higher concentrations after GIN intake. These two signals are also present in some volunteers in basal time and after a RWA or RWD period, without a clear pattern in terms of volunteers and interventions followed. This behaviour indicates either possible gin compound or an endogenous compound because not all gin volunteers presented these peaks in their urinary metabolome. Querying to the NMR database failed to confirm the assignation of these signals. However, the δ2.13 peak could suggest the presence of acetylcholine or acetylcarnitine, but this hypothesis could not be confirmed by comparing the sample with a urine sample spiked with commercial standards, so it has been rejected. Therefore, we have not been able to identify these two correlated signals and they have been termed as “unknown 1”.
7
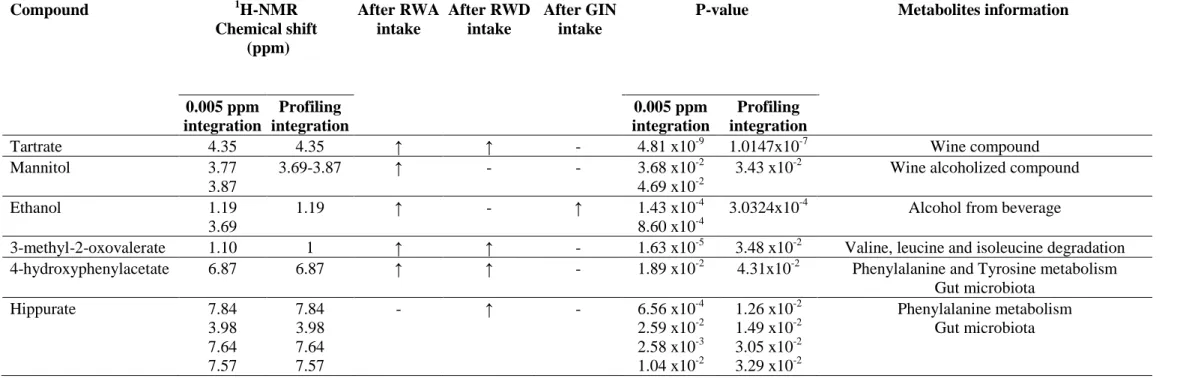
Table 3: Metabolites detected after the three treatments. P-values of each metabolite (p<0.05; ANOVA).
- :No changes Compound 1H-NMR Chemical shift (ppm) After RWA intake After RWD intake After GIN intake
P-value Metabolites information
0.005 ppm integration Profiling integration 0.005 ppm integration Profiling integration
Tartrate 4.35 4.35 ↑ ↑ - 4.81 x10⁻⁹ 1.0147x10⁻⁷ Wine compound
Mannitol 3.77
3.87
3.69-3.87 ↑ - - 3.68 x10⁻²
4.69 x10⁻²
3.43 x10⁻² Wine alcoholized compound
Ethanol 1.19
3.69
1.19 ↑ - ↑ 1.43 x10⁻⁴
8.60 x10⁻⁴
3.0324x10⁻⁴ Alcohol from beverage
3-methyl-2-oxovalerate 1.10 1 ↑ ↑ - 1.63 x10⁻⁵ 3.48 x10⁻² Valine, leucine and isoleucine degradation 4-hydroxyphenylacetate 6.87 6.87 ↑ ↑ - 1.89 x10⁻² 4.31x10⁻² Phenylalanine and Tyrosine metabolism
Gut microbiota Hippurate 7.84 3.98 7.64 7.57 7.84 3.98 7.64 7.57 - ↑ - 6.56 x10⁻⁴ 2.59 x10⁻² 2.58 x10⁻³ 1.04 x10⁻² 1.26 x10⁻² 1.49 x10⁻² 3.05 x10⁻² 3.29 x10⁻² Phenylalanine metabolism Gut microbiota
8
Figure 1. Box plots of the intensities of significant metabolites. ***P<0.00001; **P<0.005; *P<0.05.
Different letters indicate significant differences between interventions. BAS (basal time); RWA (red wine), RWD (dealcoholized red wine) and GIN (Gin).
Wine-related markers: This group comprises those markers related to the intake of red wine (RWA and/or
RWD). With regards to these two classes of wine (RWA and RWD) intake, a chemical shift at 4.35 ppm (s), corresponding to tartrate, was detected. The box plot in figure 1 shows the significant differences between the wine, basal and gin periods, with no differences between wines. Tartaric acid is the major acid in grapes and so it is also present in wine [40, 43]. Lord et al. tested the frequent ingestion of grape juice (28mL) in a human population producing urinary tartrate concentrations >300g/mg creatinine [44]. Dietary sources strongly influence the concentration of urinary tartrate, and its production by intestinal yeast or bacteria is insignificant because the majority of tartaric acid is destroyed by microbial action [45, 46], indicating that the urinary tartrate in our samples was provided by the wine composition. In addition, Yamashita et al. demonstrated that tartaric acid has the beneficial effect of enhancing the bioavailability of wine polyphenols [47].
In this context, an endogenous product of the degradation of branched-chain amino acids (BCAA) termed 3-methyl-2-oxovalerate (δ1.10, d) was identified in urines after the intake of RWA and RWD (Fig. 1, Table 2). This identification was confirmed by spiking urine samples with the commercial standard. According to the results obtained, Connor et al. found an increase in urinary levels of the branched-chain amino acid valine and its metabolite 3-methyl-2-oxovalerate in diabetic mice [48]. Moreover, it was discovered that cardiovascular subjects such as diabetic [48, 49] and obese subjects [50, 51] have elevated plasma levels of BCAAs [52], because of the reduction in BCAA catabolism. The first step in the catabolism of BCAAs is a reversible step and is carried out in the brain and several non-hepatic tissues by branched-chain aminotransferase (BCAT) to convert BCAAs into branched-chain alpha ketoacids (BCKAs) such as
3-9
methyl-2-oxovalerate. Our results show an increase in 3-methyl-2-oxovalerate in urine as a result of the first step of BCAA catabolism, suggesting a possible up-regulation of this pathway carried out by BCAT enzyme after RWA and RWD intake.
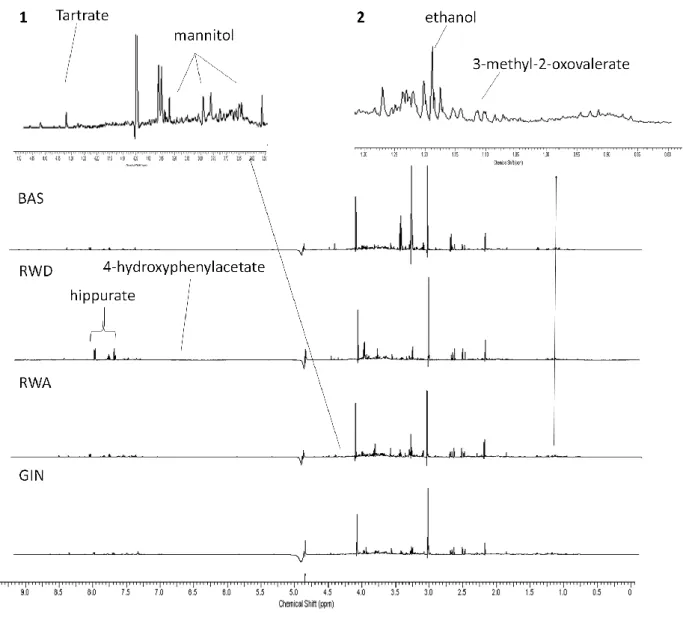
Figure 2. Representative 500MHz 1H-NMR region of spectra in basal time (BAS), RWD (dealcoholized red wine); RWA (red wine), GIN (gin). The figure exhibits the significant metabolites in ANOVA test. Zoomed regions are performed. Spectral area zoomed between 3.55 and 4.50 ppm (1); 0.80-1.30 ppm interval area (2).
In the aliphatic region comprising 0.85 to 1.24 ppm, where 3-methyl-2-oxovalerate is also present, there were statistical differences between wine intake (RWA and RWD) and basal or gin treatment. An increase in several signals in this region (see nomenclature in figure 3B: unknown 2: δ0.85 (s) unknown 3: δ0.92 (s), unknown 4: δ1.15 (d); unknown 5: δ1.24 (d+d)) was detected after wine consumption, with a good
10
correlation between them and with 3-methyl-2-oxovalerate (Fig. 3B). The identification of these unassigned signals (overall the 0.80-1.00ppm region) was hampered by their low signal intensities, a broad band signal area, and the absence of other resonance patterns.
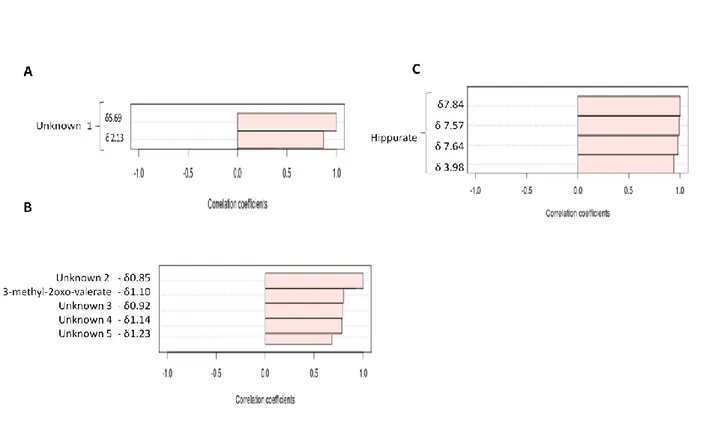
Figure 3. Correlation plot from integration bucketing corresponding to signals of unknown 1 (A); Aliphatic
region metabolites, 0.84-0.86: unknown 2; 1.09-1.11: methyl-2-oxovalerate; 0.90-0.92: unknown 3; 1.13-1.15: unknown 4; 1.23-1.24: unknown 5 (B); and Hippurate (C). Correlation coefficient >0.5, for all the figures. The compounds are represented as horizontal bars. Light pink color indicates positive correlations.
With regard to RWA intake, mannitol (δ3.78, dd) showed a significant increase in the sugar region. Mannitol is a polyol produced by heterofermentative lactic acid bacteria from the reduction of fructose [53] and is present in wine. Liu et al. tested mannitol concentration in different wines and fruit juices, finding higher values in Cabernet Sauvignon, a red wine from the same family as Merlot (the wine used in this study) [54], than in sweet white, medium-dry white or Pinot noir wine. The presence of this polyol in urine samples after RWA intake could be explained by the fact that it is largely eliminated from the body before any metabolism can take place [55], and the absence after RWD intake suggests a possible elimination of this compound during the process of dealcoholization.
11
Gut microbiota markers: In samples from the RWD intake period, the intensity signals of hippurate (δ3.98
(d), δ7.57 (tt), δ 7.64 (t), δ7.84 (dd), Fig. 3C) increased in comparison with GIN and basal time. An interesting significant difference was observed between RWA and RWD (Fig.1 and table 3). Hippurate is a metabolite belonging to the phenylalanine and tyrosine degradation pathways and it has also been related to polyphenol microbiota catabolism. There have been several studies in rats and humans showing an increase in hippurate excretion after wine polyphenol consumption [56, 57]. Another gut microbiota metabolite, 4-hydroxyphenylacetate (δ6.87), showed an effect of wine intake, with no significant differences between RWD and RWA; however, it did show significantly higher levels after RWD intake compared to the GIN and basal period. This metabolite has been identified in urine and faeces [32, 56] after consumption of polyphenolic compounds in wine [57, 58], it could explain no differences in these results between wines (RWD and RWA) in the current results. In addition, this metabolite is also related to tyrosine metabolism. An interesting result was that no significant differences between the alcohol-containing diets (RWA and GIN) were detected (Fig. 1, Table 3).
The two markers related to gut microbiota showed a similar behavior (Fig. 1); however, slight differences were observed. The similarities were found in relation to the influence of alcohol intake where for both metabolites RWA and GIN showed no significant difference. This fact suggests a possible impact of ethanol on the metabolic pathways related to the production of both compounds, probably modifying the relationship between microbiota and human metabolism. A recent study conducted by Gao et al. [59] compared urine from Wistar and Spraguel-Dawley rats after ethanol administration. The authors demonstrated a different excretion pattern in some metabolites affected by alcohol intake. Concretely, hippurate showed less excretion after ethanol administration, and in another hand, excretion of 4-hydroxyphenylacetate increased with alcohol administration. With regard to differences in the present results, while hippurate content was significantly different when comparing RWA and RWD, the amount of 4-hydroxyphenylacetic acid did not differ significantly between wine diets (RWA and RWD). This behavior could be explained because 4-hydroxyphenylacetate is a compound increased with wine consumption, counteracting with the effect of alcohol administration. As a result, no differences between wines (RWD and RWA) (Fig. 1, Table 2) and between alcohol containing beverages (RWA and GIN) were observed. Hippurate could arise from different sources, such as diet (mainly polyphenols), oxidative stress, and intestinal microbiota [20]. In contrast, in the case of 4-hydroxyphenylacetic acid, this behaviour (no differences between wine diets) suggests that an important part of this compound should be associated with wine intake from the intervention.
4 Concluding remarks
The results of the current work show the capability of an NMR-based metabolomic approach to detect significant changes in metabolites after moderate wine consumption. Wine-related biomarkers may be classified into two groups. The first group comprises those metabolites coming from the metabolism of food components (food metabolome), where mannitol is related to an RWA diet, and tartrate is a biomarker of wine intake (RWA and RWD). These results support the notion that this compound (tartrate) could be considered to be a possible marker of wine intake. The second group comprises those markers related to endogenous modifications after wine consumption: BCAA metabolites and other signals in the same spectral area. In spite of this, more about BCAAs and wine intake needs to be known in order to understand the connection between the catabolic pathway of BCAA and moderate wine intake.
Despite these biomarkers, ethanol was a robust biomarker of alcohol consumption as it was related to GIN and RWA diets. In fact, combining tartrate and ethanol we observed a global compliance of dietary intervention, important factor in metabolomics studies that other authors also has been investigated [60]. Finally, the gut microbiota metabolites, 4-hydroxyphenylacetate and hippurate, showed a particular effect in combination with alcohol, providing new insights into the assimilation of polyphenol metabolites.
One of the main limitations of our study is that there we no washout periods between interventions. Washout periods between interventions would have extended the study 6 week more, which would have made it difficult to ensure compliance and any increase in study length may increase participant dropout rate [61]. Previous studies carried out at the Hospital Clinic of Barcelona confirmed that changes in cellular and
12
endothelial adhesion molecules due to the intervention were already observed after 15 days of treatment [62, 63], and no carryover effect was observed, the absence of a washout period would probably not have changed the results. Therefore the results observed at the end of the 4-week period could be attributed to the intervention and should only be compared with those observed at the end of the other interventions.
In conclusion, to our knowledge, this is the first time that this approach has been applied in a nutritional intervention with red wine. The results showed that H-NMR-based metabolomics is a powerful strategy for obtaining biomarkers in nutritional intervention studies. In fact, the results obtained generate new perspectives on understanding the relationship between moderate wine intake and human health.
ACKNOWLEDGEMENTS
This research was supported by Spanish National Grants: CICYT-AGL 2006-14228-C03-02 (Spanish Ministry of Education and Science), as well as AGL2009-13906-C02-01, AGL2010-10084-E and the CONSOLIDER INGENIO 2010 Programme, FUN-C-FOOD (CSD2007-063) from the MICINN, Spain. R.Vazquez-Fresno would like to thank the FPI fellowship from the Spanish Ministry of Science and Innovation (MICINN). R. Llorach would like to thank MICINN and the European Social Funds for their financial contribution to the R. Llorach Ramón y Cajal contract (Ramon y Cajal Programme, MICINN-RYC). F.Alcaro was supported by the Leonardo da Vinci Programme 2010, the European Commission's Lifelong Learning Programme. We thank the participants for their collaboration in the Study. Torres SA provided the red wine and dealcoholized red wine used in the study, and Gin Xoriguer provided the gin used in the study.
The authors have declared no conflict of interest.
5 References
[1] Leifert, W. R., Abeywardena, M. Y., Nutr Res 2008, 28, 729-737.
[2] Joshipura, K. J., Hu, F. B., Manson, J. E., Stampfer, M. J., Rimm, E. B., Speizer, F. E., Colditz, G., Ascherio, A., Rosner, B., Spiegelman, D., Willett, W. C., Ann Intern Med 2001, 134, 1106-1114.
[3] Dauchet, L., Amouyel, P., Dallongeville, J., Medscape, Nat Rev Cardiol 2009, 6, 599-608. [4] Estruch, R., Food Research International 2000, 33, 219-226.
[5] Zamora-Ros, R., Urpí-Sardà, M., Lamuela-Raventós, R. M., Estruch, R., Martínez-González, M. A., Bulló, M., Arós, F., Cherubini, A., Andres-Lacueva, C., Free Radic Biol Med 2009, 46, 1562-1566.
[6] Lindberg, M. L., Amsterdam, E. A., Clin Cardiol 2008, 31, 347-351. [7] Renaud, S., de Lorgeril, M., Lancet 1992, 339, 1523-1526.
[8] Estruch, R., Sacanella, E., Mota, F., Chiva-Blanch, G., Antúnez, E., Casals, E., Deulofeu, R., Rotilio, D., Andres-Lacueva, C., Lamuela-Raventos, R. M., de Gaetano, G., Urbano-Marquez, A., Nutr Metab
Cardiovasc Dis 2011, 21, 46-53.
[9] Tian, L., Wang, H., Abdallah, A. M., Prinyawiwatkul, W., Xu, Z., J Agric Food Chem 2011, 59, 6453-6458.
[10] Botden, I. P., Langendonk, J. G., Meima, M. E., Boomsma, F., Seynhaeve, A. L., ten Hagen, T. L., Jan Danser, A. H., Sijbrands, E. J., Am J Hypertens 2011, 24, 162-168.
[11] Vazquez-Prieto, M. A., Renna, N. F., Diez, E. R., Cacciamani, V., Lembo, C., Miatello, R. M., Am J
Hypertens 2011, 24, 234-240.
[12] Huang, P.-H., Chen, Y.-H., Tsai, H.-Y., Chen, J.-S., Wu, T.-C., Lin, F.-Y., Sata, M., CHen, J.-W., Lin, S.-J., Artheriosclerosis, Thrombosis, and Vascular Biology 2010, 30, 869-877.
[13] Mukamal, K., Conigrave, K. M., A, M. M., The New England Jornal of Medicine 2003, 348, 109-118. [14] Beulens, J. W., Algra, A., Soedamah-Muthu, S. S., Visseren, F. L., Grobbee, D. E., van der Graaf, Y., Group, S. S., Atherosclerosis 2010, 212, 281-286.
13
[15] Spaak, J., Tomlinson, G., McGowan, C. L., Soleas, G. J., Morris, B. L., Picton, P., Notarius, C. F., Floras, J. S., Am J Physiol Heart Circ Physiol 2010, 298, H2226-2231.
[16] Herrero, M., Simó, C., García-Cañas, V., Ibáñez, E., Cifuentes, A., Mass Spectrom Rev 2011. [17] Puiggròs, F., Solà, R., Bladé, C., Salvadó, M. J., Arola, L., J Chromatogr A 2011, 1218, 7399-7414. [18] Beckonert, O., Keun, H. C., Ebbels, T. M., Bundy, J., Holmes, E., Lindon, J. C., Nicholson, J. K., Nat
Protoc 2007, 2, 2692-2703.
[19] Holmes, E., Loo, R. L., Stamler, J., Bictash, M., Yap, I. K., Chan, Q., Ebbels, T., De Iorio, M., Brown, I. J., Veselkov, K. A., Daviglus, M. L., Kesteloot, H., Ueshima, H., Zhao, L., Nicholson, J. K., Elliott, P.,
Nature 2008, 453, 396-400.
[20] Carrola, J., Rocha, C. M., Barros, A. S., Gil, A. M., Goodfellow, B. J., Carreira, I. M., Bernardo, J., Gomes, A., Sousa, V., Carvalho, L., Duarte, I. F., J Proteome Res 2011, 10, 221-230.
[21] Kang, S. M., Park, J. C., Shin, M. J., Lee, H., Oh, J., Ryu, d. H., Hwang, G. S., Chung, J. H., Clin
Biochem 2011, 44, 293-299.
[22] Vinaixa, M., Rodríguez, M. A., Rull, A., Beltrán, R., Bladé, C., Brezmes, J., Cañellas, N., Joven, J., Correig, X., J Proteome Res 2010, 9, 2527-2538.
[23] van Dorsten, F. A., Grün, C. H., van Velzen, E. J., Jacobs, D. M., Draijer, R., van Duynhoven, J. P., Mol
Nutr Food Res 2010, 54, 897-908.
[24] Schröder, H., Covas, M. I., Marrugat, J., Vila, J., Pena, A., Alcántara, M., Masiá, R., Clin Nutr 2001, 20, 429-437.
[25] Elosua, R., Marrugat, J., Molina, L., Pons, S., Pujol, E., Am J Epidemiol 1994, 139, 1197-1209.
[26] Chiva-Blanch, G., Urpi-Sarda, M., Llorach, R., Rotches-Ribalta, M., Guillén, M., Casas, R., Arranz, S., Valderas-Martinez, P., Portoles, O., Corella, D., Tinahones, F., Lamuela-Raventos, R. M., Andres-Lacueva, C., Estruch, R., Am J Clin Nutr 2011.
[27] Singleton, V., Rossi, J., American Journal of Enology and Viticulture 1965, 16, 144-158.
[28] Ibern-Gomez, M., Andres-Lacueva, C., Lamuela-Raventos, R., Waterhouse, A., American Journal of
Enology and Viticulture 2002, 53, 218-227.
[29] Romero-Pérez, A. I., Ibern-Gómez, M., Lamuela-Raventós, R. M., de La Torre-Boronat, M. C., J Agric
Food Chem 1999, 47, 1533-1536.
[30] Yap, I. K., Brown, I. J., Chan, Q., Wijeyesekera, A., Garcia-Perez, I., Bictash, M., Loo, R. L., Chadeau-Hyam, M., Ebbels, T., De Iorio, M., Maibaum, E., Zhao, L., Kesteloot, H., Daviglus, M. L., Stamler, J., Nicholson, J. K., Elliott, P., Holmes, E., J Proteome Res 2010, 9, 6647-6654.
[31] Zhao, L., Liu, X., Xie, L., Gao, H., Lin, D., Anal Sci 2010, 26, 1277-1282.
[32] Jacobs, D. M., Deltimple, N., van Velzen, E., van Dorsten, F. A., Bingham, M., Vaughan, E. E., van Duynhoven, J., NMR Biomed 2008, 21, 615-626.
[33] Xia, J., Wishart, D. S., Nat Protoc 2011, 6, 743-760.
[34] Rezzi, S., Martin, F. P., Alonso, C., Guilarte, M., Vicario, M., Ramos, L., Martínez, C., Lobo, B., Saperas, E., Malagelada, J. R., Santos, J., Kochhar, S., J Proteome Res 2009, 8, 4799-4809.
[35] Saude, E., BD, S., Metabolomics 2007, 3, 19-27.
[36] Mi Park, E., Lee, E., Jin Joo, H., Oh, E., Lee, J., Lee, J. S., Clin Chem Lab Med 2009, 47, 188-194. [37] Zuppi, C., Messana, I., Forni, F., Rossi, C., Pennacchietti, L., Ferrari, F., Giardina, B., Clin Chim Acta 1997, 265, 85-97.
[38] Le Gall, G., Colquhoun, I. J., Davis, A. L., Collins, G. J., Verhoeyen, M. E., J Agric Food Chem 2003,
51, 2447-2456.
[39] Le Gall, G., Colquhoun, I. J., Defernez, M., Journal of Agricultural and Food Chemistry 2004, 52, 692-700.
[40] Son, H. S., Hwang, G. S., Kim, K. M., Ahn, H. J., Park, W. M., Van Den Berg, F., Hong, Y. S., Lee, C. H., J Agric Food Chem 2009, 57, 1481-1490.
[41] Teague, C., Holmes, E., Maibaum, E., Nicholson, J., Tang, H., Chan, Q., Elliott, P., Stamler, J., Ueshima, H., Zhou, B., Wilson, I., Analyst 2004, 129, 259-264.
[42] Edmands, W. M., Beckonert, O. P., Stella, C., Campbell, A., Lake, B. G., Lindon, J. C., Holmes, E., Gooderham, N. J., J Proteome Res 2011, 10, 4513-4521.
[43] Son, H. S., Kim, K. M., van den Berg, F., Hwang, G. S., Park, W. M., Lee, C. H., Hong, Y. S., J Agric
Food Chem 2008, 56, 8007-8016.
14
[45] Fonseca, A., Can J Microbiol 1992, 38, 1242-1251.[46] Fonseca, A., Fell, J. W., Kurtzman, C. P., Spencer-Martins, I., Int J Syst Evol Microbiol 2000, 50 Pt 1, 389-394.
[47] Yamashita, S., Sakane, T., Harada, M., Sugiura, N., Koda, H., Kiso, Y., Sezaki, H., Ann N Y Acad Sci 2002, 957, 325-328.
[48] Connor, S. C., Hansen, M. K., Corner, A., Smith, R. F., Ryan, T. E., Mol Biosyst 2010, 6, 909-921. [49] Wijekoon, E. P., Skinner, C., Brosnan, M. E., Brosnan, J. T., Can J Physiol Pharmacol 2004, 82, 506-514.
[50] Newgard, C. B., An, J., Bain, J. R., Muehlbauer, M. J., Stevens, R. D., Lien, L. F., Haqq, A. M., Shah, S. H., Arlotto, M., Slentz, C. A., Rochon, J., Gallup, D., Ilkayeva, O., Wenner, B. R., Yancy, W. S., Eisenson, H., Musante, G., Surwit, R. S., Millington, D. S., Butler, M. D., Svetkey, L. P., Cell Metab 2009,
9, 311-326.
[51] She, P., Van Horn, C., Reid, T., Hutson, S. M., Cooney, R. N., Lynch, C. J., Am J Physiol Endocrinol
Metab 2007, 293, E1552-1563.
[52] Shah, S. H., Bain, J. R., Muehlbauer, M. J., Stevens, R. D., Crosslin, D. R., Haynes, C., Dungan, J., Newby, L. K., Hauser, E. R., Ginsburg, G. S., Newgard, C. B., Kraus, W. E., Circ Cardiovasc Genet 2010, 3, 207-214.
[53] Pilone, G. J., Clayton, M. G., Van Duivendoden, R. J., American Journal of Enology and Viticulture 1991, 42, 153.
[54] Liu, S. Q., David, C. R., Am.J.Enol.Vitic. 1994, 45, 229-233.
[55] Lee, J., Chung, B. C., J Chromatogr B Analyt Technol Biomed Life Sci 2006, 831, 126-131.
[56] Grün, C. H., van Dorsten, F. A., Jacobs, D. M., Le Belleguic, M., van Velzen, E. J., Bingham, M. O., Janssen, H. G., van Duynhoven, J. P., J Chromatogr B Analyt Technol Biomed Life Sci 2008, 871, 212-219. [57] van Velzen, E. J., Westerhuis, J. A., van Duynhoven, J. P., van Dorsten, F. A., Hoefsloot, H. C., Jacobs, D. M., Smit, S., Draijer, R., Kroner, C. I., Smilde, A. K., J Proteome Res 2008, 7, 4483-4491.
[58] Saura-Calixto, F., Pérez-Jiménez, J., Touriño, S., Serrano, J., Fuguet, E., Torres, J. L., Goñi, I., Mol Nutr
Food Res 2010, 54, 939-946.
[59] Gao, X., Zhao, A., Mingmei, Z., Lin, J., Qiu, Y., Su, M., Jia, W., Metabolomics 2011, 7, 363-374. [60] Loo, R. L., Chan, Q., Brown, I. J., Robertson, C. E., Stamler, J., Nicholson, J. K., Holmes, E., Elliott, P., Group, f. t. I. R., Am J Epidemiol 2012, 175, 348-358.
[61] Welch, R. W., Antoine, J. M., Berta, J. L., Bub, A., de Vries, J., Guarner, F., Hasselwander, O., Hendriks, H., Jäkel, M., Koletzko, B. V., Patterson, C. C., Richelle, M., Skarp, M., Theis, S., Vidry, S., Woodside, J. V., Force, I. L. S. I. E. F. F. T., Br J Nutr 2011, 106 Suppl 2, S3-15.
[62] Estruch, R., Sacanella, E., Badia, E., Antúnez, E., Nicolás, J. M., Fernández-Solá, J., Rotilio, D., de Gaetano, G., Rubin, E., Urbano-Márquez, A., Atherosclerosis 2004, 175, 117-123.
[63] Vázquez-Agell, M., Sacanella, E., Tobias, E., Monagas, M., Antúnez, E., Zamora-Ros, R., Andrés-Lacueva, C., Lamuela-Raventós, R. M., Fernández-Solá, J., Nicolás, J. M., Estruch, R., J Nutr 2007, 137, 2279-2284.