1
TOWARDS SMART CITY MODELS: EVALUATION
OF METHODS AND PERFORMANCE INDEXES
FOR THE SMART URBAN CONTEXTS
DEVELOPMENT
Doctor of Philosophy (PhD) in Energy and Environment
XXXIII cycle
PhD Candidate: Laura Pompei
Tutor: Fabio Bisegna
Faculty of Civil and Industrial Engineering
Dept of Astronautical, Electrical and Energy Engineering - DIAEE
2
ABSTRACT ... 5
INTRODUCTION ... 6
Chapter 1 ... 10
1.1 Introduction ... 10
1.2 State of art: from Smart City to Smart Campus projects ... 10
1.3 Aims and Methodology ... 12
1.4 Description of the smart methodology (IMM) ... 12
1.5 Integration of the IMM methodology: focus on the PIs analysis and their standardization ... 16
1.5.1 Performance and Composite Indicators ... 16
1.5.2 Composite Indicators (CI) proposed ... 18
1.5.3 Standardization, aggregation and weighting of the CI ... 22
1.6 Case study: Faculty of Civil and Industrial Engineering, Sapienza, University of Rome ... 25
1.6.1 Methodology application ... 26
1.7 Results and discussion ... 27
1.7.1 Composite Indicators results ... 27
1.7.2 The Qualitative Incidence Matrix development ... 34
1.7.3 Simulation of the Energy winner strategy ... 39
1.8 Conclusions ... 47
Chapter 2 ... 49
2.1 Introduction ... 49
2.2 State of art: Smart City models and approaches ... 50
2.3 Aims and Methodology ... 53
2.4 Description of the smart methodology (QIMM) ... 54
2.4.1 MDMA and QIMM relation ... 54
2.4.2 Quantitative Incidence Matrix Method (QIMM) ... 55
2.4.3 Hybrid AHP method ... 60
2.5 Case study ... 63
2.5.1 Sicilian residential district case study ... 63
3
2.6 Results ... 68
2.6.1 Sicilian residential district case study: QIMM method application .... 68
2.6.2 Sicilian residential district case study: Hybrid AHP method application ... 71
2.6.3 Palazzo Baleani case study: QIMM method application ... 74
2.6.4 Palazzo Baleani case study: the Hybrid AHP method application ... 78
2.7 Discussion ... 81
2.7.1 Sicilian residential district case ... 81
2.7.2 Palazzo Baleani case study ... 84
2.8 Conclusions ... 87
Chapter 3 ... 89
3.1 Introduction ... 89
3.2 State of art ... 90
3.4 Aim and Methodology ... 94
3.5 Description of the Case study ... 95
3.5.1 Energy generation system ... 97
3.5.2 Calculation of the energy requirements ... 98
3.5.3 Energy microgrid ... 107
3.5.4 Results of the energy microgrid ... 108
3.6 Application of the smart methodology: QIMM ... 113
3.6.1 Smart and resilient performance indicators ... 114
3.6.2 Quantitative Incidence Matrix ... 121
3.7 Results and Discussion ... 126
3.8 Conclusion ... 129
Chapter 4 ... 131
4.1 Introduction ... 131
4.2 State of art of projects for the suburbs redevelopment ... 131
4.3 Aims and Methodology ... 132
4.5 Case study: Tor Bella Monaca, Rome ... 134
4.6 Methodology application ... 135
4.6.1 Preliminary Planning ... 135
4
4.6.3 Problem categorization through a Survey ... 135
4.6.4 Planning of Strategies ... 137
4.6.5 Simulation strategies ... 139
4.6.6 Performance Indicators ... 141
4.7 Results and discussion ... 143
4.7.1 Final rakings ... 145
4.8 Conclusions ... 147
CONCLUSION... 149
BIBLIOGRAPHY ... 153
5
ABSTRACT
Today, cities are facing many challenges such as pollution, resource consumption, gas emissions and social inequality. Many future city views have been developed to solve these issues such as the Smart City model. In literature several methods have been proposed to plan a Smart city, but, only a few of them have been really applied to the urban context. Most of them are indeed theoretical and qualitative approaches, providing scenarios that have not been applied to real universities campus/cities/districts. In this framework, the aim of this thesis is to integrate a previous qualitative smart method and transform it into a quantitative and ex-post one. The feasibility and validity of the method will be tested through the comparison with another existing model and the application of both approaches on two real case studies, characterized by different territorial levels. Finally, the flexibility of this new quantitative smart methodology is demonstrated throughout its application on another two urban contexts: highland villages and the Italian suburb. Results of the analysis show that this smart methods is reliable and provide coherent results, becoming an useful instrument for designers and planners for the identification of the most performing Smart strategies.
6
INTRODUCTION
Starting from the Greek era, cities have been the core of the human’s skills and cultural evolution. Nowadays, towns and metropolises still occupy an essential role in facing the challenges of global urbanization, evolving its capacity to respond to the citizen’s needs. Among the global challenges, the climate issue is rapidly forcing authorities and governments to provide sustainable and efficient solutions. In this framework, the importance of shifting from traditional urban planning to more inclusive and innovative ones is an urgent request. As a consequence, the Smart City concept was developed as a reliable key to the contemporary cities’ requalification.
Over the past decades, there has been an evident passage from a Smart City focused on technology’s network (strongly related to the Information and Communication Technologies-ICTs) able to provide an efficient urban infrastructure (i.e., transport, communications, energy, etc.) to a more global approach, moving its attention to human needs. This contemporary definition gives a central role to the life quality of citizens, finding a balanced relationship between hardware and software tools.
This evolution of the Smart City’s interpretation was followed by local and international governments, providing incentives and funding for the application of this model in different territorial levels. In the European vision, this concept is also increasing its power and magnitude as the latest regulation underlines (ISO 37122:2019). This ISO standard proposes methodologies and indicators to measure the performance of the Smart cities. Moreover, a general and inclusive definition of the Smart cities was finally proposed:
“A city that increases the pace at which it provides social, economic and environmental sustainability outcomes and responds to challenges such as climate change, rapid population growth, and political and economic instability by fundamentally improving how it engages society, applies collaborative leadership methods, works across disciplines and city systems, and uses data information and modern technologies to deliver better services and quality of life to those in the city (residents, businesses,
7
visitors), now and for the foreseeable future, without the unfair disadvantage of others or degradation of the natural environment”.
Many Smart City projects were therefore carried out due to the exploiting of this innovative urban planning model. Some international teams were focused on the elaboration of smart approaches, as a result of a mix of theoretical principals and peculiar technological tools. Although the variety of the Smart models and methodologies exposed in literature, few of them provided the designers and planners with tangible and scalable methods, applicable to different territorial levels.
To cover this gap, this thesis presents a useful and reliable answer, investigating the relevance of a Smart Methodology that can guide the transformation from a model to a smart one.
First, an existing qualitative smart approach is described and integrated in this work, focusing its application on a university’s campus. This method, named the Incidence Matrix Method (IMM), was previously developed by a team of researchers from Sapienza, University of Rome. Laying its foundation on a global and inclusive characterization of a smart model, it is composed of different steps, wherein an important integration was done in this thesis. Then, this method will be completely transformed into a quantitative and ex-post one to overcome its subjectivity that characterizes a qualitative scheme. To test its efficiency and reliability, a comparison with another smart approach was performed. Finally, the flexibility of this new quantitative smart methodology is demonstrated throughout its application on two urban contexts: highland villages and the Italian suburb.
This dissertation is divided into 6 sections which proceed with the following line: introduction, integration of the IMM approach and its application to a university campus, description of the new methodology named Quantitative Incidence Matrix Method (QIMM), application of this methodology to different contexts (Smart highland communities, Smart Suburb) and conclusions.
More in details, Chapter 1 presents the IMM scheme and each phase of its analysis, focusing on the elaboration of a set of performance indicators able to
8
describe the complexity of the university’s campus. Therefore, the step of the indexes standardization was deeply analyzed, proposing different calculation method for correctly standardize them. The application to a real campus showed how the smart method can evaluate the impact of the proposed solutions to each smart axis, providing a global view of the campus to the designers.
Chapter 2 represents the core of this thesis, wherein the author transforms the IMM approach into a quantitative one, overcoming some subjected weights that could affect the entire process. To successfully do that, this approach, named Quantitative Incidence Matrix Method (QIMM), was compared with another method presented in the literature. In parallel, both approaches were applied to two case studies, an isolated building and district ones. Conclusions highlighted the weakness and the strengths of both smart approaches, but in general, they provided similar results, attesting their reliability and giving suggestions for future developments.
Starting from the validation of the QIMM approach, Chapter 3 describes its application to a complex case study, an energy microgrid for six highland villages in Italy. Moreover, the resilience theme was included in this analysis, in term of energy resilient plants. Energy systems must face with failures or blackout during its operation time , which can provoke consistent damages. A set of resilient and smart indicators were therefore elaborated. Results underlined the best resilient scenario which obtained a good performance for most of the smart axis.
In Chapter 4 the Smart project is focused on the urban periphery, considered as a neglected settlement of the contemporaneous cities. Applying the QIMM approaches, this work pointed out the importance of citizen’s opinions. In line with this, a survey was given to citizens to understand which services they would prefer in the project area. A multifunctional centre was defined as an optimal and smart strategy for enhancing this suburb.
10
Chapter 1
FROM SMART CITY TO SMART CAMPUS:
application of a Smart Method for the development
of a Smart University Campus
1.1 Introduction
Currently, the complexity of the university system is well known and articulated: the administration of resources, the organization of various activities, the education of new minds. This system frequently comes up against considerable problems and requires innovative and multifunctional approaches to cope with these issues. In this context, the Smart concept can be applied to overcome current difficulties. This model is based on a deep knowledge of the interested area, followed by the identification of specific and focused actions. Developed during the last years, the concept of Smart City lays its foundations on the studies made by the University of Vienna. The model has the aim to draw up an evaluation ranking of several European examined cities. The model of Smart City moves along six axes (Smart Economy, Smart Governance, Smart People, Smart Environment and Smart Living); each of them contains a different parameter for the evaluation of the level of smartness of the cities.
1.2 State of art: from Smart City to Smart Campus projects
Keeping in mind, that a consistent review of the models and approaches of the Smart City concept was done in the second chapters of the thesis, in this paragraph the focus is to briefly describe the Smart City concept to underline its connection to the Smart Campus one.
11
Many projects have been developed based on the Smart City model. This theme, therefore, evolved during the last 30 years, changing its criteria depending on the type of the researcher’s approaches.
In [1] a common system for evaluating Austrian cities of any size and type is developed, promoting the creation of innovative and interconnected solutions; another example is the study which indicates a set of performance indicators, focused on climate change and energy efficiency [2]. Researches, especially the one concerning the definition of performance indicators have been developed for assessing specific macro areas: environment, sustainability and energy. The same processes and dynamics of cities can be also found in University campuses, allowing to apply the same Smart model to this urban microcosm. Many frameworks of Smart Campus have been elaborated by international teams, such as the improvement of campus energy efficiency proposed by an Italian team [3], the development of technological platforms able to manage and promote the environmental and buildings sustainability [4] [5], the creation of p sustainable and accessible services for users [6]. Among this, several types of research are focused on the development of cloud platform services as it is exposed to the work of [7]. The authors proposed an innovative platform named “Smart Campus Central Intelligence – SCCI”, that allows managing data and service that they have to be sensible, accessible, social and visible.
Regarding recent works, only a few papers present application and description of the real smart campus. An example is a work of [8], in which the authors enhanced their smart project at the University of Toulouse III Paul Sabatier, in France. In line with this, another study [9] recommended an IoT and cloud computing for the Wuhan University of Technology smart campus (China). Similarly in [10], the role of cloud computing and IoT is well promoted as a key tool for transforming a campus into an intelligent and innovative one.
As for Smart City, even for the Smart Campus, there are not complete models that analyze the problem from a global perspective. This brief investigation in literature highlights that also the latest projects are just focused on some areas, such as environmental, energy, informational (IoT and cloud computing) or administrative.
12
1.3 Aims and Methodology
In this framework, this study wants to adopt and integrate a methodological approach, named Incidence Matrix Method (IMM) [11], applicable to each university, but also flexible to the specific characteristics of each site under examination. Nevertheless, this methodology needs to be provided with certain tools able to direct the transformation of a university system into a Smart complex. In the applied methodology, an important phase consists of the creation and analysis of performance indicators, able to describe each macro area in a complete and exhaustive way. This phase will be investigated by the author aiming to show a possible scenario of Composite Indicators for each Smart field, which fully describes every aspect of the university campus, in a global view. The standardization and aggregation methods are chosen specifically for this study as it will be described in the following paragraphs. Moreover, these indicators are flexible enough to be adapted to other universities and to provide an accurate analysis of their current state.
Summarizing, this work aims to:
Describe the smart methodology IMM (Incidence Matrix Method), based on the smart approach elaborated by the work of [11].
Integrate the IMM process to propose a set of Composite Indicators and to identify a quantitative method to standardize them.
Apply the integrated smart approach on a real case study (Sapienza, university campus).
1.4 Description of the smart methodology (IMM)
The Incidence Matrix Method (IMM) is composed by five steps: preliminary planning, identification of fields of action, data acquisition, data analysis, the definition of the strategies [12], [13].
The preliminary analysis is required to get a first idea of the intervention area, the users and the purpose and the feasibility of the project. More accurate is the analysis of the project, more detailed and focused will be the final solutions developed. Stakeholders, citizens, politicians are all involved in these
13
preliminary steps, since their needs and perspectives are crucial for smart planning. Moreover, this phase is essential for pointing out the particular characteristics of an urban settlement. Several characteristics of territorial levels have to be taken into account: the history and the evolution of the area, the geographical position and the surroundings, the cultural identity, the relation among the different parts of the city. The role of the urban planner is to outline a specific and all-embracing framework of the area through an integrated and multilayer analysis approach. According to this, the urban planner should be equipped with several tools able to give realistic simulations to highlight the existing relations among the urban elements and the consequent morphological effects of the interventions on the entire context.
The second phase aims to identify the Smart areas, the fields of analysis and action. The Smart fields defined in [14], have been adapted to the university campus, and transformed into five areas (Energy, Economy, Environment, Mobility, Living the campus), as showed in Figure 1. The reduction of the six smart axes into five was done by the author, following the previous works of the same team [13]. The “Governance” field is not considered as an isolated aspect, but it is integrated inside each axis; the Smart Living and Smart people axis are combined in one field, called “Living the campus” since the Living has been considered as the services supplied by the campus to the different user/people. Finally, the “Energy” field has been separated from the Environment, because it is better to highlight the impact of those two fields separately. This phase is important for the evaluation of the performance of the campus and the management of its development.
14
The third phase is regarding the data collection and it is composed by the acquisition of a large amount of information to be organized and placed in a database, where the information is transparent and shared among the involved stakeholders and partners. The researches, measurement campaigns and surveys are therefore essential to acquire data and information for the development of this database and the performance indicators, as it is exposed in the next paragraphs. The main problems in the data collection are usually the identification of information effectively useful and the difficulty in accessing data. For these reasons, the selection of the information depends not only on the purpose of the project but also on their accessibility, availability and relevance.
The fourth phase foresees the analysis of all available data, their standardization, aggregation and weighting, by using composite indicators (CI) for evaluating the points of strength and weakness of the context. Indicators are essential to collect data of the model and they are grouped inside the smart axis. It is not easy to combine all the variables, due to the big amount of information and their different peculiarities. Therefore, a good solution is to aggregate in a weighted manner the obtained data into different indicators, named Composite Indicator (CI), based on an underlying model of the multi-dimensional concept that is being measured [15].
The last phase proposes planning strategies to overcome the problems related to each field, highlighted by the values of the indicators.
Applying this model, according to this, the chosen strategies are efficient and integrated because they provide transversal solutions generating holistic benefits from all the points of view [16], [17].
More in details, a set of strategies were defined at the end of the process able to face the problems underlying previously. These actions represent an example of smart solutions that could be applied to the analysed context:: the amount and the typology of actions can be modified since this smart approach is flexible and scalable. Moreover, the categorization of those solutions is essential to establish the impact of them on each smart axis.
15
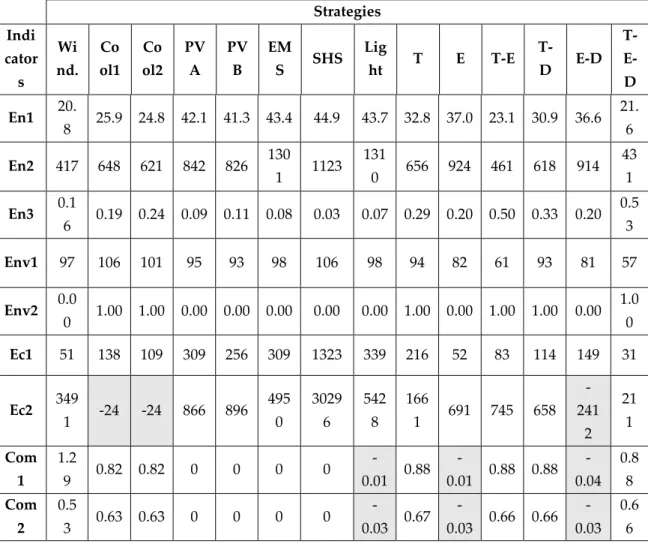
A decisional matrix (actions x fields) will be defined, named Incidence Matrix, for each smart axis, in which all the solutions are evaluated through specific “score” and “weight”(Table 1).
The actions are given a score comprised between -5 and 5, based on their level of synergy with the other actions. The sum of all these scores is the final score that represents the global impact of each strategy on each smart field. Then, a qualitative prioritization process has been developed based on the assignment of three additional scores which have been added to the final score each action. The stakeholder's Score (SS), based on the number of benefits for the highest number of different stakeholders, such as users and companies; the Feasibility Score (FS), based on the level of the feasibility of the action; the Time Score (TS), based on the completion time required by each action. The role of those three weights is to give a priority to the actions, avoiding the equal final score of the strategies.
Table 1: Example of Incidence Matrix process
AXIS
ENVIRONMENT Strategies
Waste Air quality Landscape Water
Actions
ACTION 1 ACTION 2 ACTION 3 ACTION 4
EN - - - -
[score] [score] [score] [score]
ENV - - - -
[score] [score] [score] [score]
EC - - - -
[score] [score] [score] [score]
MOB - - - -
[score] [score] [score] [score]
LIV - - - -
[score] [score] [score] [score]
Score <. <. <. <.
SS <. <. <. <.
FS <. <. <. <.
TS <. <. <. <.
TOT <. Winner one <. <.
Before implementing the strategies, the quantitative simulation of the actions will be performed. Many software can be used for the assessment of Smart performance. The base requirement of the software is the possibility of simulating the different type of smart solutions, not only the energy or environmental ones.
16
1.5 Integration of the IMM methodology: focus on the PIs
analysis and their standardization
It is evident that the fourth phase, the one involving data analysis and the definition of the Smart performance indicators, plays an essential role. This work proposes a method of Data Analysis, focusing on the fourth step of the methodology just described before.
1.5.1 Performance and Composite Indicators
The task of evaluating and synthesizing the various aspects of a territorial level is attributed to the indicators: already used in various scientific fields, they assess the specific performance of the case study and allow the analysis of a large amount of data. Furthermore, the indicators underline potential and weakness of an object from different perspectives. Finally, they give the possibility to create a ranking.
“An indicator is a specific, observable and measurable characteristic that can be used to show changes or progress a program is making toward achieving a specific outcome.” *18].
Indicators should be created following certain characteristics, otherwise the information will lose their validity and their effectiveness. According to [18], a list of useful characteristics for developing good indicators are proposed:
Valid and meaningful
An indicator should show the phenomenon it is intended to measure and should respond to the needs of the user.
Sensitive
The sensitivity underlines how an indicator could vary according to the change of the measured phenomenon.
Easily interpreted
Indicators should be sufficiently simple to be legible by users ( e.g. it should be clear what the indicator is measuring).
17
Comparable
Indicators need to quantitative evaluate the project- goals, but it should also be consistent with those used in international indicators researchers in order to compare it with them.
Disagreeable
Indicators should be able to be broken down into sub-indicators or areas of particular interest.
Adaptable
The difficulty to gather useful information for the analysis is proof of the fact. Data are not always available from a trustful source or it’s difficult to obtain from the administration’s office or public institution. The planners should, therefore, adjust and adopt indicators accordingly to measure the required information in the best way possible.
Moreover, two different types of indicators could be found: individual, which measure a specific object and composite, that collects several indicators to measure a more complex concept. Individual indicators should be carefully detailed and specific for the phenomena that aim to describe.
Regarding the composite one [19], they can divide through an aggregation scheme which usually follows this line: index, sub-index (optional), indicator, variable.
After the data collection and the definition of the indicators, to obtain CIs is the normalization of the data to make them comparable. Then, they can be aggregated and weighted considering possible correlations and compensability issues among the indicators. Several normalization methods could be used, as showed in the literature [20,21]. The choice of the normalization method depends on the nature of the indicators itself and designer skills. Among the weighting and aggregation process, different approaches are presented [22]. Some of them could be grouped on the “Additive methods”, in which results of all indicators are summed linearly to obtain a final weight. Normalization methods can be used if the units of some indicators are different. Another kind of approaches’ are referred to as the geometric method. This type of aggregation method uses the geometric mean to obtain the final value. Finally,
18
another method applied for this issue is the Non-compensatory Multi-criteria Analysis, that uses pairwise comparisons in order to generate a ranking with the best performing alternative.
This kind of approaches, grouped inside the Multiple - Criteria Decision Making (MCDM), will be investigated deeply in the second chapter of this work. Keeping in mind that the relationship aggregation and weighting should be analysed carefully to avoid double counting or unreliable final data.
1.5.2 Composite Indicators (CI) proposed
Nowadays, a lot of frameworks have been applied to university campus but only energy and environmental indicators, have been studied as in [23,24]. There is a clear lack of a global approach to the system, which could overlook all the other aspects of the campus such as social, economic issues. Starting from these considerations, in those studies, many different indicators have been combined and recovered to be able to develop a global scenario of composite indicators, Sources for the definition of the Smart indicators are [25,26].
Basing on the literature review carried out by [27], it was possible to build an aggregation scheme, following this line: index, sub-indicator, indicator, variable. Table 2 showed the different level of the Composite Indicators construction and elaboration. In the next paragraph, the entire standardization’s steps will be defined in detail.
Table 2: Standardization and aggregation process of CI
Level 1 VARIABLE
Standardization Steps
The Standardization process (z-scores method, percentage difference and so on)
Qualitative weights Final weighted score
Level 2 INDICATOR
Standardization Steps
Qualitative weights Final weighted score
The average score of the variables involved by the Indicators
Level 3 SUB INDICATOR
Standardization Steps
Qualitative weights Final weighted score
19
The average score of the Indicators involved by the Sub indicators
Level 4 INDEX
Standardization Steps
Qualitative weights Final weighted score
The average score of the Sub indicators involved by the Index
In agreement with OECD, the handbook for developing composite indicators [22], it is necessary to standardize all CI, in order to be able to aggregate and compare them. In fact, the different nature of the data requires an operation of untying from the original units of measure.
As aforementioned in the previous paragraphs, many methods for standardization of variables are proposed in literature and even though there is not a perfect method, the choice should be oriented to the “best way” for the case study.
Keeping in mind, that those CI (Tables 3,4,5,6,7) could be adapted to the specific Campus, allowing designers to deeply specify the variables depending on the real case under analysis.
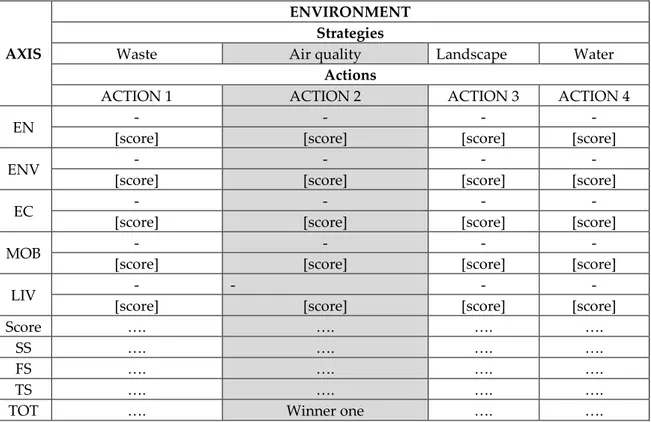
Table 3: The Living the Campus’s CIs
Variable Indicator Sub-indicator Index
Average annual student number / classrooms number Primary Services LI V IN G T H E C A MP U S
Equivalent student ( square
meter per students ) Equipped classroom
number (chairs, blackboard,
projectors et al) Sanitary service number /
total students ratio
Dining service presence Secondary
Dining service capacity between 12:30 p.m. and
14.30 p.m. Wi-Fi covered area / total
area campus
Web- online sities Procedures that can be
activated on web / total
procedures Total annual events Events
Total annual companies
meeting Future job
20 Historic and artistic
buildings and views
(ITACA's indicators ) Context evaluation Context
Average registered students
Inscription
Students Average registered foreign
students
Persistence badger Badger Bachelor graduated / total
students ratio
Graduation rates Master graduated / total
students ratio Number of the graduates who declare that they have
a paid work activity in 2015 Erasmus students in
2013-2014 / total students ratio in
2013-2014 International exchanges Erasmus scholarships needed in 2013-2014 / total scholarship ratio in 2013-2014 Number of foreign
universities hosting Italian students for Erasmus Number of students /
number of professors ratio
Teaching Academy Number of engineering PhD scholarship in 2016 / number of university PhD scholarship Number of ordinary professors / Total professors ratio Number of associate professors / Total professors ratio Number of researchers /
total professors ratio Total research funded by the PRIN program in the three-year period 2008-2009-2010 / average of
professors
Research Number of publications in
2015 / total professors ratio
Table 4: The Environmental CIs
Variable Indicator Sub-indicator Index Not recyclable waste
production / Campus users
EN V IR ON ME N T A L
21 ratio Production
Waste Paper consumption per year
Recyclable waste production
/ Campus users ratio
Recyclable waste Daily water consumption Water consumption
Water Reused rainwater and
wastewater / water consumed ratio
Sustainability Number of classrooms with
window area > 1/8 of classroom area
Indoor pollution
Air quality Number of offices with > 1/8
of office area Indoor air quality
Vegetated areas / number of users
Density
Landscape Green area equipped / green
area ratio
Green areas Eating areas within 1km Context
Table 5: The Energy CIs
Variable Indicator Sub-indicator Index Renewable energy
produced
Sources of energy Production and Distribution
EN
ER
G
Y
Number of black out Grid Presence of intelligent
devices
Building Consumption
Energy demand ratio / floor area with energy certificate (class E) Energy efficient appliances / total appliances ratio Number of machines control in a year
Maintenance
Table 6: The Economy CIs
22 Incomes trend of a chosen
years (3-year) Incomes
Investments and
expenses ECO
N
O
MY
Expense trend of a chosen
years (3-year) Expenses Investments in
laboratories, furniture’s
funding’s for the
campus innovation Innovation Spin-off and international
partnership with industries Spin-off and partnership industries Partnership
Table 7: The Mobility CIs
Variable Indicator Sub-indicator Index
Parking area/n of professors Parking
Infrastructure
network MO
B
IL
ITY
Disabled people accessibility
Accessibility n of lifts
n° of lifts for disabled people Presence of fire stairs n° of autobus paths within
1km Public transport
Green mobility Car pooling
Sharing transport Bike sharing
Electric students bus Car sharing
1.5.3 Standardization, aggregation and weighting of the CI
All data could not be synthesized by the same method, but two or three methods have been identified for the standardization of the variables, based on their nature and way of comparison. For our case study, the used methods are the method Z-Scores and the percentage difference. The first one is useful for comparing data coming from other sources: in this case the comparison is focused on a big amount of data taken from of the different university of Italy, with the same size and number of faculties. The second one was chosen in order to standardize all variables based on an optimal target (for example imposed by law).
23
The Z-Scores method transforms data through mean (Mx) and standard
deviation (Sx), allowing to derive the final value Z. Therefore, it is possible to
convert the individual variable to a common scale with a mean M=100 and a standard deviation S=10: the obtained values will range approximately in the interval (70-130). Let X = {Xij} be the matrix of n rows (university campuses) and
m columns (variables), let Mxj and Sxj denote the mean and the standard
deviation of the j-th variable (Equation 1, 2):
n x M n i ij xj
1 Equation 1.
n M x S n n i xj ij xj
2 Equation 2.The standardized matrix Z = {Zij} is (Equation 3):
100 10 xj xj ij ij S M x z Equation 3.The percentage difference was very useful to standardize all those variables that had to express their performance in relation to an existing optimum target. Given the initial value xi to standardize and xf the value to be achieved, the
applied equation is as follows (Equation 4):
100 % f i f x x x Equation 4.
In this way, it was possible to transform the initial data into numerical values: the values taken from the Z-Scores are contained in the scale from 70 to 130; those derived from the percentage difference, however, are distributed in a range of 0% to 100%.
24
Since multiple methods of standardization of the data have been used, an aggregation method is also required in order to bring back the different values into a unique range. It was necessary to choose an arbitrarily score range, from -3 to + -3, thus bringing the scale of the values Z-Scores (70 to 1-30) and the scale of the percentage difference (from 0% to 100%) into this range, as shown in Figure 2.
Figure 2: Aggregation method.
After that, it is possible to transform all the variables in their respective indicators, following the aggregation scheme already described in Table 2.
The final step involves the weighting process: a weight to each element (variable, sub-indicator and indicator) have been assigned, to determine the importance of each of them in the composition of the final Index. The criterion adopted is a subjective criterion based on a percentage weight assigned by the authors. This method is the Additive Averaging [28]. An example is shown in Figure 3.
25
1.6 Case study: Faculty of Civil and Industrial Engineering,
Sapienza, University of Rome
The case study is the Civil and Industrial Engineering faculty of La Sapienza University of Rome. The historic building which hosts this University was built in 440 B.C. At the end of the 15th, century Francesco Della Rovere started to
restore the basilica adding to it another building, used for conventual communities. Only since the 19th century, it began to be used as a school, namely as a Math and Drawing Superior School. The building was therefore subjected to some extensions and adjustments. In the end, in the first years of the 20th century, due to the overcrowding space for the increasing number of students, many other structures were built next to the original building. Nowadays, the academic complex consists of eight different buildings containing classrooms, libraries, offices (Figure 4). The singularity of this academic campus is due to the historical nature of the buildings, in particular the famous indoor cloister, which became the symbol of this university.
26
Figure 4: Ground floor plan of the campus
1.6.1 Methodology application
According to the methodology described in the previous paragraphs, the first steps are the preliminary planning that involves the analysis of the characteristics of the urban context.
The San Pietro in Vincoli campus is a multifunctional complex, characterized by an exceptional history, as it was explained previously. The most important
27
data of this campus, therefore, is related to its historical, structural, operational, demographic and academic characteristics. Data were provided by different sources: university offices, online web-site, Sapienza administrative offices, especially for the economic and energy information. The phase of the data collection was not easy and it takes time to obtain official permissions to manage some information. This issue is nowadays very common and the designers have to face with it.
The definition of the smart axis was done, following the IMM methodology. Five smart fields, therefore, are chosen: Energy, Economy, Environment, Mobility, Living the campus.
The standardization process was developed for all the CIs, following the process described previously. Then, it was possible to elaborate the final score for each smart field, understand the strength and weakness of the Campus, before any smart solution implementation. Rankings of the current state of the Campus was therefore draft. Finally, several strategies were proposed to overcome the limits and problems of the campus.
The Incidence Matrix were elaborated for the smart axis, analysing the impact of the presented solutions on each filed. In the next paragraphs, the author will show the results about the smart ranking and of the winner strategies, that obtained the maximum score inside the matrix.
1.7 Results and discussion
1.7.1 Composite Indicators results
This analysis has been developed for all the smart fields. Due to the easiness of the readers, only the Living the campus’s results were divided into two parts to show the entire calculation’s process of each variable (Table 8, I-II). The other tables (Table 9,10,11,12) start from the indicator’s standardization, keeping in mind that the variables of each smart field (showed in Table 4,5,6,7) were analyzed. The average of the indicators is, therefore, the results of the respective
28
variables calculation. Some considerations about the scores obtained by indicators will be done below each table.
Table 8: Living the Campus results (I)
Variable X
initial X final
Δ% score weight weighted value Indicator Average annual student number / classrooms number 23.24 50.0 0 53.5 1 2.00 0.10 0.20 P rimar y Equivalent student (square meter per
students ) 1.80 4.00 55.0 0 -0.30 0.40 -0.12 1.80 4.00 55.0 0 -0.30 0.40 -0.12 Equipped classroom number (chairs, blackboard, projectors et al) 35.00 40.0 0 12.5 0 2.25 0.20 0.45 Sanitary service number/total students ratio 17.00 30.0 0 43.3 3 0.40 0.30 0.12 Dining service presence 1200.0 0 2122 .00 43.4 5 0.39 0.50 0.20 Secon dar y Dining service capacity between 12:30 p.m. and 14.30 p.m.
yes yes Yes 3.00 0.50 1.50
Wi-Fi covered area /
total area campus 0.88 1.00 12.0 0 2.28 0.60 1.37 Web - o n li n e
Procedures that can be activated on web / total procedures 80.00 100. 00 20.0 0 1.80 0.40 0.72
Total annual events 123.00 335. 00 63.2 8 -0.80 1.00 -0.80 Events Total annual companies meeting 52.00 335. 00 84.4 8 -2.07 1.00 -2.07 Fu tu re job
29 Total art and culture
event 60.00 80.0 0 25.0 0 1.50 1.00 1.50 Ex ter n a l even ts
Historic and artistic buildings and views (ITACA's indicators ) 100.00 100. 00 1.00 3.00 1.00 3.00 Co n tex t eval u ati on Average registered
students z-scores method 0.50 0.60 0.30
In
script
ion
Average registered
foreign students z-scores method 1.00 0.40 0.40 Persistence badger z-scores method 0.60 1.00 0.60
Bad
ger
Bachelor graduated /
total students ratio z-scores method 1.40 0.35 0.49 Gr
adu atio n r ates Master graduated /
total students ratio z-scores method 1.80 0.35 0.63 n° of the graduates
who declare that they have a paid work
activity in 2015 z-scores method -0.50 0.30 -0.15 Erasmus students in 2013-2014 / total students ratio in 2013-2014 z-scores method 2.30 0.50 1.15 In ter n atio n al e x ch an ges Erasmus scholarships needed in 2013-2014 / total scholarship ratio
in 2013-2014
z-scores method 2.30 0.30 0.69
n° of foreign universities hosting
Italian students for Erasmus
z-scores method -2.50 0.20 -0.50
n° of students / n° of
professors ratio z-scores method 2.40 0.10 0.24
T each in g n° of engineering PhD scholarship in 2016 / n° of university PhD scholarship z-scores method -0.80 0.30 -0.24
30 professors / Total professors ratio n° of associate professors / Total professors ratio z-scores method 1.20 0.20 0.24 n° of researchers /
total professors ratio z-scores method -1.30 0.20 -0.26 Total research funded
by the PRIN program in the three-year period 2008-2009-2010 / average of professors z-scores method -2.50 0.60 -1.50 R esear ch n° of publications in 2015 / total professors ratio z-scores method 2.30 0.40 0.92
Table 8: Living the Campus results (II)
Indicator avera ge weig ht weig hted value Sub-indicator avera ge weig ht weight ed value Inde x Scor e Primary 0.650 0.350 0.228 Services 0.74 0.40 0.30 LI V IN G T H E C A MP U S 0.80 Secondary 1.697 0.200 0.339 Web- online 2.088 0.150 0.313 Events -0.8 0.1 -0.08 Future job -2.1 0.1 -0.21 External events 1.5 0.1 0.15 Context evaluatio n 3.00 1.00 3.00 Context 3.00 0.10 0.30 Inscriptio 0.70 0.20 0.24 Students 0.96 0.20 0.19
31 n Badger 0.60 0.35 0.21 Graduatio n rates 0.97 0.25 0.24 Internatio nal exchanges 1.34 0.20 0.27 Teaching 0.46 0.60 0.28 Academy 0.04 0.30 0.01 Research -0.58 0.40 -0.23
The maximum score was achieved by the context evaluation indicator, due to the historical characteristics of the urban area, such as the presence of the Colosseum. Then, secondary service obtained a good evaluation, since the campus is well organized for the dining services. Conversely, the primary service seems to be not enough for satisfying the student’s needs, due to the spaces limitations. Finally, the indicator that achieved the lower score is the Research one, since the campus is not able to guarantee tools and services for this field.
Table 9: Environmental results
Indicator avera ge weig ht weight ed value Sub-indicator avera ge weig ht weight ed value Ind ex avera ge Productio n 1.14 0.50 0.57 Waste -0.18 0.40 -0.07 EN V IR O ME N T A L 0.65 Recyclable waste -1.49 0.50 -0.75 Water consumpti on 3.00 0.80 2.40 Water 1.80 0.20 0.36 Sustainabi lity -3.00 0.20 -0.60
32 Indoor pollution 1.60 1.00 1.60 Air quality 1.60 0.30 0.48 Green area -1.20 1.00 -1.20 Landsca pe -1.20 0.10 -0.12
Regarding the environmental indicators, the worst score is obtained by the sustainability indicator, that it takes into account the percentage reuse of wastewater. The campus is not equipped with a recycling water system, therefore the indicator shows this negative value. Among the sustainability aspect, the Recyclable waste indicator obtained a negative value too, since the recycling is not adopted for all the building inside the complex.
Table 10: Energy results Indicator Av. Weig
ht weight ed value Sub-indicator avera ge weig ht weight ed value Ind ex avera ge Sources of energy -3.00 0.70 -2.10 Productio n and Distributi on -1.80 0.60 -1.08 EN ER G Y -1.36 Grid 1.00 0.30 0.30 Building -1.60 0.65 -1.04 Consumpt ion -0.69 0.40 -0.28 Maintena nce 1.00 0.35 0.35
As showed in the table above, the energy smart axis obtained the worst score, due to the old envelope of the building and to the presence of obsolete technical system plant. In detail, the source of energy indicator achieved a point of minus three since it represents the relationship between the use of renewable sources respect to the energy needs. As aforementioned, the campus uses the only traditional source of energy such as gas for the thermal systems. Following, the building indicator highlights the lower envelope performances of the entire complex, that still need a consistent energy requalification.
33
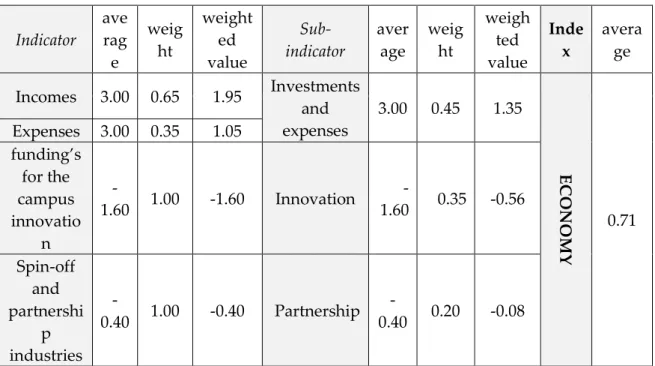
Table 11: Economy results Indicator ave rag e weig ht weight ed value Sub-indicator aver age weig ht weigh ted value Inde x avera ge Incomes 3.00 0.65 1.95 Investments and expenses 3.00 0.45 1.35 ECO N O MY 0.71 Expenses 3.00 0.35 1.05 funding’s for the campus innovatio n -1.60 1.00 -1.60 Innovation -1.60 0.35 -0.56 Spin-off and partnershi p industries -0.40 1.00 -0.40 Partnership -0.40 0.20 -0.08
Among the economy field, indicators related to the spin-off and the implementation of innovative solutions registered low scores compared to the other ones. Those results underline the importance of future job investment for graduated students.
Table 12: Mobility results Indicator avera ge weig ht weight ed value Sub-indicator avera ge weig ht weight ed value Inde x avera ge Parking -0.90 1.00 -0.90 Infrastructur e network 1.00 0.70 0.70 MO B IL ITY 0.61 Accessibil ity 0.90 0.40 0.36 Public transport 1.50 0.60 0.90 Green mobility -0.30 0.30 -0.09 Sharing transport -0.75 0.40 -0.30
Finally, the table above showed the situation related to the mobility of the Campus. Parking and Sharing transport indicators obtained negative value since only the car-sharing is the service active for the campus’s users. Moreover, the presence of a few parking dedicated to the campus is available near the university. Accessibility indicator is positive but reached a low score since not all the buildings present elevator for disabled people. On the other hand, the
34
public transport one showed the best score, due to the presence of the metropolitan services combined with the bus one.
Then, it is possible to draft the final ranking of the stat of art of the Campus, in order to identify the smart axis that presents several problems (Table 13).
Table 13: Smart Ranking results Ranking Smart axis Scores
1 Living the Campus 0.80 2 Economy 0.71 3 Mobility 0.61 4 Environment 0.65 5 Energy -1.36
Living the campus has achieved the highest score: the sub-indicators, such as academia and students, demonstrate the good quality of teaching and services. On the other hands, the Energy field got the worst score, especially the sub-indicator “Source of energy”, showing the lack of renewable energy systems within the building. Those energy negative results are reasonable due to the old age of the campus. Finally, the environment field, which has an average score, highlights the weak management of the recyclable waste service. Basing on that weakness, the strategies can be planned to give accurate and smart solutions, solving the current problems of the campus.
1.7.2 The Qualitative Incidence Matrix development
After the problems categorizations, the following step is to propose a set of strategies for each smart axis able to solve the weakness of the campus. Designers could define different solutions, without any limits regarding the number of them. However, the role of the planners is to evaluate in detail a few of them, knowing their potentialities.
Fort this case study, only the economic field was not taken into account since it is a complex aspect that involved so many actors that it will be difficult to
35
quantify in this work. Tables 14,15,16,17 collect therefore the impact of those solutions for all the smart axes.
Table 14: Living the Campus incidence matrix
AXI S
LIVING THE CAMPUS Strategies
Furniture for the Cloister Redevelopment of abounded space Interactive systems Services Actions
Furniture Smart Square Display Sanitary
services
EN None
Energy saving thanks to the light dimming and smart
systems Energy consumed None 0 [+1] [-1] 0 EN V Use of recycling
materials CO2 reduction None None
[+1] [+1] 0 0
EC Economy saving
High initial investment partially covered by sponsors Low investment Medium investme nt [+1] [+1-1] [-1] [+1] MO B
None None Increase
mobility None
0 0 [+2] 0
LIV
Increase of comfort indoor
Smart and technological space Increase of comfort indoor Increase of primary service [+1] [+3] [+1] [+3] Scor e 3 6 1 4 SS 0.2 0.3 0.1 0.4 FS 0.3 0.15 0.25 0.3 TS 0.4 0.1 0.3 0.2 TO T 3.9 6.55 1.65 4.9
Actions proposed for this smart axis are: the installation of the furniture inside green and collective spaces, the implementation of a Smart Square, the installation of information display at the entrance and exit of the campus, the increased of sanitary services. The winner action is the implementation of a
36
Smart Square that includes many services such as smart benches, a new space for dining and so on.
Table 15: Environment incidence matrix
AXIS
ENVIRONMENT Strategies
Waste Air Quality
Actions Use of Compactors
Game app (waste's dictionary)
Use of Eco Box Environmental sensors
EN
Gas fuel saving partially covered by renewable source (PV panels) None None Energy consumed by sensors [+1-1] 0 0 [-1] ENV
No full garbage bin thanks to wireless signals Sustainability advantages Printer cartridges recycling Dangerous parameters controls [+1] [+2] [+1] [+2] EC Installation cost [-1] Reduction of non-recycling waste management cost [+1] Economic saving [+1] Installation cost [-1] MOB Reduction of km for
waste lorry None
Mobility for printer cartridges exhausted collection None [+1] 0 [-1] 0 LIV Increase of environmental quality Student’s awareness for sustainability field Increase of environmental quality
Real time data; increase of environmental quality [+2] [+1] [+1] [+2] Score 4 4 2 2 SS 0.3 0.2 0.15 0.35 FS 0.3 0.3 0.25 0.15 TS 0.25 0.45 0.2 0.1 TOT 4.85 4.95 2.6 2.6
37
The use of compactors, the Game App, the use of Eco box and the environmental sensors are the actions exposed to facing problems related to the environmental field. The Game App ones win the rankings, followed by the action of use of compactors. The aims of the winner solution are involved students in the process of sustainability in order to increase the environment’s care.
Table 16: Energy incidence matrix
AXI S ENERGY Strategies Lighting Monitori ng Efficiency of the envelope Efficiency of energy plant Actions Light senso r LED re-lamping Monitori ng system New windo w fixtur es New shadi ng New plast er Radiator installati on Condensat ion Boiler EN Energy saving [+1] [+1] [+1] [+1] [+1] [+1] [+1] [+1] EN V CO2 reduction [+1] [+1] [+1] [+1] [+1] [+1] [+1] [+1] EC
Investment partially balanced by the economy saving of the
bills
Investment balanced by the national incetives [+1-1] [+1-1] [-1+1] [+1] [+1] [+1] [+1] [+1] MO B None Advanta ges for the indoor mobility
None None None None None None
0 [+1] 0 0 0 0 0 0 LIV Increa se of visual comfo rt No dangero us gas emission; possibilit y of psicologi cal effects Control of the energy demand
Increase of visual and thermal indoor comfort
[+1] [+1-1] [+1] [+1] [+1] [+1] [+1] [+1]
38 e SS 0.2 0.2 0.15 0.15 0.00 0.15 0.15 FS 0.2 0.1 0.25 0.25 0.00 0.15 0.05 TS 0.3 0.15 0.15 0.15 0.15 0.05 0.05 TO T 3 3.7 3.45 4.55 4.55 4.15 4.35 4.25
As being the worst axis, several solutions have been proposed for the energy sector. The lighting, the technical system monitoring, the efficiency of the building envelope and the energy plants are the macro area investigated. Results of the matrix highlight the efficiency of the envelope obtained the high score. This action is divide into two: the implementation of new window fixtures and the application of shading systems. This action is followed by the efficiency of the energy plant due to the presence of obsolete technical ones. Moreover, the differences between them in terms of the score depends on the additional weights (SS, FS and TS).
Table 17: Mobility incidence matrix
AXIS
MOBILITY Strategies Parking Electric charging
stations Sustainable mobility Actions
Parking sensors Electric charging stations
Electric bus for
the campus Bike sharing
EN None
Possibility of powering the system
with PV panels Consumption reduction Consumptio n reduction 0 [+1-1] [+1] [+1] ENV Possible reduction of pollution if powered with renewable energy; decrease of acoustic pollution Possible reduction of pollution if powered with renewable energy; decrease of acoustic pollution Possible reduction of pollution if powered with renewable energy; decrease of acoustic pollution Possible reduction of pollution if powered with renewable energy; decrease of acoustic pollution [+1] [+1] [+1] [+1]
39 balanced by student taxes cost [-1] [-1] [+2-1] [-1] MOB Parking time reduction None Green mobility and time reduction Green mobility and time reduction [+1] 0 [+2] [+1]
LIV Stress reduction
Increase of environmental quality and money
savings Comfort increase and mobility optimization, stress reduction Stress reduction, increase of environment al quality, credits and benefits [+1] [+2] [+1] [+2] Score 2 2 6 4 SS 0.3 0.15 0.25 0.3 FS 0.25 0.25 0.25 0.25 TS 0.2 0.2 0.35 0.25 TOT 2.75 2.6 6.85 4.8
Among this last smart aspect, the parking sensors, Electric charging stations and the sustainability mobility (electric bus plus bike sharing) were therefore defined. The winner action is the actualization of an electric bus service for the students able to connect the other campus’s branches.
1.7.3 Simulation of the Energy winner strategy
All the winner strategy could be simulated in order to quantify their feasibility and strengths. In this case, only the energy one will be simulated. An open source software called Grasshopper/Archism, was chosen for this scope. Although most energy simulation tools, such as TRNSYS and EnergyPlus, are validated by the IEABESTEST (International Energy Agency Building Energy Simulation Test and Diagnostic Method) procedures [29], but frequently reliable results are not provided for the last version of these software [30]. On the other side, open sources software are easily implemented by the users and several online platform for helping them are available [31].
40
Archsim Energy Modeling is a plug-in for the parametric design environment Grasshopper for Rhinoceros [32]. The thermal model class library contains abstract definitions for zones, faces, materials and can translate those into a simulation engine specific syntax [33]. Recently, it becomes a part of the DIVA environmental performance analysis suite [34]. Below the description of those tools:
- Grasshopper is a graphical algorithm interface, free plug in for Rhinoceros. This tool uses a nodes diagram to describe mathematics and geometrical relationships.
- Rhinoceros 3D is a CAD modelling software for architectural and design fields, that works with NURBS (Non-uniform Rational B-Splines). This program allows to support a large amount of environmental and energy free plug-in. - EnergyPlus is the Grasshopper/Archsim energy engine for the analysis and thermal load simulation, elaborated by the U.S. Department of Energy’s (DOE) Building Technologies Office (BTO) and managed by the National Renewable Energy Laboratory [35].
Knowing that, the case study complex is composed of eight buildings and one of them is chosen for the energy simulation, as an example. This building host the department of Civil and Environment Engineering, few classrooms, offices and a library. It is composed of five floors with an average height of 3 m. Figure 5 shows the fourth floor and the offices highlighted in grey was chosen for the daylighting simulations, being located in the south exposition.
41
Figure 5: Plant of the office chosen
The model of the building is composed of 45 thermal zones. A thermal zone is a space or a collection of spaces having similar space-conditioning requirements and the same heating and cooling set-point. The 3D model, generated with Rhinoceros, was imported in Grasshopper as input for the “Thermal zone setting” in order to transform the geometrical model into an energy model. The thermal zone needs a specific element called “Brep” (Boundary REPresentation), useful for connecting geometrical zones together. Due to the complexity of the building composition, different components, such as Entewine, Intersector and Bang, are required in order to combine thermal zones (Figure 6).
42
Figure 6: Archsim components
Finally, climatization inputs are the following: set-point temperature (19 °C for heating and 26 °C for cooling) and base office operative time schedules of the heating and cooling systems. Energy simulations are carried on trough ideal technical systems due to the few energy conditioning characterizations.
As aforementioned, the smart winner strategies are both the new window fixtures and the shading placement. Single glazed windows are placed in the facades of the building with a transmittance of 3.7 W/(m2K). Therefore, the
installation of wood and aluminium double glazed window decreases consistently the transmittance value, 2.2 W/(m2K). Regarding the other solution,
horizontal shadings are proposed able to guarantee the lighting and thermal indoor comfort.
A sun path simulation was done to see the shading of the entire complex on building D, as showed in Figure 7.
43
Figure 7: Sun path simulation of the building
Thermal analysis of the chosen office were done for the base scenario, characterized by the single glazed window and without shading. Then the other two combinations were collected: the first one taking into account only the window replacement, the other one is the combination of the two smart solutions (new window plus shading). The Operative Temperature (OT) is chosen as the final output, able to show the difference between the solutions. Below are reported the results of the simulations carried out during four months: March, June, September, December (Figures 8,9,10,11).
44
Figure 9: Thermal results of June
45
Figure 11: Thermal results of December
In general, the first combination with window fixture’s more performance causes the increasing of the OT (about 1 °C), due to the low transmittance value of the new window. This issue is positive for the winter period (Figures 8,10), but for the summer one could be not suitable, especially during hot days (Figures 9,11). The shading placement is therefore essential for avoiding this problem and at the same time guaranteeing the indoor comfort. Moreover, the shading system allows to differentiate the thermal effects, maintaining the OT of the winter season aligned with the base scenario, but on the other hand allowing a sensible decrease of the OT during the hot season.
Finally, daylighting simulations were carried out to see the impact of the new shading. In line with this, illuminance levels in the base scenario (without the shading systems) are very high. An influence factor is the geometry of the space, where the relationship between the glass surface percentage and the width of the room is consistently high.
46
Figure 12: Illuminance levels before the interventions
It can be noticed that illimuminace values located near the window façade are quite similar in all the seasons; on the other hand, differences could be found in terms of daily lighting penetration inside the room. As showed in Figure 12, high illuminance levels are distributed in the total area of the room in December, since the sunbeams present a lower incline. An intermediate situation could be noticed during two months of March and September, where it is registered a similar illuminance level pattern inside the room. Finally, lower levels of illuminance are registered in June, since sunbeams are characterized by a consistent incline comparing to the other months.
In line with this, the horizontal shading system placement allows to decrease the illuminance values inside the room and to control lighting discomfort phenomena (e.g. dazzle). In general, results more efficient in term of illuminance levels reduction are registered in December, March and September (Figure 13).
47
Figure 13: Illuminance levels after the interventions
Moreover, this reduction is obtained near the window façade, where illuminance levels are lower than 2000 lumen, as showed in Figure 13.
1.8 Conclusions
This work aims to integrate a smart methodology, the IMM approach, providing a set of Composite Indicators (CIs) for assessing a global evaluation of the academic campuses. As exposed in this chapter, the university campus could be considered as a microcosm inside a macrocosm, as a small city in a metropolis. Therefore it is possible to adapt the concept of the Smart City to a Campus.
The definition of global performance indicators and their standardizations is the most relevance steps of IMM methodology, developed by the authors in previous researches. Then, those CIs indicators and methods for data standardization and aggregation have been applied to the engineering faculty of La Sapienza University, San Pietro in Vincoli (Rome) as a case study.


![Table 19: Indicators for the Sicilian District (from [80]) Indicators/ Actions A B C D E F H I J K EN1 1311 1297 1312 1294 1305 1306 1305 1311 1276 1298 EN2 26.4 26.1 0 26.40 26.10 26.30 26.30 26.30 26.40 25.70 26.10 EN3](https://thumb-eu.123doks.com/thumbv2/123dokorg/2885316.10761/64.892.124.773.163.676/table-indicators-sicilian-district-indicators-actions-en-en.webp)