UNIVERSITÁ DEGLI STUDI DEL MOLISE
Department of Agricultural, Environmental and Food Sciences
International PhD Course in:
AGRICULTURE, TECHNOLOGY AND BIOTECHNOLOGY
(CURRICULUM: ANIMAL WELFARE, BIOTECHNOLOGY AND QUALITY OF ANIMAL PRODUCTION) (CYCLE XXXI)
Related disciplinary scientific section: AGR/19 (Zootecnica Speciale) PhD Thesis
Effect of intramuscular vitamin E injection on performance, meat
quality and food safety of Cobb 500 broiler chickens reared under
Tropical climatic conditions
Coordinator of PhD Course: Prof. Giuseppe Maiorano Supervisor: Prof. Giuseppe Maiorano
Co-Supervisor: Dr. Siria Tavaniello Co-Supervisor: Prof. Archileo N. Kaaya
PhD Student: Acaye Ongwech 155849
i
DECLARATION
I ACAYE Ongwech, Registration number 155849, of the University of Molise (UNIMOL) – Italy, do solemnly declare that this was my own original work and that it has never before been presented for any award whatsoever in any University or Institution of higher learning worldwide. The production of this work has been under the close guidance and supervision of my supervisors named below.
Student: Signature……… Date ………... ACAYE Ongwech 155849 Supervisors 1. Signature ... Date ...
Professor Giuseppe Maiorano
2. Signature ... Date ...
ii
DEDICATION
To my late responsible parents who produced and struggled to raise me to the level when the good Lord eventually called both of you in succession, even before the struggle was halfway accomplished. I am very convinced he did that for a purpose; otherwise I would have loved to see both of you witnessing this later part of the struggle. However, he is the Lord and he is good all the time. I pray he continues to keep the souls of both of you, Abslom Ongwech and Yona Adong in high regards forever and ever.
iii
ACKNOWLEDGEMENT
I feel fully indebted to:
My supervisor Professor Giuseppe Maiorano who has been more than a Supervisor but rather a “father” to me away from home. His patience, tolerance, commitment, professional, humane attitude and conduct made me feel at home away from home. May God continue to bless you Professor!
My supervisor Dr Siria Tarvaniello who gave me an inestimable amount of technical, material and social support throughout the entire research process and my stay in Italy. Only the Good Lord can thank you more for such a commitment.
My supervisor Professor Archileo N. Kaaya of Makerere University, who ensured my training at Makerere Universiy went on under appropriate environment, close supervision and unimpeded. Professor, God should continue to guide you to guide others in a similar manner.
The Vice Chancelor and the Director, Institute of Research and Graduate Studies, Gulu University, for their contributions and for giving me study leave with pay for the entire study period that made life possible for my family even when I was away.
Technicians; Okalany Emmanuel of Makerere University and Kifuse Peter of Chemipha Research Laboratory – Kampala, for the technical advice and support accorded to me during the research, more especially during chemical analyses.
All the academic and non-academic staff of the Department of Agricultural Environmental and Food Sciences of the University of Molise, my course mates and friends within and outside Italy for the knowledge, cooperation and support extended to me throughout my academic pursuit of the course at the University.
My wife Joyce, children, other family members, friends and inlaws for their endless encouragement, prayers and support and for taking good care of the family while I was away.
iv TABLE OF CONTENTS DECLARATION ...i DEDICATION ...ii ACKNOWLEDGEMENT ... iii TABLE OF CONTENTS ... iv
LIST OF FIGURES ...viii
LIST OF ABBREVIATIONS AND ACRONYMS ... x
LIST OF APPENDICES ... xii
ABSTRACT ...xiii
RIASSUNTO ...xv
PART I INTRODUCTION AND LITERATURE REVIEW ... 1
Chapter 1 POULTRY MEAT: PRODUCTION, CONSUMPTION AND TRADE ... 1
1.0 Introduction ... 1
1.1 Poultry meat production ... 2
1.1.1 Global production ... 2
1.1.2 Production in Uganda ... 5
1.2 Global Poultry meat consumption ... 9
1.3 Trade of poultry meat ... 11
Chapter 2 POULTRY MEAT: QUALITY ATTRIBUTES ... 14
2.0 Introduction ... 14
2.1 Sensorial and eating quality ... 15
2.1.1 Appearance (Colour) ... 15
2.1.2 Texture ... 19
2.1.3 Flavour ... 21
2.2 Nutritional and chemical composition of poultry meat ... 23
2.2.1 Proteins ... 24
2.2.1.1 The sarcoplasmic and myofibrillar proteins ... 26
2.2.1.2 Stromal proteins (collagen, elastin) ... 27
2.2.2 Amino acids ... 31
2.2.3 Lipids ... 33
v
2.2.3.2 Metabolism of alpha-linolenic acid (ALA) ... 38
2.2.3.3 Metabolism of linoleic fatty acids (LA) ... 39
2.2.3.4 Dietary fatty acid ratios ... 40
2.2.4 Cholesterol ... 43
2.2.5 Vitamins and mineral elements ... 45
Chapter 3 INDICATORS OF POULTRY MEAT QUALITY DETERIORATION ... 49
3.0 Introduction ... 49
3.1 pH of poultry meat ... 49
3.2 Water holding capacity of poultry meat. ... 51
3.3 Lipid oxidation ... 58
3.4 Microbiological aspects of meat ... 62
Chapter 4 POULTRY MEAT PROCESSING, PAH GENERATION AND FOOD SAFETY ... 63
4.0 Introduction ... 63
4.1 Aromaticity and aromatic compounds ... 64
4.2 Polycyclic aromatic hydrocarbons (PAHs) ... 65
4.2.1 Historical perspectives of PAH carcinogenicity ... 65
4.2.2 Areas of application of PAHs ... 66
4.2.3 Mechanism of PAH formation during grilling of meat ... 67
4.2.4 Properties of PAHs ... 69
4.2.5 Priority Polycyclic Aromatic Hydrocarbons ... 70
4.3 Human exposure to PAHs ... 70
4.4 Meat consumption and carcinogenesis ... 71
4.5 Toxicokinetics of PAHs in mammals ... 73
4.5.1Absorption ... 73
4.5.2 Metabolism ... 74
4.5.3 Mode of action in carcinogenesis ... 77
4.5.4 Excretion ... 78
4.5.5 Effects of PAHs on health ... 79
Chapter 5 VITAMIN E ……….83
vi
5.1 Historical perspectives ... 83
5.2 Chemistry of vitamin E ... 85
5.2.1 Structure... 85
5.2.2 Stereochemistry of vitamin E ... 86
5.3 Sources and forms of vitamin E ... 88
5.4 Biological roles of Vitamin E ... 89
5.4.1 Vitamin E (-T),as an antioxidant ... 90
5.4.2 Other functions of vitamin E ... 93
5.5 Pharmacokinetics of Vitamin E ... 94
5.5.1 Absorption and Distribution ... 95
5.5.2 Metabolism ... 96
5.5.3 Excretion ... 96
5.5.4 Deficiency in Poultry ... 98
PART 2 RESEARCH WORK ... 100
Chapter 6 INTRODUCTION ………..100
Chapter 7 MATERIALS AND METHODS ... 103
7.1 Sampling and sample treatment ... 103
7.2 Slaughter surveys ... 104
7.3 Meat quality traits ... 104
7.3.1 Determination of pH ... 104
7.3.2 Determination of Water holding capacity ... 105
7.3.3 Determination of total lipids ... 105
7.3.4 Measurement of oxidative stability ... 106
7.3.5 Determination of Polycyclic aromatic hydrocarbons (PAHs) ... 107
7.3.5.1 Poultry meat processing ... 107
7.3.5.2 Reagents and Chemicals ... 107
7.3.5.3 Extraction ... 108
7.3.5.4 Sample clean-up ... 108
7.3.5.5 Gas Chromatographic analysis ... 109
7.4 Quality control ... 110
vii
7.4.2 Recovery Studies, Precision and Accuracy ... 111
7.4.3 Calibration of the Detector ... 112
7.5 Statistical analysis ... 112
Chapter 8 RESULTS AND DISCUSSIONS ... 114
8.1 Live weights and carcass traits of Cobb 500 broiler chickens ... 114
8.2 Physico-chemical properties of breast muscles of Cobb 500 broilers ... 115
8.3 Polycyclic aromatic hydrocarbon assay and food safety ... 119
8.3.1 Limit of detection and limit quantitation ... 119
8.3.2 Coefficient of determination, calibration range and recoveries. ... 120
8.3.3 Polycyclic aromatic hydrocarbon concentrations ... 122
8.3.4 Toxic equivalency as a measure of carcinogenic potency ... 126
Chapter 9 CONCLUSIONS ………...129
List of Publications ... 131
REFERENCES ... 132
viii
LIST OF FIGURES
Figure 1. 1 The ten leading EU countries in poultry meat production (2016) ... 4
Figure 1. 2 Cobb 500 broiler chicken ... 9
Figure 1. 3 Poultry meat production and consumption in selected countries ... 10
Figure 1. 4 Top ten countries importing poultry products ... 13
Figure 2. 1 Quality attributes of a food product ... 14
Figure 2. 2 The chemical structure of myoglobin ... 16
Figure 2. 3 Myoglobin redox forms in fresh meat ... 17
Figure 2. 4 Flavour perceptions ... 23
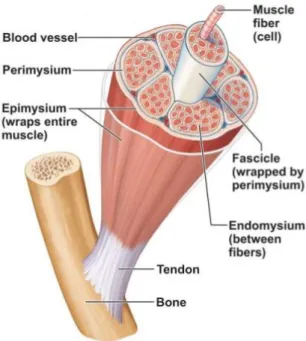
Figure 2. 5 Structure of a skeletal muscle ... 28
Figure 2. 6 The general structure of amino acids ... 31
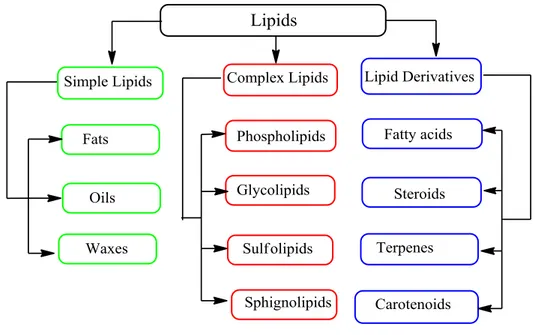
Figure 2. 7 Classification of lipids ... 34
Figure 2. 8 Two optical isomers of triglycerides ... 35
Figure 2. 9 Metabolism of essential fatty acids ... 39
Figure 2. 10 The chemical structure of cholesterol ... 44
Figure 3. 1 Forms of water in muscles ... 53
Figure 3. 2 Schematic of protein shrinkage by changes in pH ... 55
Figure 3. 3 Radical chain reaction mechanism of lipid peroxidation. ... 60
Figure 4. 1 Proposed resonance structures of Benzene ... 64
Figure 4. 2 Possible Pathways for the formation of BaP ... 69
Figure 4. 3 Molecular structures of the 16 priority PAHs ... 70
Figure 4. 4 Major routes for metabolic activation of BaP... 76
Figure 4. 5 BPDE-Guanine in DNA ... 77
Figure 5. 1 The chemical structure of Tocol ... 85
Figure 5. 2 The chemical structures of the tocopherols (I) and tocotrienols (II) ... 85
Figure 5. 3 Lipid peroxidation and vitamin E scavanging of free radicals ... 91
Figure 5. 4 Resonance stabilization of -tocopheroxyl radical ... 92
Figure 5. 5 The oxidation of -tocopherol ... 97
Figure 7. 1 Intramuscular vitamin E administration ... 103
Figure 7.2 Right and left pectoral muscles of a Cobb 500 broiler chicken……….105
Figure 7.3 The filter paper press method determination of WHC………..106
Figure 8. 1 Effects of vitamin E treatment on TBARS formation. ... 119
ix
LIST OF TABLES
Table 1. 1 Trends in the EU poultry meat production (2012 - 2016) by meat type ... 5
Table 1. 2 Advantages and limitations of backyard rearing and the local chicken breeds .... 7
Table 2. 1 Approximate composition of Poultry Meat (g/100 g) ... 24
Table 2. 2 Micronutrient contents of roasted breast of chicken pasture raised ... 46
Table 3. 1 Water distribution in muscle of live animal (pH ~ 7), meat (pH 5.3 – 5.8) ... 53
Table 5. 1 Nomenclature and substituents in vitamin E ... 86
Table 5. 2 Stereoisomers of α-tocopherol ... 87
Table 8. 1 Mean values for final live weights and carcass traits of Cobb 500 broilers...114
Table 8. 2 Mean values for pH, WHC and total lipids of breast muscle of Cobb 500 broiler chickens ... 116
Table 8. 3 Limits of detection (LOD) and Limits of quantitation (LOQ) ... 120
Table 8. 4 Percent recoveries, CoD and calibration range of the 6 PAHs ... 120
Table 8. 5 PAH concentrations and frequency of detection ... 123
Table 8. 6 Toxic equivalent factor PAH studied (Nisbet and LaGoy,1992) ... 127 Table 8. 7 PAHs mean content (µg/kg) and BaPeq in samples from groups C, T1and T2 . 128
x
LIST OF ABBREVIATIONS AND ACRONYMS
AKR Aldo keto reductase
α-TTP Alpha tocopherol transfer protein BaP Benzo(a) pyrene
BbF Benzo(b)fluoranthene BHA Butylated hydroxy anisole BHT Butylated hydroxy toluene BkF Benzo(k) fluoranthene BgP Benzo(g,h,i) perylene
BPDE Benzo(a) pyrene diol-epoxide
CO Carbonmonoxide
COMb Carboxymyoglobin DaA Dibenzo (a, h) anthracene
DB Data Bank
DD Dehydrodiol dehydrogenase DeoxyMb Deoxymyoglobin
DHA Docosahexaenoic acid DOC Day old chick
DPA Docosapentaenoic acid
EDTA Ethylene diamine tetra acetic acid EFAs Essential fatty acids
EPA Eicosapentaenoic fatty acid
EU European Union
FA Fatty acid
FAO Food and Agriculture Organization of the United Nations FCR Feed Convertion Ratio
GC Gas chromatography
GLM General Linear Model
Glu Glutamine
Gly Glycine
GSH-Px Glutathione peroxidase HDL High-density lipoprotein HLP Hydroxylysylpyridinoline
HMGR 3-hydroxy-3-methyl glutarylCoA reductase enzyme HPAI Highly Pathogenic Avian Influenza
HS92 Harmonised System (A commodity coding system formulated in 1992) IcP Indeno(1,2,3-cd)pyrene
Ile Isoleucine
IMC Intramuscular collagen
IMFNB Institute of Medicine Food and Nutrition Board LA Linoleic acid
LDL Low-density lipoprotein Leu’ Leucine
LOD Limit of Detection LOQ Limit of Quantitation LPL Lipoprotein lipase
Lys Lysine
Mb Myoglobin
xi MEG Marktbilanz: Eier und Geflügel
Met Methionine
MetMb Metmyoglobin
Mg Magnesium
MRP Maillard reaction products MUFAs Monounsaturated
NAGRIC National Animal Genetic Resources
NCBI National Center for Biotechnology Information. NRC National Research Council
OEC Observatory of Economic Complexity OxyMb Oxymyoglobin
PCI Product Complexity Index PFTBA Perfluorotributylamine PG Propyl gallate PGE2 Prostaglandin E2 Phe Phenylalanine PLA2 Phospholipase A2 Pro Proline
PSE Pale, Soft, Exudative PUFAs Polyunsaturated fatty acids ROS Reactive oxygen species
SAARI Serere Agricultural and Animal Research Institute
Se Selenium
SEM Standard Error Means
Ser Serine
SFAs Saturated fatty acids SOD Super-Oxide Dismutase TBA Thiobarbituric acid
TBARS Thiobarbituric Acid Reactive Substances TBHQ Tertiary Butyl Hydroquinone
TEF Toxic Equivalency Factor TEQ Toxic Equivalency USA United States of America
USEPA United States Environmental Protection Agency VLDL Very Low Density Lipoproteins
VOD Vegetable Oil Distillates WHC Water-Holding Capacity WHO World Health Organization WOF Warmed-over flavor
xii
LIST OF APPENDICES
Appendix 1 Calibration curve for Benzo(b)Fluoranthene ... 166 Appendix 2 Amendment of Annex to Regulation (EC) No 1881/2006 ... 166 Appendix 3 Indigenous chicken breeds in Uganda ... 168
xiii
ABSTRACT
An important issue in poultry farming is the increased susceptibility of the animals to oxidative stress related to the increasing genetic selection toward larger breast muscles, increased body weights, and faster growth rates. Vitamin E as a potent natural antioxidant, is a well-established micro-nutrient used in animal nutrition to sustain animal health and production, and to reduce the oxidative processes in meat. Studies have also reported inhibitory effects of vitamin E on formation of carcinogenic compounds during meat processing. However, these tests mainly involved the less standardised inclusion of vitamin E in animal feeds or the topical application of vitamin E for marination of meat. The present study, therefore, aimed at assessing the effect of intramuscular vitamin E injection on growth performance, meat quality and safety of processed meat of Cobb 500 broiler chickens reared under tropical conditions in Uganda. The study was carried out in a small chicken farm in Uganda. Thirty, 28d old Cobb 500 chicks were randomly assigned to 3 treatment groups (5 replications/group), which were intramuscularly injected on left pectoral muscle with 0.25 mL (12.5 IU) (T1) and 0.5 mL (25 IU) (T2) of dltocopheryl acetate (50 mg/mL), and 0.5 mL of physiological saline (C). At 42d, birds were individually weighed, slaughtered and the pectoral muscle (PM) was removed for the analyses regarding physico-chemical properties, oxidative stability and detection and quantification of carcinogenic compounds. Data were analyzed by one-way ANOVA. Data for concentration of polycyclic aromatic hydrocarbons (PAHs) that did not meet the assumptions for ANOVA were analyzed using the Kruskal Wallis H test. The results indicate that i.m. vitamin E injection did not have significant effect on the final live weights of the birds. However, carcass yield was higher (P < 0.01) in T2 (71%) and T1 (69%) groups compared with C group (64%). The weights and yields of the main commercial cuts were similar among groups. Ultimate pH of PM was not significantly affected by vitamin E treatment; while higher doses of vitamin E (T2) improved the water
xiv
holding capacity of PM (P<0.01). Total lipids, ranging from 2.13% to 2.25%, were similar among groups. In general, vitamin E treatment improved the oxidative stability of PM; the levels of TBARS were lower (P < 0.05) in T2 (0.037 mg MDA/kg) than in C group (0.046 mg MD/kg). The mean concentrations (g/kg) of PAHs formed in grilled meat were in the range: 0.30 – 1.55 for Benzo(a) pyrene, 0.37 – 2.54 for Benzo(b) fluoranthene, 0.80 – 1.19 for Benzo(g,h,i) perylene, 0.89 – 1.97 for Benzo(k) fluoranthene, 0.94 for Dibenzo(a, h) anthracene and 1.18 – 1.57 for Indeno (1,2,3-cd) pyrene. This research has shown that whereas there appears to be no significant effect of the treatment with vitamin E on formation of PAHs during grilling of broiler PM, an apparent trend towards inhibition of the formation of these carcinogenic compounds appeared to have emerged. This was evidenced by the fact that more of the compounds were detected in C as opposed to the vitamin E injected groups. The results from the Toxic Equivalent computation also revealed that the concentrations of the compounds detected were within the tolerable limit set by EU Regulation 835/2011 still in force. It should be noted that this attempt to investigate the inhibitory effect of i.m vitamin E injection on the formation of carcinogenic compounds in broilers has been probably the first; therefore, further research is required to obtain more information, regarding also the adequate dose of vitamin E to be injected.
xv
RIASSUNTO
L’intensa selezione genetica ha consentito negli anni di ottenere polli sempre più pesanti nel minor tempo possibile, rendendo gli animali maggiormente suscettibili allo stress ossidativo. La vitamina E, un potente antiossidante naturale, è un micronutriente utilizzato nell'alimentazione animale per migliorare lo stato di salute e la qualità delle produzioni, nonché per ridurre i processi ossidativi nella carne. Recenti studi, hanno dimostrato come la vitamina E, attraverso la marinatura della carne, sia in grado di inibire la formazione di composti cancerogeni in seguito a cottura ad elevate temperature. Il presente lavoro di tesi ha inteso valutare gli effetti della somministrazione di vitamina E per via intramuscolare sulle performance di crescita, sulle caratteristiche qualitative della carne e sulla formazione di sostanze cancerogene nella carne di polli Cobb 500 allevati in condizioni di clima tropicale in Uganda. Al 28° giorno d’età, 30 polli Cobb 500 sono stati suddivisi a random in 3 gruppi sperimentali (5 replicazioni/gruppo) trattati per via intramuscolare (muscolo pettorale sinistro) con: 0.25 mL (12.5 UI) (T1) e 0.50 mL (25 UI) (T2) di dl- α-tocopheril acetato (50 mg/mL), e 0.50 mL di soluzione fisiologica (C). Al 42° giorno d’età, i polli sono stati pesati, macellati e il muscolo pettorale è stato prelevato per le analisi riguardanti le proprietà fisico-chimiche, stabilità ossidativa e formazione di sostanze cancerogene. I dati ottenuti sono stati analizzati mediante ANOVA ad una via. I dati riguardanti la concentrazione delle idrocarburi policiclici aromatici (IPA) non rientranti nelle assunzioni dell’ANOVA sono stati analizzati mediante test di Kruskal Wallis. Il trattamento non ha avuto alcun effetto (P > 0,05) sul peso finale degli animali; tuttavia, i polli dei gruppi trattati hanno mostrato rese in carcasse maggiori (T2: 71% e T1: 69%; P < 0,01) rispetto al gruppo C (64%). Il peso e la resa dei principali tagli commerciali sono risultati simili tra i gruppi sperimentali. Il pH ultimo non è stato influenzato dal trattamento; mentre, la dose più alta di vitamina E (T2) ha determinato un aumento della capacità di ritenzione idrica del petto (P < 0,01). Il contenuto di lipidi totali (2,13 - 2,25%) è
xvi
risultato simile tra i gruppi sperimentali. I livelli di TBARS (mgMDA/kg) sono risultati inferiori (P<0,05) nel gruppo T2 (0,037) rispetto al gruppo C (0,046). Le concentrazioni medie (µg/kg) di IPA formatesi durante la cottura alla griglia della carne rientravano nei seguenti range: 0,30 – 1,55 Benzo(a)pirene, 0,37 – 2,54 Benzo(b)fluorantene, 0,80 – 1,19 Benzo(g,h,i)perilene, 0,89 – 1,97 Benzo(k)fluorantene, 0,94 Dibenzo(a,h)antracene e 1,18 – 1,57 Indeno(1,2,3-cd)pirene. Questa ricerca ha dimostrato che, nonostante il trattamento con vitamina E non abbia avuto alcun effetto statisticamente significativo sulla concentrazione degli IPA, è evidente una tendenziale inibizione della formazione di questi composti in seguito a cottura della carne. Questa assunzione deriva dal fatto che la maggior parte dei composti sono stati rilevati nel gruppo C e non nei gruppi vitamina E. I dati relativi alla tossicità equivalente hanno evidenziato che le concentrazioni dei composti rilevati rientrano nei limiti di legge in vigore (Reg. UE 835/2011). Lo studio sull'effetto dell'iniezione intramuscolare di vitamina E sulla formazione di composti cancerogeni nei polli da carne è stato probabilmente il primo; sono quindi necessarie ulteriori ricerche per ottenere maggiori informazioni, anche riguardo alla dose adeguata di vitamina E da iniettare.
1
PART I INTRODUCTION AND LITERATURE REVIEW Chapter 1
POULTRY MEAT: PRODUCTION, CONSUMPTION AND TRADE
1.0 Introduction
The term Poultry refers to domesticated birds kept by humans for production of eggs, for their feathers, meat and organs. Whereas many people normally tend to think of the term as referring to chickens, it is broader and includes other birds like turkeys, geese, ducks, quails, pigeons, ostriches and others (The American Heritage, 2009). Poultry make quite a substantial contribution to food security and nutrition, providing energy, proteins and essential micronutrients to humans. This is possible because of the short production cycles and the ability to convert a wide range of agri-food by-products into meats and eggs for human consumption (Mottet & Tempio, 2017). Poultry is the fastest growing agricultural subsector, especially in developing countries where there is a faster rate of growth in both population and economy than in developed countries. To meet growing demand, world poultry meat production soared from 9 to 120 million tonnes between 1961 and 2016, and egg production shot up from 15 to 81 million tonnes. In 2016, poultry meat represented about 36 percent of global meat production. In the last three decades, world egg production has increased by more than 150 percent. Much of this growth has been in Asia, where production increased almost fourfold (FAO, 2018).
The global human population is expected to reach 9.6 billions in 2050 with 82% expected to come from developing countries as opposed to only 79% in 2000. Further, it is projected that approximately 70% of these people shall be living in urban areas. On the other hand, income is expected to increase by 2% per year over the period to 2050. Consequently, Alexandratos & Bruinsma, (2012) projected that the demand for animal source food could
2
grow by 70% between 2005 and 2050 with poultry meat expected to have the highest growth of about 121%. The global poultry sector is expected to continue to grow as demands for meat and eggs continue to rise. The fact that poultry can be managed by almost all sectors such as small holders, the poor rural and peri-urban population, and also in large scale intensive production systems accounts for its faster growth rate (Mottet & Tempio, 2017). The average annual growth rate over the last 5 decades was 5% while it was only 1.5% for beef, 3.1% for pork and 1.7% for small ruminants’meat (Alexandratos & Bruinsma, 2012).
World meat consumption according to OECD and FAO (2014) projection is expected to average 36.3 kg per person per year in retail weight by 2023; an increase of 2.4 kg compared with the figure for 2013. Some 72% of the increased consumption will come from poultry. The report further states that the high feed conversion ratio, short production cycle and simple production process makes poultry the low cost alternative which consumers in developing countries demand first as their income levels rise. Summarily, the current and expected increase in poultry production and consumption are primarily linked to key factors of population growth, urbanization, improvements in incomes, lower costs of production, the lower poultry meat prices relative to those for competitive meats, dietary preference, general acceptability across religions and cultures as well as consumer sentiments related to health, the environment and convenience (Marangoni et al., 2015; Mutryn et al., 2015).
1.1 Poultry meat production
1.1.1 Global production
Global poultry meat production has been on the rise and increased from approximately 54.2 million tonnes in 1995 to 107.0 million tonnes in 2013 (FAO, 2014); reached a high of about 116 million tonnes in 2016 (GLEAM 2, 2016) and is expected to increase by over 181 million tonnes by 2050 (Alexandratos & Bruinsma, 2012). Worldwide, no other agricultural product has reached such a remarkable relative growth rate. Among the factors that were
3
cited as responsible for the poultry sector growth include technological changes in production practices (Mottet & Tempio, 2017). Thus, the move from free-ranging to confined poultry operations dramatically increased the number of birds per farmer, facilitated the substitution of capital for labour, and led to a significant increase in labour productivity. Other factors included advances in breeding to improve animal size, fecundity, growth rate and uniformity, improved disease control and biosecurity measures (Thornton, 2010).
Production has been particularly dynamic in developing countries, especially in East and South East Asia with an annual growth rate in poultry meat production of 7.4% (FAOSTAT, 2016) and also in South America. In 1970, only two of the ten leading countries were developing countries, and only China and Japan, were located in Asia. With a share of almost 31%, the USA dominated this branch of poultry production. In 2005, five of the ten leading countries were developing countries and four were located in Asia. The United States were still in the top position with a share of 22.9%, but China and Brazil now ranked as number two and three. The regional concentration slightly decreased from 68.4% to 66.3% as a result of the growing importance of poultry meat production in several other countries (Windhorst, 2018).
Among countries currently leading in poultry meat production are the United States of America (~20 million tonnes), China (~18 million tonnes), European Union (EU), (~13 million tonnes), Brazil (~13 million tonnes) (Bedford et al., 2017). The US leads in the production due mainly to technological advancement, the ability and also the willingness to purchase the poultry meat. China is second to the U.S., and its production is increasing. While China is a relatively poor country, its population is more than 1 billion, and its people eat chicken whenever it is available. Even small increases in per-capita consumption in China cause large changes in demand for chicken. Brazil, which is the third-largest poultry producer, is a major player in the world poultry market. It has the needed grain production to feed
4
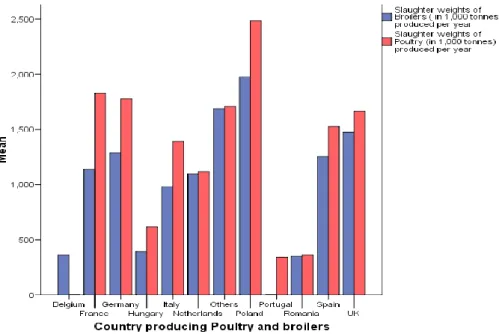
chickens and has an ample supply of labour to grow and process the birds. It also has access to the same technology found in U.S. plants (Bedford et al., 2017). For the EU that also has the technology and expertise, in 2016, ten countries alone contributed 88.5% of the total tonnage of poultry meat per year within the union (Figure 1.1)
Figure 1. 1 The ten leading EU countries in poultry meat production (2016) Based on Data supplied by MEG 2017
Figure 1.1 indicates that, whereas Poland maintained its lead in the production of both poultry meat in general and broiler meat in particular, UK surpassed France and Germany when only broiler meat production was considered. Spain also surpassed France and the Netherlands ranked before Italy. Romania that did not feature among the top ten EU poultry meat producing countries, replaced Portugal in tenth position when only broiler meat production was considered. The four leading countries contributed 49.9% broiler meat production while the top four countries (Germany, 19.4%; France, 17.7%; Poland, 17.4% and Italy, 15.6%) contributed 70.1% of turkey meat production in 2016 (Windhorst, 2018).
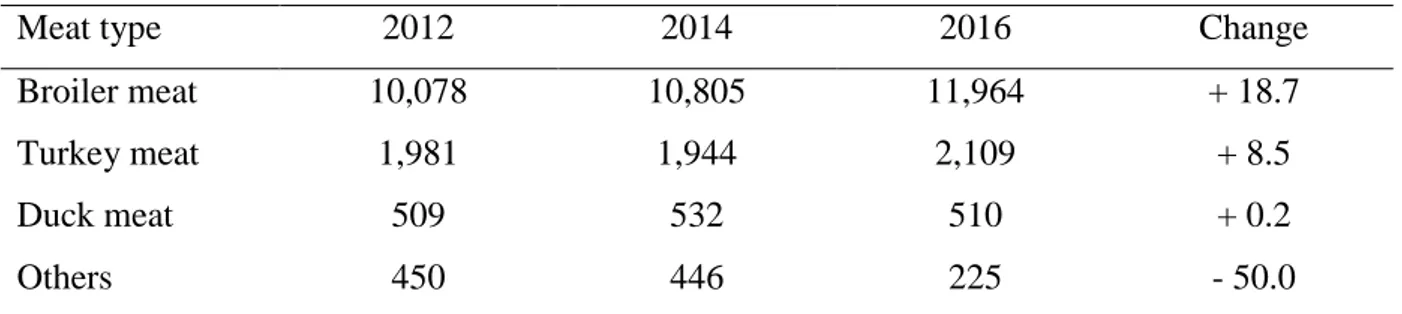
Between 2012 and 2016, EU poultry meat production increased by almost 1.8 million tonnes or 13.8%. To this growth, broiler meat contributed 1.9 million tonnes. The absolute growth of this meat type was higher than the increase of total poultry meat because the production of other poultry meat types decreased. Turkey meat production grew by 6.5%
5
while duck meat remained on a more or less constant level (Table 1.1). In 2016, broiler meat alone constituted 81%, turkey 14%, duck 3% and other poultry types 2% in the EU countries (Windhorst, 2018).
Table 1. 1 Trends in the EU poultry meat production (2012 - 2016) by meat type
Meat type 2012 2014 2016 Change
Broiler meat 10,078 10,805 11,964 + 18.7
Turkey meat 1,981 1,944 2,109 + 8.5
Duck meat 509 532 510 + 0.2
Others 450 446 225 - 50.0
Source: MEG 2017 as reported in Windhorst,( 2018). (Data in 1,000 t)
Whereas it still remains the fastest growing agricultural subsector, poultry meat production is projected to increase at a slower rate than in the past decades. By 2050, its annual growth rate is estimated to reach 1.8% at global level, and 2.4% in developing countries (Mottet & Tempio, 2017).
1.1.2 Production in Uganda
In Uganda especially in the rural areas, a large number of people do not have an adequate and regular intake of animal proteins. According to a report of the Livestock Services Project by the Agricultural Secretariat of the Bank of Uganda (1989), animal protein formed only about 3% of the diet of the population. In rural areas, even in homes where cattle are available, tradition, and the fear of depleting the stock have limited the number and rate of slaughter for meat consumption, while in urban areas, the socio-economic problems and the high cost of meat have denied many families access to this source of animal proteins (Ojok, 1993). Consequently, many people in both the rural and urban areas have resorted to poultry production; which provides a relatively cheaper and quicker access to animal proteins through the production of eggs and table birds. The increased production of the birds in addition improves the economic status of the farmers (Ojok, 1993).
6
Poultry meat production in Uganda by 2014 stood at 54,868 metric tonnes and is projected to increase to 63,647 metric tonnes in 2020 with the greatest percentage comprising chickens (MAAIF, 2016 unpublished). Over 86% of these are chicken breeds that are indigenous varieties in village flocks that are low-maintenance scavengers living in close proximity to their owners in small rural communities under the backyard system (Kugonza et al., 2008). These local chickens are predominant in villages despite the introduction of exotic and crossbred types, because farmers have not been able to afford the high input requirements of introduced breeds. However, cross breeding of local chickens with exotic chicken breeds has also been taking place and it is common to find mixed breeds as a result of target improvement programmes by different organisations such as the SAARI chicken breeding project or on individual level (Sorensen & Ssewanyana, 2003).
It is worth noting that the genetic resource base of indigenous poultry in Uganda is rich and has great potential for genetic improvement and diversification to produce well adapted breeds that can be used in genetic improvement programmes for tailored production systems. However, information on the genetic make-up of the indigenous poultry in Uganda is very limited. Although efforts for genetic preservation and biodiversity was planned by the National Animal Genetic Resources and Data Bank (NAGRIC & DB), this has not yet been fully implemented (Ssewannyana et al., 2003). On the other hand, the continued cross-breeding programmes in rural poultry which do not consider gene preservation aspects may lead to the erosion of the indigenous germplasm (Byarugaba, 2007).
Village flocks range from 5 to 20 birds per household, with an overall national average of 12 (Kugonza et al., 2008) although there is wide regional variation. The average egg production reaches 40 eggs per hen per year while the average rooster weight at the time of sale or consumption ranges from 1- 2 kg. This is suitable for the rural consumers who neither desire nor can afford larger birds. The birds exhibit a wide phenotypic variability in plumage,
7
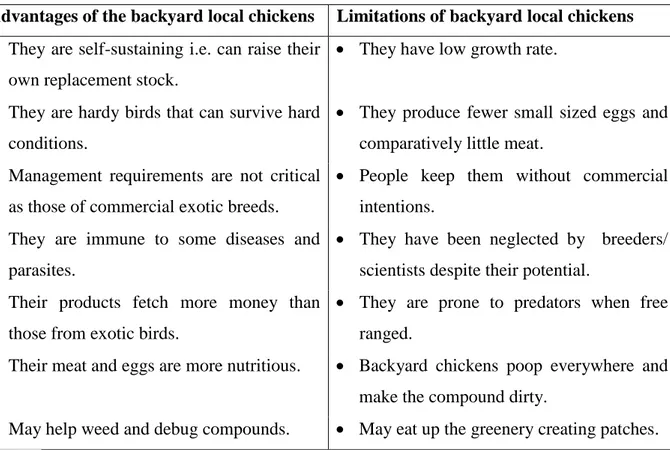
shank, eye, earlobe, comb, feather distribution and body size (Byarugaba & Katunguka-Rwakishaya, 2002; Ssewannyana et al., 2003) (Appendix 3). The local breeds and the backyard rearing systems have a number of advantages and limitations as shown in Table 1.2
Table 1. 2 Advantages and limitations of backyard rearing and the local chicken breeds
Advantages of the backyard local chickens Limitations of backyard local chickens
They are self-sustaining i.e. can raise their own replacement stock.
They have low growth rate. They are hardy birds that can survive hard
conditions.
They produce fewer small sized eggs and comparatively little meat.
Management requirements are not critical as those of commercial exotic breeds.
People keep them without commercial intentions.
They are immune to some diseases and parasites.
They have been neglected by breeders/ scientists despite their potential.
Their products fetch more money than those from exotic birds.
They are prone to predators when free ranged.
Their meat and eggs are more nutritious. Backyard chickens poop everywhere and make the compound dirty.
May help weed and debug compounds. May eat up the greenery creating patches. Practices vary, but the birds are generally either raised by the women and girls of individual families or, in rare cases kept by rural cooperatives (Byarugaba, 2007). Village chickens also fulfill a range of other functions for which it is difficult to assign a monetary value. They are active in pest control, provide manure, are required for special festivals and to meet social obligations; are essential for many traditional ceremonies (for example slaughter for important guests) and traditional and “spiritual” treatment of illnesses and rituals (Byarugaba, 2007).
The remaining 14% are exotic type chickens raised in commercial units close to towns and urban markets. Producers in this production system aim at using the recommended standard practices, such as breed of choice depending on production objectives, appropriate
8
housing, feeding and health and disease control programmes. The system can be classified into the following categories based on scale of production:
Small-scale units categorised under FAO Sector 3. Mainly household/family owned farms of 100 – 500 layers or broilers or indigenous chickens.
Medium-scale units owned by individuals, companies or farmers’ groups, with a capacity of between 500 – 5,000 layers or broilers and therefore more specialised in terms of production. This category also includes farms with a small parent breeding stock and hatching facilities. Bio-security levels are low at these units and they would also be categorised as FAO sector 3.
Large scale units which are mainly breeders with hatching facilities and a capacity of over 5,000. These would be categorised as FAO Sector 2.
Breeding farms (hatcheries) whose main commercial activity is keeping parent stocks and selling of DOCs. Almost all of them will also be involved in keeping commercial layers or broilers as well (Byarugaba, 2007).
The most common exotic breeds in Uganda include Cobb 500, Cobb 700, Ross 308, Ross 208 and the newly introduced Kuroilers. Cobb 500 is a tetralinear hybrid produced by Cobb Breeding Company from the United Kingdom, being sexable at age of one day after primary remiges’ development. It is characterized by a great chest weight, broiler uniformity and increased slaughtering efficiency (Figure 1.2). Compared to Ross 308 hybrid, Cobb 500 is pretentious to breeding conditions and less pretentious to fodder quality, and for that to express the genetic potential there must be provided the microclimate parameters at optimal level (Pasca et al., 2008). The name for the Cobb 500 actually came from a remark by Robert
Cobb Junior who felt the new bird would be five times better than the Cobb 100 that had been the company’s mainstay for many years. Lowest feed conversion together with the ability of the Cobb 500 to thrive on lower density amino acid, less expensive feed, excellent growth
9
rate, broiler uniformity for processing and being a competitive breeder reduces the cost of producing chicken meat without affecting performance. This is what many low income farmers in developing countries advocate for.
Figure 1. 2 Cobb 500 broiler chicken
Source: http://www.cobb-vantress.com/products/cobb-500
1.2 Global Poultry meat consumption
The poultry sector has been the most dynamic meat sub-sector in the last decade, showing the greatest growth of all meat sectors as reflected in world consumption. Poultry meat remains the most produced meat in terms of metric tonnes, lead by the United States of America, China and Brazil. According to a recent FAO report, the poultry sector modestly expanded coming in at 120.5 million metric tonnes in 2017 and fore cast at 122.5 metric tonnes in 2018, representing a change of 1.6% between 2017 and 2018. The FAO report further states that poultry has been the meat with the largest production since 2016. For another year, developing countries (categorized based on GDP, per capita income and industrialization), captured the majority of poultry meat production and consumption in 2017. Although production has slowed, changing pattern of feeding in developing countries continue to increase poultry production world wide. The United States of America, China and
10
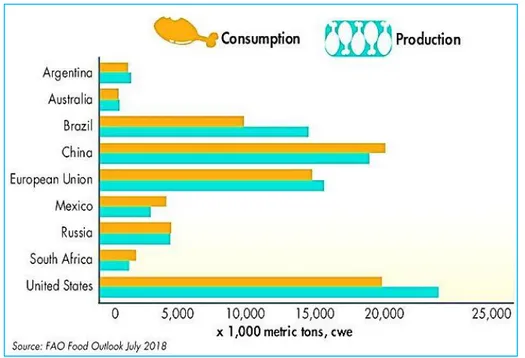
Brazil remain the leading countries in poultry meat production with the 2018 figures for those countries forecast by FAO at 22.35, 17.81 and 13.74 million metric tonnes respectively. The other notable countries are the European union, Russia and Mexico (Figure 1.3)
Figure 1. 3 Poultry meat production and consumption in selected countries
The shift in dietary patterns in developing countries have resulted in world meat consumption average of 34.3 kg/person/year over the average base period 2015 -2017 and will continue to grow slowly as population growth slows down by about 1 kg over the next decade to about 35.4 kg/person/year by the end of 2027. Of this consumption, poultry sits at 13.91 kg/person/year for the base period 2015 – 2017, rising only subtly to 14. 70 in 2027 (OECD/FAO, 2017).
The most evident growth of poultry meat consumption was observed in East and Southeast Asia and in Latin America, particularly in China and Brazil. According to the report of OECD/FAO, (2018), the past decade saw strong growth in the global per capita consumption of poultry (+16%), while the per capita consumption of beef and veal decreased by almost 5% between 2008 and 2017. In 2017, the top 10 countries in per capita poultry meat consumption (kg/person/year), according to the report were; Israel (56.93), USA (48.83),
11
Saudi Arabia (44.67), Australia (44.47), Malaysia (41.69), Brazil (39.90), Peru (38.24), Newzealand (37.86), Argentina (47.51) and Canada (34.89).
On the African continent, the report further states that South Africa (32.49) was ranked 12th while on the lower end of the scale were notably African countries; Sudan (0.00098), Rwanda (0.200), Chad (0.400) and Kenya (0.600). Moreover earlier reports by Narrod & Tiongco, (2012), estimated that consumption of poultry meat in developing countries will increase until 2030 by 3.5% per annum. The per capita income growth in developing countries adds to the consumption of each person. The main impetus for consumption growth will come from developing countries since their per capita income growth rate is expected to be higher. In addition, poorer people tend to spend much of their additional income on food (i.e. they have higher income elasticity of demand for food). For example according to the OECD/FAO, (2016) report, the share of additional income that will be spent on food in China and the United States of America in 2025 is projected to correspond to 3.4% of the income increase in China and only 1.1% of the income increase in the United States of America.
Several researchers have evaluated the factors responsible for meat consumption.The majority of them reported on tastes, prices, product consistency, income levels, household size, education and health consideration as the major factors (Antwi-Boateng et al., 2013; Damisa & Hassan, 2009; Reicks, 2006). These authors also observed that generally demographic variables such as gender, age and religious beliefs significantly affect the attitude of consumers towards the purchase of meat; factors which must be taken into consideration by meat producers and marketers.
1.3 Trade of poultry meat
Poultry meat is the 137th most traded product and the 672nd most complex product out of 1,238, according to the Product Complexity Index (PCI) and is a 4 digit HS92 product
12
product traded, representing 43%, followed by bovine, pig and ovine meat, respectively (FAO, 2014). Poultry meat is traded as raw meat and in the majority of cases as cuts (parts) rather than the whole carcasses; a trade system that makes poultry meat more accessible to the average consumer in low income countries (Josling etal., 2001). Moreover, even in developed countries, consumer eating habits have shifted to poultry breast and thigh meat and, to a lesser extent, drumsticks (Da Silva, 2013). Of late poultry meats are also increasingly being sold in fried, steamed, or roasted forms that are usually packaged “ready-to-eat”, and shipped frozen. Consumer demands for these types of prepared food are rapidly increasing especially in developed countries (Nicita, 2008).
According to Nicita, (2008), poultry trade is often subjected to substantial tariffs often on a preferential basis, and non-tariff measures such as veterinary certification, licensing, product characteristic requirements and quotas. These policy instruments help shape bilateral trade flows by limiting imports but may sometimes also favour only determined countries.
According to the FAO, (2018) report, world poultry meat exports reached 13 million tonnes in 2017, up 2.8% from 2016. While Brazil, the United States, the EU and Thailand continued to dominate export markets, most of the increase in shipments in 2017 originated in the United States (+3.1%), Turkey (+33.6%), Thailand (+10%), China (+15%), the Russian Federation (+40.7%) and the EU (+2.5%). The US benefitted from its HPAI-free status and strong import demands from Mexico, China, Cuba, Canada and Angola. The expansion in Thailand was driven by demand for value-added ready-to-eat products in world markets, especially in Japan.
Despite the import bans by key trading partners in response to HPAI outbreaks, EU poultry exports expanded mainly due to the resilience of the sector and the capacity to contain the spread and to identify new markets. In contrast, Brazil’s exports slipped by 2 percent in 2017 to 4.3 million tonnes but continued to be the world’s largest poultry meat exporter.
13
Brazil shall continue to benefit from demands in its key Middle East markets due to the ability to adapt to new Saudi Arabian market conditions of non-stun slaughter (USDA, 2018).
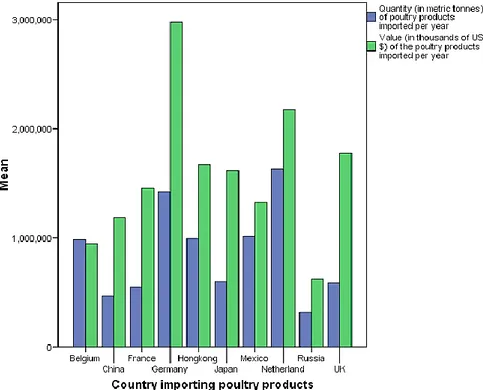
The top ten importers of poultry meat and poultry meat products by quantity and by value are shown in Figure 1.4; which indicates that, there is variation in the ranking by quantity imported and by value of the import. When quantity is used for ranking, Netherlands tops the list followed by Germany and Mexico in that order. The other seven countries follow in the order; Hongkong, Belgium, Japan, UK, France, China and Russia. While if the value (in thousands of US $) of the products imported is used as the basis for ranking then Germany tops the list and the rest follow in the order: Netherland > UK > Hongkong > Japan > France >Mexico > China >Belgium >Russia.
Figure 1. 4 Top ten countries importing poultry products
14
Chapter 2
POULTRY MEAT: QUALITY ATTRIBUTES 2.0 Introduction
The term quality as relates to poultry meat is difficult to define because quality is 'in the eye of the beholder'. For example, someone trying to sell a product might view its quality in terms of how well it sells and how much people are willing to pay for it. However, this definition is incomplete because it does not consider the product's character. Since people only buy what they like, the consumer's perspective of quality is more appropriate. When consumers buy a poultry product, cook and serve it to their families, they expect it to look, taste and feel good in their mouth. If these characteristics do not meet the consumer's expectation, the product is considered to be of lower quality (Julie, 1997). From the point of view of the consumer, meat quality may be categorised based on the following attributes:
Figure 2. 1 Quality attributes of a food product Adopted from Erdtsieck, (1989)
15
2.1 Sensorial and eating quality
A number of meat quality traits are necessary to arouse and sustain interests in the consumer of poultry meat. These traits include those concerned with visual, olfactory and general palatability attractions; and include:
2.1.1 Appearance (Colour)
Appearance is among the most critical judgement criteria consumers use while selecting food items, including poultry products for purchase. Appearance is also critical for the final product evaluation due to its effects on other sensory properties. One of the major contributing components of appearance is colour. Colour has long been used as a yardstick for both freshness of meat as well as the ability of the meat to offer the final product satisfaction (Fletcher, 1999). Poultry meat is sometimes sold with the skin and bone intact and as such, colour is important for the skin, the meat, and the bone. Skin colour is most critical for the marketing of fresh whole birds or parts. Meat colour is most important both for the selection of deboned and skinless raw meat. It is as well a critical factor for the final evaluation of many cooked products. Pink or red appearance of cooked poultry meat is generally associated with undercooking and is highly undesirable. Dark or black bones are also considered to be a defect in fully cooked products. Bone darkening is primarily associated with frozen products prior to cooking. Other visual defects are associated with bruises, haemorrhages, blood pooling and a number of other possible variation factors (AMS, 1995).
Poultry meat colour is affected by factors such as the bird’s age, sex, strain, diet, intramuscular fat, meat moisture content, pre-slaughter conditions and processing variables. Colour of meat depends upon the presence of the muscle pigment myoglobin. Differences in the colour intensity of poultry meat can be related to the amount of this pigment that is present in the meat, the chemical state of the pigment, or the way in which light is reflected off the meat. The change in colour intensity can occur in an entire muscle, or it can be limited to a
16
specific area, such as a bruise or a broken blood vessel. When colour of an entire muscle changes, it is frequently the breast muscle; being the one that accounts for upto about 5% of the live weight; more sensitive to factors that contribute to changes in colour intensity, and because its already light appearance makes small changes in colour more noticeable.
Extreme environmental temperatures or stress due to live handling before processing can cause changes in broiler meat colour; the extent of which is related to the bird's individual response to the conditions and is normally brought about by the activity of the sarcoplasmic myoglobin, (Figure 2.2), which is species specific (Surendranath & Poulson, 2013).
Figure 2. 2 The chemical structure of myoglobin Adopted from Chaijan, (2008)
Naturally fresh meat can be classified as red or white depending on the concentration and extent of oxygenation of myoglobin in the muscle fibres (Wang et al., 2012). The more myoglobin molecules meat contains the more intense the red colour shall be. Myoglobin content is higher in beef and lower in poultry with lamb and pork having intermediate amounts. The interaction of myoglobin with oxygen and carbonmonoxide, the change in oxidation states of the haeme iron, resulting into the different states of myglobin and hence the different colours of meat during aging or processing was summarised by Mancini & Hunt, (2005) as seen in Figure 2.3.
17
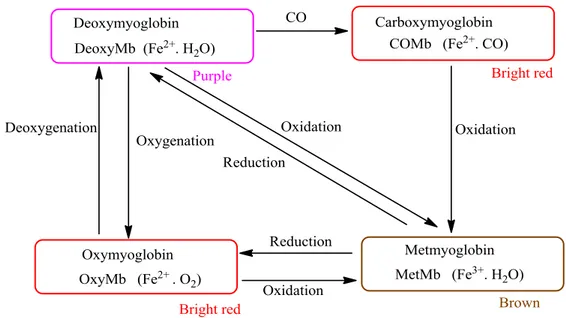
Figure 2. 3 Myoglobin redox forms in fresh meat From Mancini & Hunt, (2005)
DeoxyMb, OxyMb, and COMb are in a ferrous state. Saturating Mb with oxygen provides attractive cherry-red colour to meat through formation of OxyMb. OxyMb and COMb provide bright cherry-red colour critical to acceptance, and the red colour of these two redox forms is indistinguishable by human eyes (Cornforth & Hunt, 2008). Both OxyMb (542 and 582 nm) and COMb (543 and 581nm) have twin peaks at those close wavelengths (Tang et al., 2004). They can only be distinguished due to the fact that the peak at the 580-nm region has the greatest magnitude in OxyMb, whereas the peak at the 540-nm region is the predominant one in COMb (Suman et al., 2006). DeoxyMb is purplish-red in colour. Mb has a greater affinity to CO than to oxygen, resulting in the increased stability of bright cherry-red COMb. Formation of brown MetMb results from the oxidation of the three ferrous forms to a ferric state and is associated with a decrease in the colour intensity of meat. MetMb has a water molecule at the sixth coordinate of the ferric haeme and is incapable of binding oxygen (Claus, 2001). DeoxyMb exhibits a strong absorption maximum at 557 nm, but MetMb exhibits a peak at 503 nm and the two can therefore be easily distinguished (Tang et al., 2004) During processing of meat through methods such as smoking, drying, salting, curing, fermenting, pickling, cooking and forming, the colour of meat changes. When dark meat is
18
cooked, myoglobin’s colour changes depending on what the meat’s interior temperature is. Rare beef is cooked to 60oC, and myoglobin’s red colour remains unchanged. Above 60oC, myoglobin loses its ability to bind oxygen, and the iron atom at the centre of its molecular structure loses an electron, converting from Fe2+ to Fe3+. This process forms a tan-coloured compound called hemichrome, which gives medium-done meat its colour. When the interior of the meat reaches 70oC, hemichrome levels rise, and the myoglobin becomes metmyoglobin, which gives welldone meat its brown-gray shade (Claus, 2001)
Several researchers who studied the variations in meat colour have attributed such variations to factors such as heat (Claus, 2001), sex (Damaziak et al., 2013), fibre composition (Listrat et al., 2016), diet (Küçükyılmaz et al., 2012) and genotype (Le Bihan-Duval et al., 1999). Research has shown that, in birds myoglobin and hemoglobin levels are lowest in the glycolytic muscles, Pectineus and P. superficialis, and highest in the oxidative adductor muscles and the heart and this explains the differences in the colours of these muscle types (Kranen et al., 1999). The consumption of carotenoids in green leaves and folliages has also been reported to be responsible for the yellowess of the skins and meats of birds reared outdoors (Küçükyılmaz et al., 2012).
According to Sirri et al., (2009), the sex of the bird affects the colour of poultry meat. Generally the meats of hens have been reported to be lighter than those of cocks. This they said may be attributed to differences in the metabolism of muscle fibres, which is affected by sexual hormones. In support of this view was the fact that these authors demonstrated that there were significantly higher values of yellowness (b*) and lower values of lightness (a*) in muscles of caponized male chickens compared to testosterone-producing males.
Colour measurements of meat is nowadays based on the Commission Internationale de l’Eclairage (CIE), L*a*b* scale, released in 1976. The scale is based on Opponent- Colour
19
Theory which assumes that the receptors in the human eyes perceive colour as the following pairs of opposites:
L* scale: Light vs. dark where a low number (0-50) indicates dark and a high number (51-100) indicates light,
a* scale: Red vs. green where a positive number indicates red and a negative number indicates green,
b* scale: Yellow vs. blue where a positive number indicates yellow and a negative number indicates blue (HunterLab., 2012) .
2.1.2 Texture
Texture or tenderness as applied to meat is an attribute that refers to the ease of chewing and swallowing. It is the most important attribute of meat that gives the ultimate consumer the satisfaction and joy for money well spent on the poultry meat product. Many internal and external factors contribute to the wide variation in meat tenderness. These factors can be related to the bird and the environment, processing conditions and cooking methods. Age, strain, and sex as well as environmental and nutritional stresses have all been shown to influence the variation in tenderness among meat samples (Owens et al., 2004).
The three factors that determine meat tenderness are background toughness, the toughening phase and the tenderization phase. The toughening and tenderization phases take place during the post-mortem storage period, but background toughness exists at the time of slaughter and does not change during the storage period. The background toughness of meat is defined as the resistance to shearing of the unshortened muscle and variation in the background toughness is due to the connective tissue component of muscle. While the toughening phase is similar in all carcasses under similar processing conditions, the tenderization phase is highly variable (Luciano et al., 2007).
20
Tenderness in poultry meat depends upon the rate and extent of the chemical and physical changes occurring in the muscle as it becomes meat. When an animal dies, blood stops circulating, and there is no new supply of oxygen or nutrients to the muscles. The muscles run out of energy, and they contract and become stiff i.e. rigor mortis sets in. Eventually, muscles become soft again, which means that they are tender when cooked. Anything that interferes with the formation of rigor mortis, or the softening process that follows it, will affect meat tenderness. For example, birds that struggle before or during slaughter cause their muscles to run out of energy quicker and rigor mortis forms much faster than normal. The texture of these muscles tends to be tough because energy was reduced in the live bird (De Fremery & Pool, 1960).
A similar pattern occurs due to exposure to environmental stress before slaughter (Sellier et al., 2003). High pre-slaughter stunning, high scalding temperatures, longer scalding times and machine picking can also cause poultry meat to be tough. Tenderness of portioned or boneless cuts of poultry is influenced by the time post-mortem of the deboning. Muscles that are deboned during early postmortem still have energy available for contraction. When these muscles are removed from the carcass, they contract and become tough. Aging of the meat for 6 -24 hours before deboning, may help to avoid this toughening. However, this may be costly to the processor. Early deboning, (0 to 2 hours post-mortem), causes 50 to 80 per cent of the meat to be tough. On the other hand, deboning after 6 hours may result in 70 to 80 per cent of the poultry meat being tender (Sams, 1998).
The use of post-slaughter electrical stimulation immediately after death is being practised to hasten rigor development of carcasses and reduce 'aging' time before deboning. This is different from energy depletion in the live bird, which causes meat to be tough. When electricity is applied to the dead bird, the treatment acts like a nerve impulse, and causes the muscle to contract, use up energy and enter rigor mortis at a faster rate (Bendall, 1980). In the
21
live bird, the same treatment causes meat to be tough but after death, the treatment causes tender deboned poultry meat within two hours post-mortem instead of the four to six hours required with normal aging. Although electrical stimulation is still in the developmental stages, it seems that processors using it can debone carcasses right out of the chiller and save on their equipment costs, time, space and energy requirements (Heinze, 2016).
2.1.3 Flavour
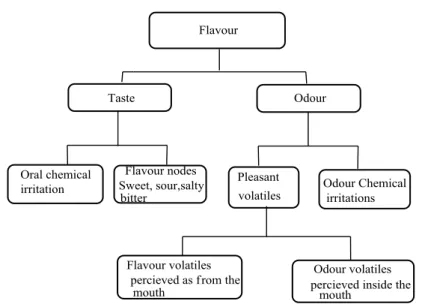
Flavour is another quality attribute that consumers use to determine the acceptability of poultry meat. It can be defined as a “complex combination of the olfactory, gustatory and trigeminal sensations perceived during tasting (ISO, 1992). Both taste and odour mix to contribute to the flavour of poultry meat (Figure 2.4), and it is generally difficult to distinguish between the two during consumption (Spence et al., 2010). When poultry is cooked, flavour develops from sugar and amino acid interactions, lipid and thermal oxidation and thiamin degradation (Brunton et al., 2002). These chemical changes are not unique to poultry but the lipids and fats in poultry just like in other types of meat are unique and combine with odour to account for the characteristic 'poultry' flavour. Thus it is the differences in lipid-derived volatile components between species that are mainly responsible for the species differences in flavour, whereas the precursors supplied by lean tissues generate the meaty flavour common to all cooked meats (Mottram, 1998).
Majority of the volatile compounds identified in cooked poultry meat, have been recognized in chicken (Brunton et al., 2002). However many of these have little influence on flavour of meat and relatively few make a key contribution to the odour and flavour of cooked meat (Aliani & Farmer, 2005). Melton, (1999), named sweet, sour, salty, bitter and the “umami” or savory taste as the basic tastes of meat. Hydrocarbons, aldehydes, ketones, alcohols, furans, thriphenes, pyrrols, pyridines, pyrazines, oxazols, thiazols, sulphurous compounds, and many others have been identified as the flavour and aroma compounds found
22
in meat (MacLeod, 1994). Few factors during production and processing affect poultry meat flavour. This means that it is not only difficult to produce a flavour defect but it is difficult to enhance flavour during production and processing. Age of the bird at slaughter affects the flavour of the meat. Chicken meat flavour also relies on several production and processing factors including the breed/strain of chicken, diet of bird, presence of free amino acids and nucleotides, irradiation, high pressure treatment, cooking, antioxidants, pH, ageing, environmental conditions, scalding etc. These ante- and post-mortem factors can influence the status of chicken meat flavour, though their effects may be too small for consumers to notice (Jayasena et al., 2018).
Heterocyclic compounds such as pyrazines, thiazoles and oxazoles are considered to be responsible for the roast flavours in foods including meat. It has been reported that a large number of heterocyclic compounds are associated with roasted, grilled, fried or pressure cooked meats, but not boiled meat, due to higher temperatures used in those cooking methods (Melton, 1999). Different alkyl pyrazines and two classes of bicyclic compounds, 6, 7-dihydro-5(H)-cyclopentapyrazines and pyrrolopyrazines, were found in meat volatiles (Mottram, 1998). It was noticed that both classes of compounds increased greatly with the increasing severity of heat treatment. However, Mottram, (1991) reported that boiled meat contained higher levels of sulphur-containing heterocyclic compounds such as thiophenes, trithiolanes, trithianes that have low odour thresholds with sulphurous, onion-like and, sometimes, meaty aromas. These compounds contribute to the overall flavour and aroma of boiled meat (Fors, 1983). The interactions that bring about flavour perceptions were summarised by Lawless as shown in Figure 2.4.
23
Figure 2. 4 Flavour perceptions
Adopted from Lawless, (1991)
2.2 Nutritional and chemical composition of poultry meat
Meat is defined by the Codex Alimentarius, (2005), as “all or parts of an animal that are intended for, or have been judged as safe and suitable for human consumption”. Meat is composed of water, protein and amino acids, minerals, fats and fatty acids, vitamins and other bioactive components, and small quantities of carbohydrates. These are known as the chemicals of life and are very important in deciding the quality of a given meat sample. From the nutritional point of view, meat’s importance is derived from its high quality protein, containing all essential amino acids and its highly bio-available minerals and vitamins. Meat is rich in vitamin B12 and iron which are not readily available in vegetarian diets (FAO, 2007). Poultry meat is ranked very high in as far as protein content is concerned (Table 2.1).
24
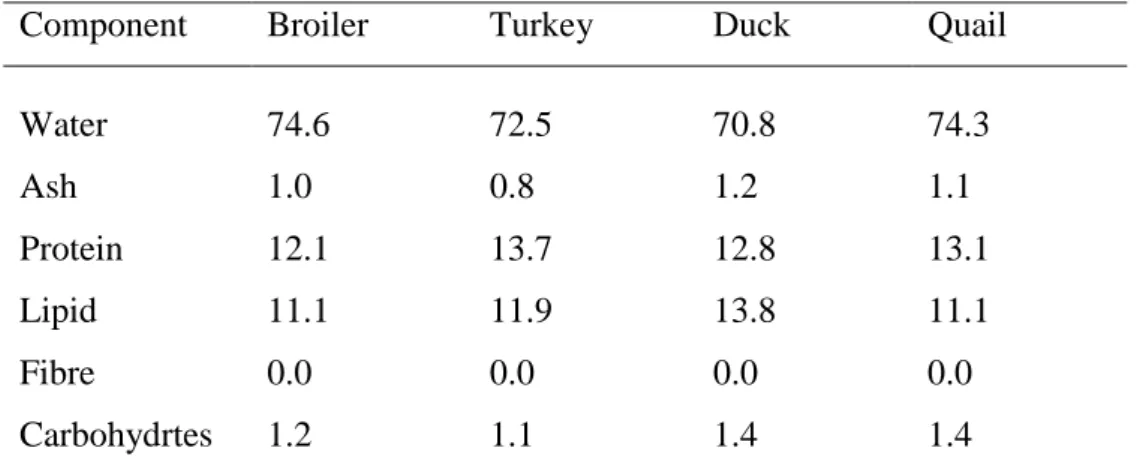
Table 2. 1 Approximate composition of Poultry Meat (g/100 g)
Component Broiler Turkey Duck Quail
Water 74.6 72.5 70.8 74.3 Ash 1.0 0.8 1.2 1.1 Protein 12.1 13.7 12.8 13.1 Lipid 11.1 11.9 13.8 11.1 Fibre 0.0 0.0 0.0 0.0 Carbohydrtes 1.2 1.1 1.4 1.4
Source: USDA (2006) as contained in Soriano, (2018)
Consumers worldwide demand a protein supply that is safe, wholesome, nutritious, abundant, and affordable. Poultry meat is supplied chiefly by chicken (Gallus gallus) and turkey (Meleagris gallopavo), although ducks, geese, guinea fowls, quails, and other fowls also contribute. Chicken is a source of protein, low in fat, which is less saturated than beef fat. Additionally, protein is a rich source of all the essential amino acids. However, eating chicken with the skin on doubles the amount of total fat and saturated fat in the dish. For this reason, chicken should best be skinned before cooking. Chicken consumption is increasing as people look for alternative ways to reduce fat such as cholesterol in their diets. To reduce fat in cooked poultry, cooking methods such as broiling, roasting, baking, simmering, or microwaving have been suggested. Chicken also provides vitamins B6 and B12, iron, zinc, and phosphorus (Soriano, 2018).
2.2.1 Proteins
The nutritional value of proteins is determined first by their content of essential amino acids and secondly by their digestibility. The amino acid composition of a protein is determined by chemical analysis and the result compared with that of a reference amino acid pattern. The score obtained from this comparison is corrected for protein digestibility. Animal foods in general are considered to be foods with high protein qualities. Red meats, poultry,
25
fish, eggs, milk, and milk products contain complete protein. More than 20% of these foods’ energy content is protein (Young & Pellet, 1994). The human body needs 20 different amino acids, nine of which are called essential because the body cannot make them and must get them in the diet. Essential amino acids for adults are; histidine, isoleucine, leucine, lysine, methionine, phenylalanine, threonine, tryptophan, and valine. Additionally, children need arginine (Soriano, 2018).
Food proteins that supply all the essential amino acids in the proportions needed by the body are called complete. Animal foods are considered to have high protein qualities, although their qualities are not always similar because of differences in essential amino acids. The higher quality of animal protein is due to the high lysine and methionine content (Jenkins & Mitchell, 1989). A FAO–WHO, working group (1991) recommended that the amount of essential amino acids per gram of protein required by the human body should decrease with age from 434 mg in infants to 111 mg in adults (histidine excluded). Hamm, (1981) determined the differences in the amino acid profiles between broiler breast and thigh meats and concluded that, on a percent protein basis, the amounts of valine, leucine, isoleucine, and histidine were significantly greater in breast meat, and glycine, hydroxyproline, hydroxylysine, threonine, and serine were greater in thigh meat. Similarly, the results showed that the region of production and/or related management practices appear to influence the concentration of about half the amino acids. The results further showed that the levels of individual amino acids in breast muscles (related to 100% of dry matter content) ranged from 8 to 127 mg/g in pheasant chickens and from 19 to 110 mg/g in broiler chickens, while the corresponding average values in thigh muscles ranged from 14 to 132 mg/g in pheasant chickens and from 14 to 93 mg/g in broiler chickens. These results have proven the high nutritive value of pheasant meat with regard to human nutrition (Stratova et al., 2006)