UNIVERSITÀ DEGLI STUDI DI MESSINA
Corso di Dottorato di Ricerca in
“Ingegneria e chimica dei materiali e delle
costruzioni”
XXX Ciclo
Novel devices and strategies in
earthquake protection of structures
Coordinatore: Tutor:
Prof. Signorino GALVAGNO Prof. Ing. Antonino RECUPERO
Co-Tutor:
Prof. Ing. Giuseppe RICCIARDI
Dott. Ing. Dario DE DOMENICO
Tesi di dottorato di: Isabella FAILLA
ACKNOWLEDGEMENTS
A few years ago I fell in love with seismic engineering but, I have to admit, it was not love at first sight; it has been a love that has matured over the years thanks to the meeting with my Professors who have sent me their love for this wonderful discipline.
Among all, I sincerely thank Professor Ricciardi who has followed me during my scientific growth and supported me in these years of Doctorate giving always precious advices and has transmitted to me his great passion for research. I thank Professor Recupero for the useful discussions about the construction technique and for his encouragement to continue the study of this research. I also thank Professor Muscolino and Professor Falsone because, being the first I met on my journey, they were the first who made me fall in love with seismic engineering and feed my passion.
An important thank goes to my family, my father who has always believed in me, my mother who is for me an example of life and my sister who is my strength. Finally, I would like to thank my husband, Stefano, who made all this possible by helping and supporting me in these years and my daughter, Vita, because she pushes me every day to improve to be an example for her.
List of figures ... v
List of tables ...xvii
INTRODUCTION ... 1
LITERATURE REVIEW ... 5
1.1 Historical development of base isolation system ... 6
1.1.1 From 1900 to nowadays ... 9
1.2 Basic concepts in seismic isolation ... 17
1.2.1 Theory of base isolation ... 17
1.2.2 The Italian code for base isolated structures ... 23
1.3 Main features of commercial devices ... 25
1.3.1 Elastomeric-based devices ... 25
1.3.1.1 Low Damping Rubber Bearing (LDRB) ... 25
1.3.1.2 High Damping Rubber Bearing (HDRB) ... 26
1.3.1.3 Lead Rubber Bearing (LRB) ... 27
1.3.1.4 Fiber Reinforced Elastomeric Isolator (FREI) ... 29
1.3.2 Friction based device ... 31
1.3.2.1 Pure Sliding Device (SD) ... 31
1.3.2.2 Friction Pendulum System (FP) ... 33
1.3.2.3 Resilient-Friction Base Isolation system (RFBI) ... 35
1.3.2.4 Electricitè De France bsse isolation system (EDF) ... 36
1.3.2.5 Sliding Resilient-Friction Base Isolation system (SR-F) 37 1.3.2.6 Earthquake Engineering Research Center Base Isolation system (EERC) ... 38 1.3.2.7 Taisei Shake Suppression (TASS) base isolation system
1.3.2.8 Variable Friction Pendulum Isolation (VFPI) system 41
1.3.2.9 The RoGlider Isolation system ... 42
1.3.2.10 High Damping Hybrid Seismic Isolator (HDHSI) ... 44
1.3.3 Advantages and disadvantages ... 46
1.4 Vertical isolation devices ... 48
BEHAVIOR OF MATERIALS USED IN ISOLATION DEVICES ... 53
2.1 Preliminary definitions ... 54
2.1.1 Deformation gradient ... 56
2.1.2 Strain ... 58
2.1.3 Velocity and velocity gradient ... 63
2.1.4 Deformation rate ... 65
2.1.5 Stress representation ... 67
2.1.5.1 Cauchy stress tensor ... 67
2.1.5.2 The Kirchhoff stress tensor ... 68
2.1.5.3 The First Piola–Kirchhoff stress tensor ... 69
2.1.5.4 The Second Piola–Kirchhoff stress tensor ... 70
2.2 ELASTOMER: an hyperelastic material ... 71
2.2.1 Shape of the elastic potential ... 77
2.2.1.1 Polinomial shape ... 77
2.2.1.2 Money-Rivlin model ... 78
2.2.1.3 Reduced polynomial shape ... 79
2.2.1.4 Ogden model ... 80
2.2.1.5 Arruda-Boyce model ... 80
2.2.2 Hyperelastic material models in Finite Element analysis .. 82
2.2.2.1 Simple tension strain state ... 83
2.2.2.2 Pure shear strain state ... 86
2.2.2.4 Equal biaxial strain state ... 88
2.2.2.5 Volumetric compression ... 89
2.2.2.6 Creating a consistent data set ... 89
2.2.2.7 Elastomer characterization ... 93
2.3 PTFE: a fluoropolymer with thermo-mechanical behavior ... 98
2.3.1 Experimental test for characterization of compressive mechanical behavior ... 107
2.3.2 Friction sliding ... 114
2.3.2.1 Basic mechanism of friction ... 115
2.3.2.2 Static and sliding friction ... 118
2.3.2.3 PTFE- polished stainless steel sliding ... 121
2.3.3 Theory of frictional heating ... 123
2.4 STEEL: an elastoplastic material ... 128
2.4.1 Material main features ... 128
FINITE ELEMENT MODELING OF EXISTING DEVICES ... 131
3.1 Finite Element Model (FEM) of HDRB device ... 131
3.2 Finite Element Model of Friction Pendulum devices ... 140
3.2.1 Mechanical behavior... 142
3.2.2 Macroscale phenomenological model ... 147
3.2.3 Thermo Mechanical Coupled FE model ... 151
NEW ISOLATION DEVICES ... 167
4.1 Design criteria ... 178
4.1.1 Behavior of rubber in pure shear ... 178
4.1.2 Behavior of multilayer rubber in compression ... 178
4.1.3 Kinematics of VID ... 188
4.1.4 Analogies between horizontal and vertical spectra ... 193
4.2.1 Geometric model ... 202
4.2.2 Finite element for the calibration of the model ... 205
4.2.3 Constitutive law of the materials used ... 205
4.2.4 Modeling contact interaction surfaces ... 206
4.2.5 Boundary conditions and loads ... 208
4.3 Hybrid Friction Rubber Isolator FE model ... 209
4.4 Vertical Isolation Device FE model ... 222
4.4.1 Numerical application on a steel tank ... 226
4.5 Advantaged of the proposed isolation devices ... 230
4.5.1 HRFI... 230
4.5.2 VID... 231
TUNED MASS DAMPER INERTER ... 233
5.1 Equation of motion of systems with TMDI... 235
5.1.1 Numerical application on a 5-story building ... 241
5.2 Methods to realize of an inerter device ... 246
5.3 Design of a rack pinion inerter device ... 252
5.4 Design of a fluid inerter device ... 257
FIBER REINFORCED PTFE ... 267
6.1 Manufacturing process and compression tests ... 268
6.2 Finite element model of the new proposed material ... 274
CONCLUSIONS ... 277
List of figures
Figure 1.1 First application of seismic isolation: (a) Cnósso Palace; (b)Troia’s walls ... 6
Figure 1.2 Diana Temple in Efeso ... 7
Figure 1.3 Dikilitash obelisk: a) base of the real structure, b) base model 8 Figure 1.4 Dikilitash obelisk: a) real structure, b) Finite Element Model .. 8
Figure 1.5 Temple of Sanjusangendo ... 9
Figure 1.6 First patents on isolation: a) Touaillon; b) Kawai ... 10
Figure 1.7 First patents on isolation: a) Bechtold b) Calentarients ... 11
Figure 1.8 First patents on isolation: Martel ... 12
Figure 1.9 First patents on isolation: Lodà ... 13
Figure 1.10 The Pestalozzi School ... 14
Figure 1.11 Schematic sketch of a base isolated structure: a) structural scheme with the base isolation system b) useful scheme for the definition of the equation of motion (Muscolino 2002) ... 18
Figure 1.12 Response function, in terms of relative displacement, in the time domain and in the frequency domain of an SDOF system: a) fixed system; b) isolated system (Muscolino 2002) ... 22
Figure 1.13 LDRB device ... 25
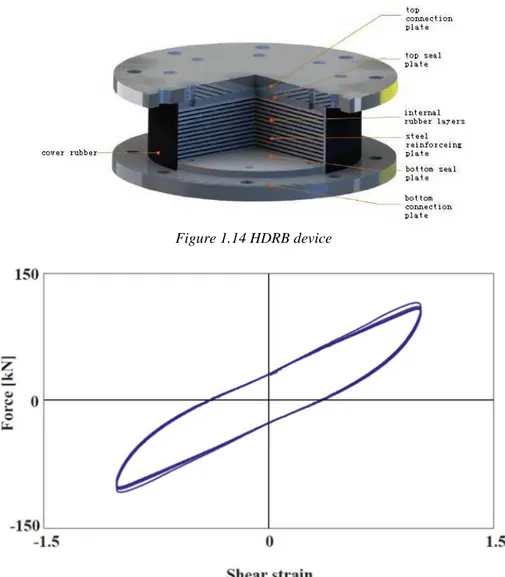
Figure 1.14 HDRB device ... 26
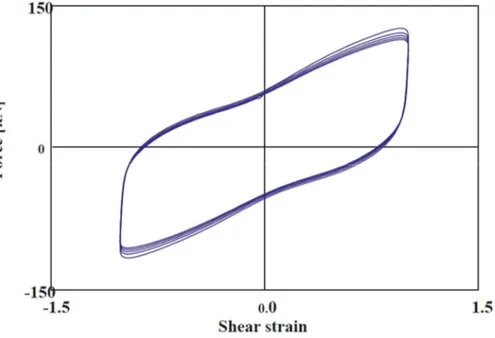
Figure 1.15 Experimental hysteresis loops of a HDRB at frequency of 0.5 Hz, shear strain ±100%(FIP INDUSTRIALE) ... 26
Figure 1.16 Lead-plug isolator (Naeim et al. 1999) ... 27
Figure 1.17 LRB device ... 28
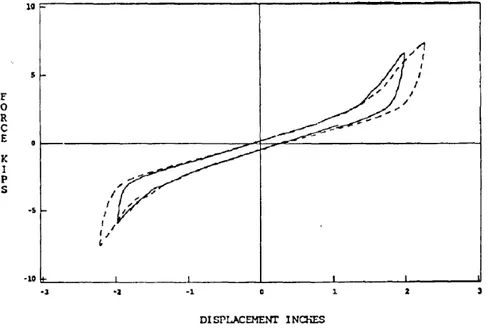
Figure 1.18 Experimental hysteresis loops of a LRB at frequency of 0.5 Hz, shear strain ±100%(FIP INDUSTRIALE) ... 28
Figure 1.19 Modeling of isolators: (a) Classical layer of steel and rubber ; (b) Fiber Reinforced Elastomeric Isolator ... 29
Figure 1.20 Manufacturing of FREI: (a) schematic diagram of dipping process to improve bonding characteristic between rubber and fiber; (b) dipping process; (c) FREI in final form (Moon et al. 2002)... 30
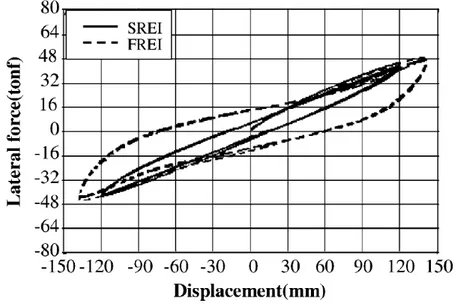
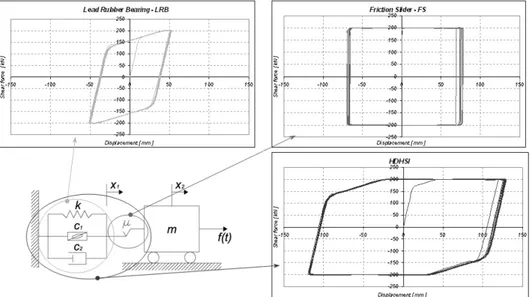
Figure 1.21 Hysteresis loops for SREI and FREI at 50% shear strain (Moon et al. 2002)... 30 Figure 1.22 Schematic schetk of a SD ... 31 Figure 1.23 Pure Sliding Device (FIP INDUSTRIALE) ... 32 Figure 1.24 Force-displacement loop result of a static test (speed 4mm/min) at maxium design vertical load (14000 kN)(FIP INDUSTRIALE) ... 32 Figure 1.25 FP schematic sketch ... 33 Figure 1.26 FP schematic sketch ... 33 Figure 1.27 A double concave curved surface slider (FIP INDUSTRIALE) ... 34 Figure 1.28 Experimental hysteresis loops of a double curved surface slider (FIP INDUSTRIALE) ... 34 Figure 1.29 The R-FBI system (Mostaghel 1984) ... 35 Figure 1.30 The EDF system (Gueraud,et al, 1985) ... 36 Figure 1.31 Schematic diagram of non uniform shear-beam structure with SR-F base isolator (Su et al. 1991) ... 37 Figure 1.32 EERC isolation system (Chalhoub and Kelly 1990) ... 38 Figure 1.33 Tension restrain showing dimensions (Chalhoub and Kelly 1990) ... 39 Figure 1.34 Effect of tension device in horizontal stiffness (Chalhoub and Kelly 1990) ... 39 Figure 1.35 Schematic figure of TASS system (Nagashima et al. 1987) 40 Figure 1.36 Details and operation of VPFS (Panchal and Jangid 2008).. 41 Figure 1.37 The RoGLider device (Robinson et al. 2006) ... 42 Figure 1.38 RoGLider during test displacement +575mm, vertical force of 110kN (Robinson et al. 2006) ... 42 Figure 1.39 RoGLider force displacement curve – vertical force of 850 kN (Robinson et al. 2006) ... 43 Figure 1.40 RoGLider force displacement curve – vertical force of 110 kN (Robinson et al. 2006) ... 43 Figure 1.41 HDHSI system (Cancellara and Pasquino 2011) ... 44 Figure 1.42 Hysteretic cycles of single components and the HDHSI device (Cancellara and Pasquino 2011) ... 45 Figure 1.43 Xueyuan et al. service:combined shape of disk spring (left); Section of the vertical isolation system (right) ... 49
Figure 1.44 Magnetic leakage system schematic sketch (Tsuda et al. 2009)
... 49
Figure 1.45 Model with non linear springs and magnetic damping (Masaharu et al. 2007) ... 50
Figure 1.46 Steel elicoidal spring (left) – Viscous damper (right) ... 50
Figure 1.47 Tridimensional Seismic Device ... 51
Figure 2.1 General Motion of a deformable body (Bonet and Wood 2008) ... 55
Figure 2.2 General motion in the neighborhood of a particle (Bonet and Wood 2008) ... 57
Figure 2.3 Change in length (Bonet and Wood 2008) ... 60
Figure 2.4 Volume change (Bonet and Wood 2008) ... 62
Figure 2.5 Rate of deformation (Bonet and Wood 2008) ... 65
Figure 2.6 Traction vector (Bonet and Wood 2008) ... 68
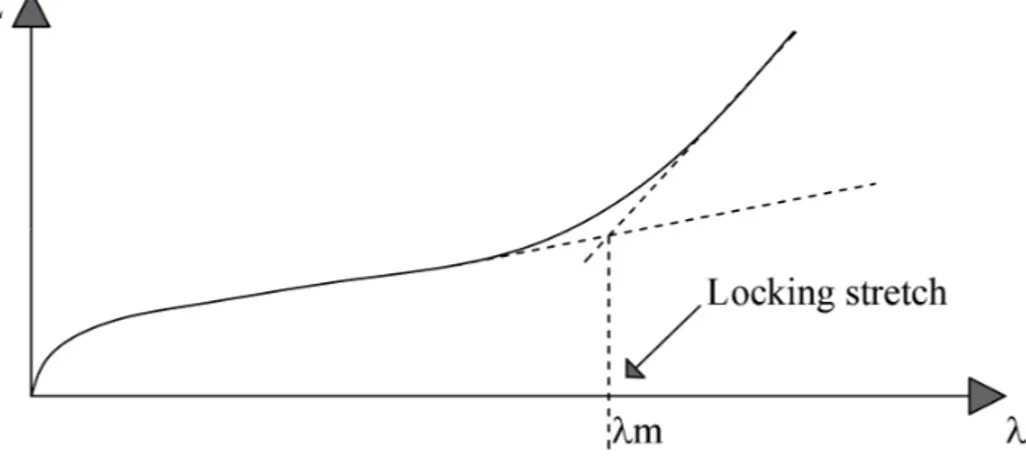
Figure 2.7 Constitutive law with locking stretch ... 79
Figure 2.8 Schematic Arruda-Boyce model ... 81
Figure 2.9 A typical final data set for input into a curve fitter (Miller 1999) ... 82
Figure 2.10 Dumbell specimen with 2mm thickness ... 83
Figure 2.11 Analysis of a tension specimen (Miller 1999) ... 84
Figure 2.12 A tension experiment using video extensometer (Miller 1999) ... 85
Figure 2.13 A pure shear experiment using a laser extensometer ... 86
Figure 2.14 A lubricated compression specimen showing lateral constraining from friction at the surface... 87
Figure 2.15 Analysis of a biaxial specimen ... 88
Figure 2.16 A biaxial extension experiment ... 88
Figure 2.17 Volumetric compression fixture with specimen ... 89
Figure 2.18 Cyclic loading of filled natural rubber (Miller 1999) ... 91
Figure 2.19 1st loading of a thermoplastic elastomer (Miller 1999) ... 91
Figure 2.20 Multiple strain cycles of a thermoplastic elastomer (Miller 1999) ... 92 Figure 2.21 Multiple strain cycles of a thermoplastic elastomer at two
Figure 2.22 Uniaxal test on elastomer: fisrt series with dashed line, second
series with continous line (Cuomo 2007) ... 93
Figure 2.23 Planar test on elastomer: first series with dashed line, second series with continous line (Cuomo 2007) ... 94
Figure 2.24 Volumetric test on elastomer: first series with dashed line, second series with continous line (Cuomo 2007) ... 94
Figure 2.25 Biaxial test on elastomer: second series with continous line (Cuomo 2007) ... 95
Figure 2.26 Uniaxial test curves from ABAQUS ... 95
Figure 2.27 Biaxial test curves from ABAQUS ... 96
Figure 2.28 Planar test curves from ABAQUS ... 96
Figure 2.29 Volumetric test curves from ABAQUS ... 97
Figure 2.30 Stress-strain curve for different temperature (DuPont-Fluoroproducts 1996) ... 99
Figure 2.31 Tensile stress-strain curves (DuPont-Fluoroproducts 1996) ... 100
Figure 2.32 Variation of tensile stress with temperature (DuPont-Fluoroproducts 1996) ... 101
Figure 2.33 Variation of compression stress-strain curves with temperature (DuPont-Fluoroproducts 1996) ... 102
Figure 2.34 Tensile and Compression behavior (DuPont-Fluoroproducts 1996) ... 103
Figure 2.35 Stress-strain curves for shear (DuPont-Fluoroproducts 1996) ... 104
Figure 2.36 Basic creep testing equipment (Physical properties of Fluon unfilleed and filled PTFE 2007) ... 105
Figure 2.37 Compressive creep (Physical properties of Fluon unfilleed and filled PTFE 2007)... 105
Figure 2.38 Isochronous stress-strain relationship in compression, at 25°C (Physical properties of Fluon unfilleed and filled PTFE 2007) ... 106
Figure 2.39 Recovery for creep in compression, at 25°C (Physical properties of Fluon unfilled and filled PTFE 2007) ... 107
Figure 2.40 Heat treatment... 108
Figure 2.41 The PTFE vergin dust into the mold ... 109
Figure 2.42 The molding equipment ... 109
Figure 2.44 Equipment for the heat treatment ... 110
Figure 2.45 Printed disk of vergin PTFE ... 111
Figure 2.46 Compression test machine ... 111
Figure 2.47 Compression testing machine ... 112
Figure 2.48 Disk of vergin PTFE during the test ... 112
Figure 2.49 Disk of vergin PTFE after the compression test ... 113
Figure 2.50 Stress-strain experimental curve in compression for the vergin PTFE ... 113
Figure 2.51 Schematic illustration of an interface, showing the apparent and real areas of contact ... 115
Figure 2.52 Schematic illustration of the roughness of sliding surface. Positive and negative
θ
coexist ... 116Figure 2.53 Schematic illustration of a cone pressed into a flat surface. The asperity moving horizontally creats a groove which is swept out of Ap 117 Figure 2.54 Typical friction force-sliding loop of polymer-stainless steel interface without the contribution of restoring stiffness W/R (pressure=15 MPa, peak velocity=1.27 mm/sec) (Trovato 2013) ... 118
Figure 2.55 Schematic representation of a friction apparatus. ... 119
Figure 2.56 (a) A schematic hypothetical force displacement plot. (b) Friction record corresponding to the force displacement plot ... 120
Figure 2.57 Schematic variation of real area of contact, Pressure and coefficient of sliding friction. ... 122
Figure 2.58 Semi-infinite solid with constant heat flux at the surface (Carslaw and Jager 1959) ... 126
Figure 2.59 Schematic illustration of the sliding contact surface problem (Carslaw and Jager 1959) ... 127
Figure 2.60 – Typical steel constitutive law for structural use ... 129
Figure 2.61 – Schematic steel constitutive law ... 130
Figure 3.1 Maxwell model for elastomer viscoelasticity used in ADINA ... 133
Figure 3.2 HDRB experimentally tested (model) ... 135
Figure 3.3 Model of the HDRB ... 135
Figure 3.5 Load displacement curve for elastomer seismic isolator (case 1-pm=22.5 MPa) ... 137 Figure 3.6 Deformed shape for the load case 1 ... 137 Figure 3.7 Load displacement curve for elastomer seismic isolator (case 2-pm=22.5 MPa and γ =180%) ... 138 Figure 3.8 Deformed shape for the load case2 ... 138 Figure 3.9 Simple compression test (comparison FEM model and experimental results (Cuomo 2007)) ... 139 Figure 3.10 Combined compression and shear test (comparison FEM model and experimental results (Cuomo 2007)) ... 139 Figure 3.11 Section through a FP bearing: a) constituting elements and materials; b) kinematic analysis (De Domenico et al. 2018) ... 143 Figure 3.12 Sketch at two time-instants of in-plane motion of the slider with the resulting forces highlighted (De Domenico et al. 2018) ... 146 Figure 3.13 Heat flux generated during the time interval dt: a) actual; b) equivalent uniformly distributed (Lomiento et al. 2013) ... 148 Figure 3.14 FE-model of the FP: a) isometric view; b) exploded drawing with contact surface labels ... 152 Figure 3.15 Cloverleaf test: a) in-plane trajectory; b) longitudinal (ux) and
lateral (uy) components of motion (De Domenico et al. 2018) ... 155 Figure 3.16 Comparative analysis of the trajectories traveled by the FP during the cloverleaf test (De Domenico et al. 2018) ... 157 Figure 3.17 Contact force distribution: a) vector plot of the fi forces; b)
band plot of fzi on the sliding surface ... 158 Figure 3.18 Angular shift
∆
ϕ
between the force vector and velocity for bidirectional cloverleaf test ... 159 Figure 3.19 Force-displacement loops for cloverleaf test: a) and b) bidirectional; c) and d) monodirectional ... 160 Figure 3.20 Plot of the friction coefficient versus time: a) bidirectional test; b) and c): monodirectional tests ... 161 Figure 3.21 Force displacement loops from the TMC-FE model: a) longitudinal; b) lateral ... 162 Figure 3.22 Temperature distribution on the sliding plate for bidirectional cloverleaf test ... 163Figure 3.23 Temperature distribution on the sliding PTFE pad for
bidirectional cloverleaf test ... 163
Figure 3.24 Temperature for monodirectional test (lateral) on: a) sliding plate; b) PTFE pad ... 164
Figure 3.25 Average temperature histories during the test: a) bidirectional test; b) monodirectional test (CS stands for “contact surface”; TIFC stands for “ Temperature-Indipendent Friction Coefficient”) (De Domenico et al. 2017) ... 164
Figure 3.26 Bidirectional orbits analyzed in the parametric study: a) Durer’s folium; b) straight cloverleaf; c) twelve-leaf clover; d) circular orbit; e) oblique cloverleaf; f) spiral orbit ... 166
Figure 4.1 Schematic section of the Hybrid Friction Rubber Isolator.... 168
Figure 4.2 Part1 and 2 of the Hybrid Friction Rubber Isolator ... 169
Figure 4.3 Part 3 and 4 of the Hybrid Friction Rubber Isolator ... 169
Figure 4.4 Part 5 and 6 of the Hybrid Friction Rubber Isolator ... 170
Figure 4.5 Part 7 and 8 of the Hybrid Friction Rubber Isolator ... 170
Figure 4.6 Schematic section of the Vertical Isolation Device ... 172
Figure 4.7 Part 1 and 2 of the Vertical Isolation Device ... 173
Figure 4.8 Part 3and 4 of the Vertical Isolation Device ... 174
Figure 4.9 Part 5 of the Vertical Isolation Device ... 175
Figure 4.10 The tridimensional isolation device made by the two proposed devices ... 176
Figure 4.11 The tridimensional isolation device made by the vertical proposed device and a classic elastomeric isolation device ... 177
Figure 4.12 (a) Cartesian coordinate system on an arbitrarily shaped pad; (b) displacement fields of an arbitrarily shaped pad (Kelly and Konstantinidis 2011) ... 180
Figure 4.13 Coordinates system for a rectangular pad with side lengths l and 2b (Kelly and Konstantinidis 2011) ... 186
Figure 4.14 Effect of bulk compressibility on Ec for rectangular pads with different lengthto-width ratios, ρ (Kelly and Konstantinidis 2011) ... 187
Figure 4.15 Schematic sketch oh the VID ... 188
Figure 4.18 Elastic spectrum of the horizontal component ... 194
Figure 4.19 Elastic spectrum of the vertical component ... 195
Figure 4.20 Details of PTFE recess and relief (UNI EN 1337-2) ... 199
Figure 4.21 Pattern of dimples in recessed PTFE sheet (UNI EN 1337-2) ... 199
Figure 4.22 Degradation of the friction coefficient with temperature ... 208
Figure 4.23 Schematic sketch of the HFRI with the representation of the dimensions ... 209
Figure 4.24 ABAQUS-3D model of the horizontal device ... 210
Figure 4.25 ABAQUS-3D model highlighting the different material with different colors ... 211
Figure 4.26 ABAQUS-3D Section model highlighting the different part with different colors ... 211
Figure 4.27 ABAQUS-3D model of the PTFE pad ... 212
Figure 4.28 Time history of the horizzontal displacement with A=100 mm, vp=250 mm/sec ... 213
Figure 4.29 Deformed shape of HDRI at the final step ... 213
Figure 4.30 Stress distribution at the final step ... 214
Figure 4.31 Stress distribution at the final step in the rubber part ... 214
Figure 4.32 Force-displacement loop from the FE model ... 215
Figure 4.33 Time history of the horizzontal displacement with A=100 mm, vp=100 mm/sec ... 215
Figure 4.34 Force-displacement loop from the FE model ... 216
Figure 4.35 Trajectories of the clover leaf test ... 218
Figure 4.36 Force displacement loop for the clover leaf test in direction x: comparison between simple analysis and TMC analysis ... 218
Figure 4.37 Force displacement loop for the clover leaf test in direction y: comparison between simple analysis and TMC analysis ... 219
Figure 4.38 Force displacement loop for the clover leaf test in direction x: comparison between simple analysis and experimental test ... 219
Figure 4.39 Force displacement loop for the clover leaf test in direction y: comparison between simple analysis and experimental test ... 220
Figure 4.40 Temperature distribution on the sliding plate for bidirectional cloverleaf test of HFRI ... 220
Figure 4.41 Average temperature histories during the bi-directional test ... 221
Figure 4.42 Schematic sketch of the VID with the representation of the
dimensions ... 222
Figure 4.43 ABAQUS-3D model of the vertical device ... 223
Figure 4.44 ABAQUS-3D model of the inner part of the vertical device ... 224
Figure 4.45 ABAQUS-3D model of the vertical device ... 224
Figure 4.46 Deformed shape after ONE cycle ... 225
Figure 4.47 Force-displacement loop for the VID ... 225
Figure 4.48 Circular cylindrical steel storage tanks of 150 thousands barrels ... 226
Figure 4.49 SAP model of the structures without the VID ... 228
Figure 4.50 SAP model of the structures with the VID ... 228
Figure 4.51 Displacement of the central point: fixed vs isolated structure ... 229
Figure 4.52 Normal strength of a beam: fixed vs isolated structure... 229
Figure 5.1 Sketch of a base-isolated one-story building with attached TID (De Domenico and Ricciardi 2017) 236 Figure 5.2 Schematic arrangement of the proposed enhanced base-isolation system. ... 239
Figure 5.3 Enhanced base-isolation system (BIS) for different
ζ
bvalues. A,B, normalized displacement variance of the conventional BIS and of the auxiliary BIS (TMDI). C,D, corresponding optimal TMDI parameters (De Domenico and Ricciardi 2018)... 240Figure 5.4 Multistory building with proposed enhanced base-isolation system. ... 242
Figure 5.5 PSD function according to Eurocode 8 ground type A spectrum-compatible base acceleration. ... 244
Figure 5.6 Time histories responses of the last floor displacements ... 245
Figure 5.7 Time histories responses of the proposed TID displacements ... 245
Figure 5.8 Schematic of a mechanical model of an inerter (Smith 2002) ... 246
Figure 5.9 – Rack-Pinion ineter device with several gears (Mirza Hessabi and Mercan 2016) ... 247
Figure 5.10 The small scale prototype gears (Mirza Hessabi and Mercan 2016) ... 247 Figure 5.11 Measured force vs measured displacement forthe prototype with b = 29.87 kg (Mirza Hessabi and Mercan 2016). ... 248 Figure 5.12 Schematic of a mechanical model of a ballscrew inerter (Smith 2008) ... 249 Figure 5.13 Ballscrew inerter made at Cambridge University Engineering Department; Mass<1 kg, Inertance (adjustable) = 60–240 kg. (a) Complete with outer case, (b) ballscrew, nut and flywheel, (c) flywheel removed, (d) thrust bearing. (Smith 2002) ... 249 Figure 5.14 Schematic of a mechanical model of a hydraulic inerter (Smith 2008) ... 250 Figure 5.15 A prototype of the hydraulic inerter (Wang et al. 2010) .... 250 Figure 5.16 The working principle of an hydraulic inerter (Wang et al. 2010) ... 251 Figure 5.17 Schematic of a mechanical model of a fluid inerter (Swift et al. 2013) ... 251 Figure 5.18 Fluid inerter device designed and tested in Smith and Wagg (2016). ... 252 Figure 5.19 Schematic schetck of the inerter damper proposed ... 253 Figure 5.20 Part of the rack pinion inerter device ... 253 Figure 5.21 Theoretical mechanical model of a part of the proposed rack pinion inerter device... 256 Figure 5.22 Cross and logitudinal sections of the proposed inerter device ... 257 Figure 5.23 Pro-RST Silkolene oil density versus temperature (assuming a linear extrapolation). ... 258 Figure 5.24 Inertance of the proposed device versus temperature ... 259 Figure 5.25 Plant of the proposed device ... 260 Figure 5.26 Parasitic damping force ... 263 Figure 5.27 Total force of the proposed device (total force in black; inertance part in dashed green; viscosity of the fluid in blue; inlet and outet part in dashed brown) ... 263 Figure 5.28 Force-displacement loop for the proposed device (frequency of 0.5 Hz; displacement of 120 mm) ... 264
Figure 5.29 Force-displacement loops for the proposed device (frequency of 0.5 Hz; displacement of 120 mm): total inerter force (black line), inertance contribution plus linear part of the parasitic force (red line), inertance contribution to the total inerter force (blue line) ... 264 Figure 5.30 3D mechanical model of the proposed fluid inerter device from SolidWorks ... 265 Figure 6.1 Disk of PTFE filled with glass fiber 268
Figure 6.2 Disk of PTFE filled with glass fiber after the compression test ... 268 Figure 6.3 Stress-strain behavior of the disk of PTFE filled with glass fiber ... 269 Figure 6.4 Disk of PTFE filled with bronze ... 269 Figure 6.5 Disk of PTFE filled with bronze after the compression test . 270 Figure 6.6 Stress-strain behavior of the disk of PTFE filled with bronze ... 270 Figure 6.7 Glass fiber used for the proposed new material ... 271 Figure 6.8 The inclusion of the fiber inside the the stamp ... 271 Figure 6.9 Fiber reinforced PTFE after the compression test ... 271 Figure 6.10 Stress-strain behavior of the disk of reinforced vergin PTFE ... 272 Figure 6.11 Comparison between the two disks after the compression test (vergin PTFE on the left; reinforced PTFE on the right) ... 272 Figure 6.12 Comparison between the stress–strain curve of the two disks ... 273 Figure 6.13 Comparison between the stress–strain curve of the four printed disks ... 273 Figure 6.14 3D model of the reinforced disk realized with ABAQUS 6.14 ... 274 Figure 6.15 Section of the 3D model of the reinforced disk realized with ABAQUS 6.14 ... 274 Figure 6.16 Mesh of the reinforced disk... 275 Figure 6.17 Stress-strain curve from the FE model ... 275 Figure 6.18 Comparison between experimental and FE model ... 276
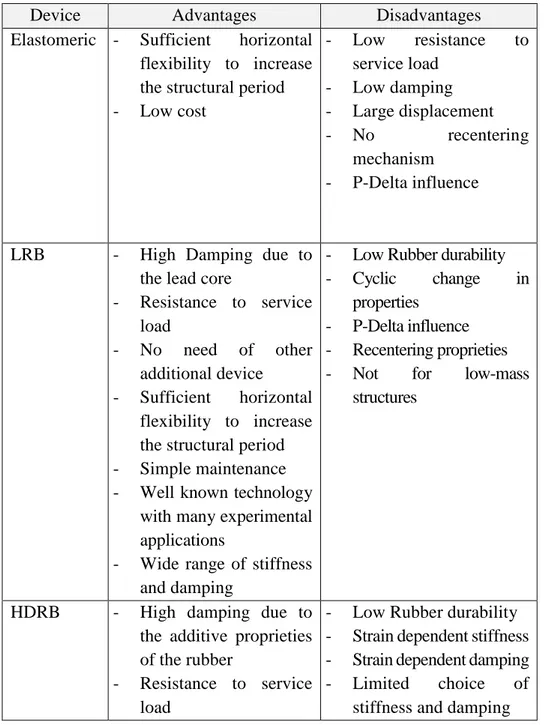
Table 1.1 Advantage and disadvantage of commercial devices ... 47 Table 2.1 Rubber mechanical properties ... 78 Table 2.2 Yield values for different temperature (DuPont-Fluoroproducts 1996) ... 99 Table 2.3 Thermal properties of PTFE and stainless steel ... 124 Table 2.4 Thermal diffusivity of various metals. ... 125 Table 2.5 Mechanical characteristic of Steel ... 130 Table 3.1 Geometrical characteristics of the HDRB experimentally tested (Cuomo 2007) ... 134 Table 3.2 Mechanical characteristics of the HDRB experimentally tested (Cuomo 2007) ... 135 Table 3.3 Geometrical data of the analyzed FP (after Lomiento et al.2013) ... 151 Table 3.4 Mechanical Parameters of the materials ... 153 Table 3.5 Thermal Parameters of the materials ... 153 Table 3.6 Numerical parameters defining the analytical model and the TMC FE subroutine ... 160 Table 4.1 Characteristic compressive strength for PTFE (UNI EN 1337-2) ... 201 Table 4.2 Geometrical characteristic of the HRFI studied ... 210 Table 4.3 Geometrical characteristic of the HRFI studied in case 2 ... 217 Table 4.4 Geometrical characteristic of the VID studied ... 223 Table 4.5 Mechanical characteristics of materials of circular cylindrical steel storage tanks ... 227 Table 4.6 – Geometrical characteristics of the circular cylindrical steel storage tanks ... 227 Table 5.1 Mechanical and geometrical characteristic of the designed rack pinion inerter device ... 255
INTRODUCTION
The base isolation technique provides the fundations for many advanced techniques for computing and applications, in the framework of buildings, bridges,etc...In view of ubiquity of scientific problems modeled by this system, the subject is of interest for an increasing number of scientists and engineers. The study of this system is reflected by the specific applications (over 24000) appearing in the worldwide. The basic idea of this system is to disconnect the superstructure response from ground motion. Since the significant component of the seismic action is predominantly the wave one, the isolation effect is achieved by using devices generally characterized by a low horizontal rigidity (high flexibility) combined with a high vertical stiffness to support the static loads. The high vertical stiffness is dictated by the need to avoid oscillations of the structure under the action of only static design loads. However, it is widely documented in the scientific literature, as well as confirmed by recent earthquakes, for example the 2009 Aquila earthquake and the 2016 Norcia earthquake, that, if the structure is near the earthquake's hypocenter (near fault seismic event), the vertical component of seismic waves is significant and may represent the main cause of damage to structures. It is therefore necessary to reduce the vulnerability of the structures not only with regard to the ondulatory component of the seismic action, but also to envisage seismic protection strategies with regard to the subsidiary component.
Concerning horizontal isolation devices, the existing systems are classified according to how the high deformability in the horizontal direction is obtained at the base of the structure; on the market there are two main types of isolators: (i) isolator made of elastomeric material and (ii) sliding isolators. The former are generally made of natural rubber or synthetic elastomer or neoprene while the latter are sliding supports of
The elastomeric isolators consist of alternating layers of rubber and steel solidarized by hot vulcanization. The layers of steel perform the function of confinement of the rubber, reducing the deformability by orthogonal loads to lay the layers, leaving them free to deform by parallel loads exploiting the high tangential deformability of the rubber (deformations greater than 300%), also because the elastomer has a low lift for vertical loads.
The sliding isolator consists respectively of sliding bearings (steel-Teflon) characterized by low friction resistance values in order to transmit the lowest possible seismic load to the structure. Within this typology the most used are the pendulum isolators (FP-Friction Pendulum System), consisting of a sliding slide lower than the concave surface, whose radius of curvature determines, by analogy with the mechanism of a simple pendulum, the period of oscillation and allows horizontal displacement. Between the two surfaces there is interposed a central "scroll" in steel (slider) whose upper and lower faces, both convex and appropriately shaped to mate with the concave ones of the above plates, are covered with suitably treated materials (generally polished stainless steel and fluoropolymers such as PTFE or high-strength polymers) that exhibit low friction resistance but at the same time offer a high load-bearing capacity with respect to the vertical loads transmitted by the structure. To ensure adequate energy dissipation and to limit large displacements to the base, the isolation system must have adequate damping. In the case of isolator made of elastomeric material this condition is guaranteed by the hysteretic behavior of the materials composing these devices. In the case of sliding isolators, the dissipation mechanism is due to the friction between the sliding interfaces. Both existing devices, however, present problems related to potential instability phenomena due to high lateral deformations, uplifting phenomena that may occur both in the case of sliding isolators (lifting) and in the case of elastomeric isolators (lowering). They also present insufficient geometry re-centering for the pendulum isolators and effects attributed to the multidirectionality of the motion for which we observe a difference between the experimental behavior and the theoretical one based on monodirectional idealizations.
Concerning vertical isolation protection, there are devices, generally consisting of springs and / or elastic elements (such as rubber or elastomers)
in series or in parallel, characterized by a high vertical flexibility and therefore potentially capable of isolation in respect of vertical seismic action. These devices have been widely used in the isolation of mechanical vibrations produced by machinery such as motors, current generators, chillers, AHUs. The use of such devices in the framework of civil engineering structures (buildings, bridges, reservoirs, nuclear power plants) for the isolation from vertical seismic excitation has not had the same diffusion. This is presumably due to the absence of an effective and valid technology, of simple realization that can be introduced into the construction market.
My PhD scholarship has been sponsored by Bosch Rexroth S.P.A., that suggested me a research project focused on the “design of innovative isolation device”. For this reason, the main goal of my thesis centers around the requirement, hence the proposal, of novel devices and strategies that could overcome the problems of existing isolation devices that are currently more widespread and also fill the technological vacuum currently present in the field of isolation with respect to the vertical component of the seismic action.
The chapters of this thesis are organized as follows: in Chapter 1 a careful and focused bibliographic research was carried out, aimed at the knowledge of the existing devices on the trade and their main problems.
In Chapter 2, attention is focused on the behavior characterization of materials that are used in isolation devices, such as steel, elastomer and PTFE (polytetrafluoroethylene). To better characterize the compression behavior of PTFE, laboratory specimens were made from the virgin product and with addition of filled parts in the chemical composition, and they underwent compression tests.
In Chapter 3, we venture into modeling through Finite Elements of the existing devices, e.g. Elastomeric HDRB (High Damping Rubber Bearing) and Friction Pendulum. This step has been of fundamental importance to highlight all the problems, already known in the literature, related to the devices already present on the market.
Once the study on existing devices was completed, the Chapter 4 was dedicated to the design of a new isolation device for the horizontal component of the seismic action, called HFRI (Hybrid Friction Rubber
(Vertical Isolation Device). After an initial design, obtained following the UNI standards in this regard, the finite element models were processed using the Abaqus CAE calculation code, using them it was possible to study the hysteretic behavior of devices that are both based on a dissipation mechanism by friction between PTFE and lubricated stainless steel. With these models it was also possible to study the tension state that develops in the devices. From these analysis it has been found that both devices are feasible and valid for use in the seismic protection of structures; in particular, the HRFI device is comparable, in terms of performance and size in plan, to a Friction Pendulum while for what concerns the VID device, since it is completely innovative and there are no similar products on the market, it was not possible to compare it with any other product.
As part of this research, a seismic isolation system was also studied, illustrated in Chapter 5, which includes the addiction of a device called Inerter combined with a dissipator and an elastic element, thanks to which it is possible to significantly reduce the displacements of the isolated structure, exploiting a peculiar effect that exploits the concept of damper to mass tuned but using small amounts of mass. Then, for a particular numerical application, two kind of inerter device has been designed, a rack-pinion one and a fluid inerter one, from which it is possible to demonstrate that the fluid inerter device is the one that better increase the mass. Finally, in Chapter 6, in order to improve the performance of the two designed devices (HFRB and VID), a glass fiber reinforcement was studied for the PTFE part, and, in particular, experimental test on two filled printed PTFE disk and one reinforced PTFE have been carried out. For better understand the behavior of the reinforced PTFE, numerical simulation with FE software has been conducted in the reinforced part. Both the experimental test and the FE simulation have demonstrate that the reinforcement improves the compressive behavior of the vergin PTFE. The research activity carried out during the three-year period led to the presentation of two patent applications for the devices studied, which are currently being processed.
Chapter 1
LITERATURE REVIEW
This chapter present the principles of seismic isolation and the evolution that affected design applications. Criteria for this technology from ancient to nowadays are done mainly to furnish the motivations for grasping the rest of the thesis. The basic theory of seismic isolation is also illustrated and the main features of commercial devices are studied to highlight their advantages and disadvantage.The chapter is organized as follows:
• Section 1 is just an opening, yet rigorous, a pleasant, friendly and not too technical introduction on the massive interest raised over the last years on the subject.
• Section 2 can be seen as a review of the basic background regarding seismic isolation and collects some applications.
• Section 3 includes the main features of different devices in order to do a comparison between them and understood better similarities and rules.
The exposition of the chapter is however carried out in the perspective of revisiting different topics within a unified framework.
1.1
Historical development of base
isolation system
Historical studies and archaeological campaigns have revealed that ancient civilizations were facing the problem of building structures that could resist to the earthquake. Important buildings, of many ancient civilizations, have survived several earthquakes, even of big magnitude. It seems that over 2000 years ago, builders had realized the importance of inserting "elements" that had the property of attenuating the effect of earthquakes.
In ancient Crete (2000-1200 b.C.) is possible to find symmetrical buildings consisting of monocellular nuclei. The structure was made up of stone blocks interconnected by wooden elements which, in addition to ensuring the connection between the elements, provided "plasticity" to the entire building, compensating for the "fragility" of the stone. These buildings were also resting on a layer of sand and gravel that, apart from smoothing soil irregularities, produced a filtering action against soil vibration during an earthquake.
Under the foundations of the Troy Walls (1500 b.C.), according to US archeologist Carl Blegen, was deliberately left a layer of compact earth between the foundation plan and the base rock. According to the archaeologist, the builders wanted to create a ground cushion in such a way as to protect the wall from the effects of the earthquake.
(a) (b)
In ancient Greece, the idea of protecting the structure was widespread by disconnecting it from the ground, interposing between it and the foundations some layers of material that could "translate" the construction against the ground in the event of an earthquake. In some cases, they lay under the firm foundation of the ceramic and clay layer walls. The ceramic protected the clay layer from moisture and dehydration, maintaining the plastic properties that dampened ground vibrations during the earthquake.We find concrete evidence of the application of seismic damping in antiquity in a classic passage of Naturalis Historia of Plinio il Vecchio quoting:
“Graecae magnificentiae vera admiratio exstat templum Ephesiae Dianae CXX annis factum a tota Asia. In solo id palustri fecere, ne terrae motus sentiret aut hiatus timeret, rursus ne in lubrico atque instabili fundamenta tantae molis locarentur, calcatis ea substravere carbonicus, dein velleribus lanae.” (n.h., 36,95)
Figure 1.2 Diana Temple in Efeso
Archaeological excavations have shown that trenches wider than the size of the foundations were excavated for substrutures, and a layer of 20 cm thick limestone gravel was laid on the ground. On this layer the walls were raised and the lateral voids were filled with waste material from stone processing. It is important to note that the material was not used again for filling. In this way the foundation walls were insulated and lined on all
faces, from the wet ground. Filis of Byzantium, about the construction of this temple, wrote:
"The architect released the bottom of the underworld, then dug ditches to great depths and laid the foundations. The amount of masonry used for underground structures was the entire mountain quarry. He insisted on his unmistakable stability... "
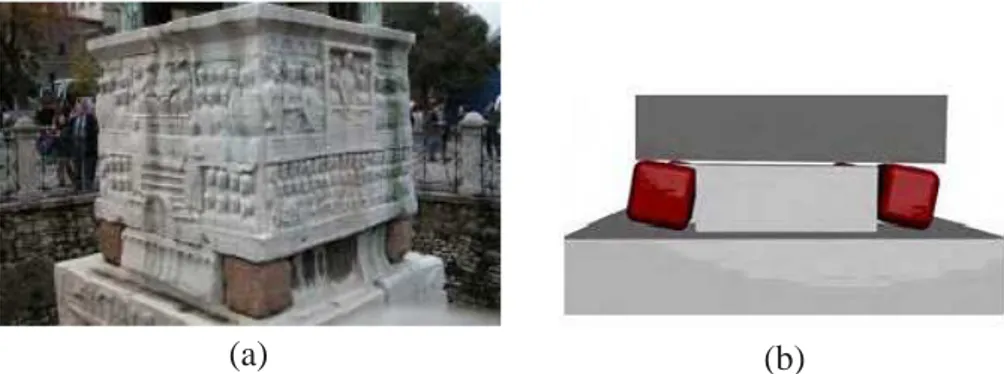
In antiquity another example of seismic isolation is the Dikilitash obelisk located in Turkey. It is a stone block of 18.69 m high, carved in Egypt in 1450 b.C and was erected in Instabul in 379-395 a.C. It is mounted on a marble base of 3x3x3m through 4 cubes (50x50cm) of bronze placed in the edges. It has been calculated that it can collapse with an earthquake of magnitude greater than 7.6 and having an epicenter at a distance of 5 km.
(a) (b)
Figure 1.3 Dikilitash obelisk: a) base of the real structure, b) base model
(a) (b)
There are certain references to a primal application of isolation to the base also in Kyoto for Sanjusangendo, a Buddhist temple built in 1266 a.C., containing a famous building built to accommodate 1000 statues. Below the foundations were laid layers of coal, woolen yarns, sand, so that it could favor the sliding of the structure with respect to the ground. The temple did not suffer damage following the 1995 Kobe earthquake (only 4 statues were slightly damaged).
Figure 1.5 Temple of Sanjusangendo
1.1.1
From 1900 to nowadays
In 1870 thanks to Jules Touaillon we have the first document attesting to the idea of designing a building with a system that decouples the motion of the structure from the ground (Figure 1.6 a)). The patent was based on the use of spheres interposed between the foundation of the structure and foundations, but never had any practical application.
More than a century ago, in 1885, John Milne, a professor of engineering in Japan, built a small wooden house on balls in cast-iron plates with saucer-like edges on the heads of piles, to demonstrate that a structure could be isolated from earthquake shaking (Housner et al. 1997). However, the building behavior under wind loads was not satisfactory. So, he reduced
the balls diameter from 10 inch to 1/4 inch. By this mean, the building became stable against wind loads and was evidently successful under actual earthquake action. In 1891, after Narobi earthquake, the Japanese Kawai, proposed a base isolated structure with timber logs placed in several layers in the longitudinal and transverse direction (Figure 1.6 b)) (Izumi 1988).
a) b)
Figure 1.6 First patents on isolation: a) Touaillon; b) Kawai
In 1906, Jacob Bechtold of Germany applied for a U.S. patent in which a seismic-resistant building has to be placed on rigid plate supported on spherical bodies of hard material (Figure 1.7 a)) (Buckle and Mayes1990).
In 1909, a medical doctor from England, Calentarients, had submitted a patent application to the British patent office for a method of building construction. In his method, a building is constructed on a layer of fine sand or talc that would allow the building to slide in an earthquake, there by reducing the force transmitted to the building itself (Figure 1.7 b))(Kelly 1986).
a) b)
Figure 1.7 First patents on isolation: a) Bechtold b) Calentarients
He also invented ingenious connections for gas and sewer networks, so as to avoid damage during ground vibrations. A patent that never had a practical application.
Following the earthquake of 1908, resulting in a tsunami that hit Messina and Reggio Calabria causing between 80,000 and 120,000 deaths and the collapse of 90% of Messina's buildings, the City Reconstruction Commission proposed two intervention techniques that provided for decoupling the building from the foundations by inserting a layer of sand or rollers under the columns that allowed the building to move horizontally. The second one was recommended between the two approaches. Unfortunately, these proposals were never accepted.
In 1911, the scholar Domenico Lodà invented the first "seismic isolator" in history (see Figure 1.9). This patent provided a support system that prevented the transmission of seismic movements and anticipated modern isolator solutions. This device can be considered as the ancestor of current isolators.
One notable historic structure, however, is Frank Lloyd Wright’s Imperial Hotel in Tokyo, completed in 1921. This building was founded on a willow layer of firm soil which in turn was supported by an underlying layer of mud. Cushioned from devastating ground motion, the hotel survived the 1923 Tokyo earthquake and later Wright wrote in his autography (Wright 1977) of the “merciful provision” of 60 to 70 feet of soft mud below the upper 8 foot thick surface soil layer which supported the building. The Imperial Hotel is an evidence that base isolation works and seismic protection can be achieved by relatively simple means. Even though the building suffered damage, Wright is worthy of having completed a work, integrating architecture and anti-seismic engineering, which still puts it at the forefront for that period.
In 1929, Robert de Montalk of New Zealand filed a patent application for an invention comprising a means whereby a bed is placed and retained between the base of a building and its solid foundation. The bed was being composed of material which will absorb or minimize seismic shocks (DeMontalk 1932).
Again in 1929, R. R. Martel proposed the so-called "Flexible first story concept", which consisted in the introduction of flexible columns on the first floor to lengthen the natural structure of the structure (Figure 1.8). It was proposed that the first-story columns should be designed to yield during an earthquake to produce isolation and energy-absorbing actions. However, to produce enough damping, several inches of displacements is required, and a yielded column has greatly buckling loads, proving the concept to be impractical.
Figure 1.9 First patents on isolation: Lodà
To prevent the structure from moving too far, the first story is constructed underground and energy dissipators are installed at the top of this story (Arnold 2001). To overcome the inherent dangers of soft supports at the base, many types of roller bearing systems have been proposed. The rollers and spherical bearings are very low in damping and have no inherent resistance to lateral loads, and therefore some other mechanisms are needed to provide wind restraint and energy absorbing capacity. A long duration between two successive earthquakes may result in the cold welding of bearings and plates, thus causing the system to become rigid after a time. Therefore, the application of the rolling supports was restricted to the isolation of special components of low or moderate weight (Caspe 1984).
Other developments were with Green (1935) and Jacobsen (1938) studies, which led to the introduction of the concept of energy absorption by plasticization. The Los Angeles Olive View Hospital was built using this concept, but the system shown itself to be inadequate, undergoing the soft floor mechanism, which was instead a virtuosity of the structure. In 1971, shortly after the end of the construction work, the San Fernando
damage. It was noted that it was not possible to absorb the earthquake energy only with a column plan. Analyzing, in fact, the behavior of the Olive View Hospital Anil K. Chopra concluded: "Though the buildings with soft planes are obviously unsuitable for the seismic regions, their response during the earthquake past suggests the possibility of reducing damage to the building Through a base isolation system that acts as a kind of soft floor”.
Simultaneously to the development of the soft first-story approach, the flexibility of natural rubber was also seen to be another solution for increasing the flexibility of the system. The first use of a rubber isolation system was in 1969 to protect a structure from earthquake, and it was an elementary school in Skopje, Yugoslavia. The Pestalozzi School, a three story concrete structure designed and built by Swiss engineers, is isolated by a system known as the Swiss Full Base Isolation-3D System (Staudacher et al. 1970). The rubber bearings used in this application were completely unreinforced so that the weight of the building causes them to bulge sideways. To improve the building stability under minor vibrations, glass blocks acting as seismic fuzes are intended to break when the seismic loading exceeds a certain threshold. Owing to have the same stiffness of the isolation system in all directions, the building bounces and rocks backwards and forwards (Jurukovski and Rakicevic 1995). Because of this, the adoption of these devices turned out to be unsatisfactory and they were no longer used in others application.
Seismic isolation became a reality in the seventies in England, where were produced the first elastomeric bearings by the MRPRA (Malaysian Rubber Producers' Association Research), who devised a process for vulcanizing rubber layers with a stainless steel. These bearings are very stiff in the vertical direction to carry the structural weight but they are very flexible horizontally to enable the isolated structure to move laterally under strong ground motion.
The first application was made in France in the early 70s, in order to safeguard a series of nuclear power stations and plant facilities. The utility developed a standard nuclear power plant with the safety grade equipment qualified for 0.2g acceleration. The system combines laminated neoprene bearings with lead-bronze alloy in contact with stainless steel, the sliding surface being mounted on top of the elastomeric bearing. The coefficient of friction of the sliding surface is supposed to be 0.2 over the service life of the isolator (Electrcité-de- France System).
In the early 1980s, developments in rubber technology led to new rubber compounds which were termed high damping rubber (HDR) (Derham and Kelly al. 1985)
In the 80s the seismic isolation technique spread throughout the world with important applications in bridges and strategic buildings, especially in the U.S. and New Zealand, elastomeric isolators with high damping rubber using high dissipation (High Damping Rubber Bearing) or isolators with lead plug, Lead Rubber Bearing (LRB) (Tarics et al. 1984; Anderson 1989, Charlerson. 1987, Reaveley et al. 1988); in Japan the solution initially more adopted involved the use of low-damping elastomeric devices, Low Damping Rubber Bearing (LDRB) with the addition of viscous or hysteretic dampers (Kelly 1988).
Later, a large number of isolation devices were developed including rollers, springs, friction slip plates, capable suspension, sleeved piles, and rocking foundations. Now seismic isolation has reached the stage of gaining acceptance and replacing the conventional construction, at least for important structures.
Moreover, after the two catastrophic events such as the1994 Northridge and the 1995 Kobe earthquake, which struck respectively
additional input. Indeed in those events the isolated structures turned out to be an excellent performance than that one of the equivalent fixed base structures located in the same affected area (Asher et al. 1995).
After these events, the number of applications of seismic isolation has undergone considerable development particularly in Japan. The interest for this application is remarkable in existing buildings, in which the seismic isolation can reach levels of security significantly higher than those achieved by the traditional type of retrofitting.
In USA the first examples of seismic retrofitting of existing buildings by basic isolation go back to the mid-90s. The structures were large buildings such as City Hall in Oakland, San Francisco and Los Angeles. In all above cases it have been used rubber devices with lead plugs or high damping bearing (LRB or HDRB). Recently, important applications of sliding isolators with curved (Amin and Mokha 1995 ) or flat surface have been applied in the U.S.A., with the addition of auxiliary devices re-centering rubber (Way and Howard 1990).
In the last 40 years in Italy, expecially after the earthquake in Friuli (1976) where the viaduct Somplago, protected with a seismic isolation system relatively simple but effective, was the only viaduct without damage, the use of seismic isolation has experienced a constant development. In particular in the decade from 1983 to 1993 seismic isolation was widely used in Italy for the protection of highway bridges and viaducts (Medeot 1991).
For this reason, important national and international research programs, involving companies, research institutes and Italian universities, have been carried out in order to develop the efficacy of the seismic devices and new technologies for devices and isolation systems.
Seismic isolation has been studied at different scale levels and for different devices, in the last years has been carried out dynamic tests on isolators individual small-scale (Kelly and Quiroz 1992) and real scale (Braga et al. 1997), or the performance of dynamic shaking table tests on scale models of isolated structures (Dolce et al. 2001 and 2008).
1.2
Basic concepts in seismic isolation
Base isolation is the most effective technique to mitigate the effect of seismic action. It is generally realized by some device. A seismic event is manifested by the vibrations induced by the movement of the ground and generates in the structure forces inertia equal to the product of its masses for accelerations. To avoid structural damage during an earthquake, it would be necessary to increase the resistance of the structure proportionally with the intensity of the earthquake.
The underlying principle of seismic isolation it is to avoid the earthquake, rather than to resist, and it is applied decoupling the dynamic response of the building from the ground motion. Decoupling is obtained through the interposition of devices, between structure and foundations, with low horizontal stiffness and high dissipative behavior in order to provide a lower fundamental frequency of the structure and to increase the overall damping of the structure.
1.2.1
Theory of base isolation
The linear theory of seismic isolation is provided in detail in Kelly 1993. Likewise, as for fixed-frame structures, where the study of dynamic behavior starts from the study of the simple SDOF system, the characteristic aspects of the dynamic behavior of base isolated structures can be derived from the analysis of a simplified model, with only two degrees of freedom.
The study of the n degree of freedom system, with lumped mass, linear springs and linear viscous damping, is developed with the technique of modal analysis that allows to identify changes in dynamics features, vibration frequencies and modal shapes determined by the isolation system on the elevation structure. The equation of motion of the structure can be written in the following form:
ˆ
ˆ ( ) ( ) ˆ ( ) ˆ[ ( ) ( )]
g b
t + t + t = − u t +u t
T
ˆ
( )
( )
( )
( )
( )
tot b b b b b tot g
m u t
ɺɺ
+
c u t
ɺ
+
k u t
= −
m u t
ɺɺ
−
τ
Mu
ɺɺ
t
(1.2)and in matrix form:
T ˆ ˆ ( ) ˆ 0 ( ) ˆ 0 ( ) ˆ ( ) ˆ tot b( ) 0 b b( ) 0 b b( ) tot b t t t u t u t c u t k u t m m + + = − M Mτ u C u K u Mτ τ M ɺɺ ɺ ɺɺ ɺɺ ɺ (1.3)
where
M
ˆ
,Cˆ andK
ˆ
are the n-dimensional matrices of mass, damping and stiffness of the superstructure as if it was on a fixed base, τ is then
x 1
influence vector of the substructure associated with the ground motion
( ) g
u tɺɺ and
0
is an
x 1
vector of zero terms;u
( )
t
,ɺu
( )
t
andɺɺ
u
( )
t
are, respectively, vectors of displacements, velocities and accelerations of the significant D.O.F. of the structure relative to the base isolation system while u t is the displacement of the base isolation system; b( ) c , b k are b respectively the damping coefficient and the stiffness of the base isolation system..
Figure 1.11 Schematic sketch of a base isolated structure: a) structural scheme with the base isolation system b) useful scheme for the definition of the equation of motion
(Muscolino 2002) The total mass mtot is defined as follows:
T 1 ˆ n tot b b i i m m m m = = +τ Mτ= +
(1.4)being m the mass of the isolation system and b m the mass of the generic i storey of the structure.
In the spirit of the substructure approach, two subsystems can be identified from Figure 1.11, the primary system is the (linear) superstructure, which is subject to the ground motion along with the inertia forces transferred by the secondary system, the base isolation system, which is in turn excited by a feedback of the primary system. Since we have written the equations in relative displacements, the resulting Equation (1.1) are decoupled in terms of elastic and viscous forces but coupled in terms of inertia forces due to the off-diagonal terms of the
M
ˆ
matrix in Equation(1.3). The latter terms characterize the dynamic interaction of the two subsystems. It is easy to observe that while the superstructure can realistically be considered a classically damped system, the Caughey and O’Kelly condition (Caughey 1965) being generally satisfied, due to the high contrast in damping between the superstructure and the BIS, the base-isolated building is a non-classically damped system (Chopra 2012). Natural frequencies and modes of vibration of such systems are different in the undamped and damped cases; in fact, one should solve a complex-value eigenproblem (including the damping matrix) to decouple the equations of motion in the modal subspace. This fact significantly complicates the mathematical aspects making the derivation of the eigenvalues and eigenvectors computationally more demanding. The conventional response spectrum method neglects this complication and indeed deals with the base isolation building as a classically damped structure, thus solving the following real-value eigenproblem associated with the stiffness and mass matrices reported in equation (1.3):= 2
where Φ and Ω2 are the modal matrix and spectral matrix, respectively, collecting the first m(with
m n
≤ +
1
) eigenvectorsφ
i and eigenvaluesω
i2 . Generally, the arbitrary multiplicative factor of the natural modesφ
i is chosen such that the modal matrix is orthonormal to the mass matrix,T
m
=
Φ ΜΦ I , being m
I the identity matrix of order m.
In order to make some considerations on the advantages of seismic base isolation, we evaluate the frequencies of an isolated single degree of freedom structure. The equations of the motion of this structure are:
( ) ( ) ( ) ( ) ( ) ( ) ( ) ( ) ( ) ( ) b g tot b b b b b tot g mu t mu t cu t ku t mu t mu t m u t c u t k u t m u t + + + = − + + + = − ɺɺ ɺɺ ɺ ɺɺ ɺɺ ɺɺ ɺ ɺɺ (1.6)
Making the following position
2 2 0 0= 2 = 2 b iso tot b iso tot b tot k k c m km m c m m k m
ω
ζ
ω
ζ
γ
= = = (1.7) we obtain: 2 0 0 0 2 ( ) ( ) 2 ( ) ( ) ( ) ( ) ( ) 2 ( ) ( ) ( ) b gb iso iso b iso b g
u t u t u t u t u t u t u t u t u t u t
ζ ω
ω
γ
ζ ω
ω
+ + + = − + + + = − ɺɺ ɺɺ ɺ ɺɺ ɺɺ ɺɺ ɺ ɺɺ (1.8)The natural frequencies can be calculated by solving the eigenvalues problem defined in equation (1.5) that leads to the following characteristic equation:
{
}
2 2 2 2 2 2 2 2 1/ 2 1 0 0 0 2 1 ( ) [( ) 4(1 ]2(1 ) iso iso iso
ω
ω ω
ω ω
γ ω ω
γ
ω
= + ± + − − ) − (1.9)Assuming that
ω
iso2 <<ω
02 the equation (1.9) can be written as follows: 2 2 2 2 1 min 2 0 2 2 2 2 0 2 min 2 0 1 1 1 iso iso iso ω ω ω ω γ ω ω ω ω ω γ γ ω ≡ − ≡ + − ≃ ≃ (1.10)Taking into account that
ω ω
iso2 / 02 ≪1and thatγ
<
1
, it can be seen that the first frequency of the isolation-SDOF system is close to the frequency of the isolation system and that the second frequency is greater than that of the SDOF due to the presence of the basement.This implies that the fundamental mode is associated with the isolation system and this can be designed to reduce stress on the structure. In the Figure 1.12 the responses are plotted in the time and frequency domain of
fixe (ω0 =14.14 rad/s, ζ0 =0.05, m=5000 kg) and isolated SDOF
(ωiso=3.14 rad/s, ζiso =0.1, γ =0.45), subjected to
7 3 ( ) exp( / 30) sin(3 ) k f t kt kt = =
− ,.In the latter case the system is not classically damped and the transfer function of the relative displacements of the SDOF system has two peaks near the pulsations, equation (1.10).
From the exam of the response in the time domain, it can be seen that, due to the introduction of the base isolation system, the relative displacements of the structure are strongly reduced with respect to the base. Instead, looking on the response in the frequency domain it is shown that in the case of the fixed SDOF system, the predominant circular frequency is near the natural oscillation pulsation. In the case of the isolated structure, however, this does not occur because the ordinate of the first peak, close to the frequency of the isolation system, is smaller than that of the forcing and of the second natural vibration of the composed system.
Figure 1.12 Response function, in terms of relative displacement, in the time domain and in the frequency domain of an SDOF system: a) fixed system; b) isolated system
1.2.2
The Italian code for base isolated structures
A first specific legislation to regulate the construction of buildings in concrete and masonry dates back in Italy to 1996, with a minister ordinance. Immediately after the earthquake of 31 October 2002, which affected the territory on the border between Molise and Puglia, the Department of Civil Protection has adopted the ordinance of Council of Ministers no. 3274 of 20.03.2003, which includes two chapters on seismic isolation of buildings and bridges, in order to provide an immediate response to the need to update the classification of seismic and earthquake regulations.
This seismic code has been for a long time not mandatory but only indicative of the basics of seismic design requirements. Only in 2008 it was published in the “Gazzetta Ufficiale”, the last Italian seismic code, called "Nuove Norme Tecniche delle Costruzioni". The new technical regulations are based on the European standards related to Eurocode 8 and in particular the parts relating to the evaluation of the seismic horizontal forces and the seismic isolation design. In Chapter 7 the New Italian Code introduce the seismic design rule action. Paragraph 7.10 provides criteria and rules for construction, bridges design and for the retrofitting of existing structures in which an isolation system is placed below the construction. The legislation introduces the terms "isolation" and "dissipation" referring to innovative techniques that propose the use of devices in the structure of the constructions in order to protect them from seismic loads.
The reduction of the horizontal seismic response can be obtained by two strategies of isolation, or through their appropriate combination: a) increasing the fundamental period of the construction to bring it in the field of minors acceleration response;
b) limiting the maximum horizontal force transmitted.
In both the strategies, the isolation performance can be improved through the dissipation in the isolation system of a substantial portion of the mechanical energy transmitted from the ground to the building. Italian code includes provisions concerning the devices. Isolation devices and their connection to the structure must be designed to ensure the access and to