hydrogen production from metal
hydrides
Chemical Sciences PhD
XXIV Cycle
Author: Roberta Zito
Tutor: Prof. C. Crisafulli
Abstract...pg. 1
1.Introduction...pg. 4
1.1 Hydrogen production through NaBH4 hydrolysis……….………...pg. 4 1.2 References………..………...…….….pg. 10 .2. Aim of work…………..……..………..….pg. 13
3. Methods and analysis techniques ……….………pg. 14
3.1 Characteristics and preparation methods of catalysts………..…...pg. 14 3.2 Methods of catalysts characterization………..…...pg. 16 3.3 Catalytic activity……….pg. 244. Hydrogen production through NaBH
4hydrolysis over supported Ru
catalysts………..….pg. 27
4.1 Role of the support……….………...pg. 27 4.2 Role of the ruthenium precursor……….……….…..pg. 34 4.3 Catalytic activity at fixed controlled temperature and kinetic parameters…....pg. 36 4.4 Catalyst characterization and discussion………...pg. 50 4.5 Conclusions………...pg. 58 4.6 References……….…....pg. 595. Hydrogen production through NaBH
4hydrolysis over Ru catalysts supported
on different carbons………..………..……….pg. 60
5.1 Catalytic activity tests and kinetic measurements on activated carbons supported Ru
catalysts………..………...pg. 60 5.2 Catalyst characterization……….………..…pg. 70 5.3 Discussion………...pg. 75 5.4 Conclusions………...pg. 78 5.5 References………...pg. 78
6. Hydrogen production through NaBH
4hydrolysis over bi-metallic catalysts
supported on vegetable carbon……….……….…pg. 80
6.1Catalytic activity tests on bi-metallic catalysts ……….………....pg.80 6.2 Discussion………..….………..…pg. 84 6.3 References………...pg. 85Abstract
Nowadays proton exchange membrane fuel cell (PEMFC) using hydrogen as fuel is considered as one of the most promising alternative to combustion engines due to its zero emissions. In order to operate a PEMFC successfully, a safe and convenient hydrogen storage and production system is necessary. The development of a hydrogen economy (that is production, storage, distribution and consumption) is today quite difficult due to flammability and hydrogen storage problems. A stabilized aqueous solution of metal hydride is considered appropriate for use as hydrogen storage material and regarded as an ideal source of pure hydrogen for fuel cells applications. In particular, NaBH4 is the preferred hydride due to its high hydrogen storage capacity (10.8 wt%) representing a promising on-board hydrogen generation method for portable PEM fuel cells. Moreover, sodium borohydride is non-flammable and non-toxic. The by-products of hydrolysis reaction (sodium metaborates) are environmentally friendly and can be recycled in order to re-synthesizing NaBH4. Sodium borohydride reacts with water, forming 4 moles of hydrogen and 1 mol of sodium metaborate, according with the following exothermic reaction:
NaBH4 + 2H2O → NaBO2 + 4H2 + 217 KJ/mol
To inhibit the self-hydrolysis reaction, NaBH4 solution must be maintained at pH > 13. At this pH, NaBH4 solution is very stable and the hydrogen release occurs only if the solution is in contact with specific and very active catalysts permitting the ideation of HOD (hydrogen on demand) systems in which the hydrogen production occurs only when required from the application.
During last years, heterogeneous catalysts, considered more suitable for hydrogen generation, were based on Ru, Co, Pt, Ni, Pd. The choice of the support and the metal precursor can have a key role in the optimization of the catalytic performance of a supported metal catalyst. The support can take part directly to the reaction mechanism favoring the adsorption/desorption of the reactants/products on the catalytic system or it can influence the dispersion of the catalytically active species stabilizing them against sintering. Precursor used for catalysts preparation can influence the dispersion and the metal size of the active species over the support.
Considering our preliminary experiments and data of literature showing that catalysts based on ruthenium metal have a good catalytic activity, for this study, ruthenium metal catalysts on different supports such as γ-Al2O3, CeO2, TiO2, activated carbon (a mineral carbon with high surface area) were prepared. Subsequently catalysts were tested in the reaction of hydrolysis of NaBH4 in order to have a controlled system of hydrogen on demand with the hydrogen flow required from the application. We found that Ru supported on an activated carbon of mineral origin with high surface area, is more active with respect to Ru on other supports, such as ceria, titania and alumina. The different catalytic behavior of the prepared catalysts was explained using the characterization of catalysts (TPR, CO chemisorption, TEM, SEM). The best performances of Ru/activated carbon were related both to the high surface area of the activated carbon and to its high chemical inertness in the strong basic environment. On the most active system, namely Ru on activated carbon, the effect of the Ru loading and the metal precursor (RuCl3 versus Ru(NO)(NO3)3) were investigated. Catalytic tests demonstrated that, for each precursor, the activity increases on increasing the Ru content. Moreover results showed that the Ru precursor strongly affected the catalytic activity. In fact we found that on the investigated carbon, the RuCl3 precursor resulted in better performance in terms of H2 yield with respect to Ru(NO)(NO3)3. Characterization data on Ru/activated carbon (mineral carbon with high surface area) showed that the Ru particle size on the investigated activated carbon support depended from the precursor used, Ru(NO) (NO3)3 resulting in much smaller Ru nanoparticles (average diameter < 1nm) compared to RuCl3 (average diameter of 2.4nm).
Considering that activated carbon (mineral carbon with surface area of 1059m2g-1) resulted the more suitable support for the reaction under study, we investigated the NaBH4 hydrolysis over Ru catalysts supported on activated carbons with different origin and morphological characteristics (surface area and elemental composition). The influence of two different Ruthenium precursors (RuCl3 or Ru(NO)(NO3)3) was also studied. We found that a higher surface area leads to smaller Ru nanoparticles, whereas the presence of alkali metals on the support (mainly potassium) and the use of RuCl3 as precursor (containing chlorine), promote the formation of larger Ru clusters. In this context, it was found that the best catalytic performance was obtained using the activated carbon of vegetable origin as support and Ru(NO)(NO3)3 as precursor that give Ru clusters with 3nm as diameter size.
Nowadays Ruthenium metal is considered the most appropriate catalyst for HOD applications to the much higher rate of hydrogen generation compared to all other metals but it’s expensive as noble metal (155$/ounce). So we focused our attention on Ni, Co, Fe metals
considered interesting due to their low cost. Mono-metallic and bi-metallic catalysts using low Ruthenium contents were prepared. Catalytic tests showed a good performance of the bi-metallic catalyst using Co and Ru as metals. In particular the bi-bi-metallic catalyst based on Co and Ru exhibits better performance respect to the single mono-metallic catalysts permitting a lowering in catalyst cost.
1. Introduction
1.1 Hydrogen production through NaBH
4hydrolysis
Proton exchange membrane fuel cells, also known as polymer electrolyte membrane (PEM) fuel cells (PEMFC) are the best type of fuel cell for the vehicular power source [1]. According to the U.S. Department of Energy “PEMFC are the primary candidates for
vehicles, for buildings, for much smaller applications such as replacements for rechargeable batteries”. PEM fuel cell is made by a solid organic polymer membrane (mostly
polyperfluorosulfonic acid), a thin plastic film that is the electrolyte, between two electrodes. The fuel for the PEMFC is the hydrogen while the charge carrier is the proton. The membrane is coated on both sides with dispersed metal particles (mostly platinum) that are active catalysts. When the hydrogen molecule goes to the anode, it is divided into protons and electrons. The hydrogen ions move through the membrane toward the cathode while the electrons go to an external circuit producing an electric power. Oxygen is supplied to the cathode and combines with electrons and protons forming water. The reactions that occur to the electrodes are represented in figure 1 and shown below:
Anode reaction: 2H2 4H+ + 4e
-Cathode reaction: O2 + 4H+ + 4e- 2H2O
Overall cell reaction: 2H2 + O2 2H2O
One disadvantage of PEMFC is that the electrolyte is required to be saturated with water for a correct functionality and for this reason a careful control of the moisture of the gases at the electrodes is necessary. The only sub-product of this process is water, so PEM fuel cells are attractive options for producing clean energy for on-board systems. The major hurdle for commercialization of PEMFC systems is the pure hydrogen gas supplying directly toward anode.
In order to operate a PEMFC successfully, a safe and convenient hydrogen storage and production system is necessary [2]. Hydrogen, in the molecular form, can be stored in pressurized vessels or in liquefied hydrogen tanks (liquid hydrogen). In its atomic form, hydrogen can be stored in metal hydride (MH) or in the form of hydride ions in alanetes (MAlH4) and borohydrides (MBH4) [3]. The hydrogen volumetric and gravimetric densities are important parameters for the valuation and selection of the method of hydrogen stocking. There are many methods for the hydrogen accumulation but due to the low boiling point of hydrogen (20.4K, 1atm) and the low density (90g/m3), some of these are not suitable for application on portable fuel cells [4].
The hydrogen liquefaction process spends about the 30% of the total energy contained in hydrogen. This energy is lost to bring and maintain hydrogen at -253°C (at this temperature hydrogen is in the liquid form), in fact the volumetric density of the liquefied hydrogen is very low, 70.8 Kg/m3. Another disadvantage is that the liquefaction process uses expensive machines for the conversion because it’s necessary to reduce the losses in fuel by evaporation. The compression of hydrogen gas above 35 MPa spends 20% of the total energy needed to pressurize the gas, reducing the volumetric density to 36 Kg/m3, using great volumes for stocking.
A safe and efficient way of stocking hydrogen is represented by hydrides that have a volumetric density of hydrogen higher than other materials. In figure 2 there is the representation of some materials in terms of gravimetric H2 density ([mass%], x axis) and volumetric H2 density ([Kg H2/m3], y axis).
Fig.2 Volumetric density vs gravimetric density for some materials.
As shown in figure 2, the best materials for the hydrogen stocking are hydrides because they have the best ratio between weight and volume of hydrogen.
In particular, sodium borohydride is the preferred material respect to other hydrides because it is non-flammable, non-toxic, easily liberates hydrogen at room temperature, the spent fuel (sodium metaborate) is environmentally friendly [5] and can be recycled for re-synthesizing NaBH4 [6]. In addition NaBH4 is the least expensive metal hydride commercially available and its hydrolysis reaction can be initiated at room temperature and proceeds in an auto-thermal manner (no energy input is necessary to sustain reaction) [5, 7, 8, 9, 10]. These advantages of hydrogen generation from NaBH4 hydrolysis reaction make it a promising on-board hydrogen generation method for portable PEM fuel cells. When one mole of sodium borohydride reacts with two moles of water, it generates four moles of hydrogen and one mole of sodium metaborate as shown in the following equation:
NaBH4 + 2H2O NaBO2 + 4H2
This reaction is exothermic and releases approximately 217KJ of heat per mole of NaBH4 reacted [11]. In figure 3, it’s presented the reaction mechanism of hydrogen generation by sodiumborohydride hydrolysis in which hydride on borohydride reduces proton from water. So the rate of hydrolysis decreases as pH increases, due to decreasing concentration of proton.
Basic solutions of aqueous borohydride, with pH>13, are considered stable because the hydrogen release cannot occur at this pH. For example, at pH 14 and 25 ºC, NaBH4 solution has a half-life of 430 days.
Fig.3 Reaction mechanism for sodium borohydride hydrolysis in absence of catalyst.
At pH>13, the aqueous solutions of sodium borohydride can release hydrogen gas only in presence of opportune catalysts, such as ruthenium for example. The reaction mechanism of hydrogen generation in presence of a metallic catalyst is shown in figure 4 [11, 12].
Fig.4 Reaction mechanism for sodium borohydride hydrolysis in presence of a catalyst.
The metallic catalyst, attracts H2O and BH4 forming intermediates on the catalyst. Stabilizing the active complex between H2O and BH4, the barrier to hydrolysis is lowered. A hypothesis could be that the formation of activated complex is easier when NaBH4 e H2O are adsorbed on the same catalyst cluster. Therefore larger clusters in dimensions could increase the catalyst activity due to the fact that the molecules can absorb themselves on the same catalyst site. When clusters are too big, the probability of finding active sites strongly decreases and therefore the catalytic performances decrease too. Smaller catalysts could decrease catalyst activity due to the fact that the molecules are not adsorbed on the same site and they are not enough near to react. So, in basic environment the hydrogen release by sodium borohydride hydrolysis occurs only if the solution is in contact with catalyst, permitting the ideation of “hydrogen on demand” (HOD) systems [11, 13]. The hydrogen gas is released only when there is a request from the application resolving many problems due to the hydrogen gas storing.
Hydrogen generation by hydrolysis of sodium borohydride dissolved in basic solution can be accelerated by elevated temperatures, use of metal catalysts (heterogeneous catalysis) and use of acid species (homogeneous catalysis). The first catalysts to be studied in the early 1950s were acids and transition metals working in the homogeneous phase [14]. Since then
numerous catalysts have been investigated with special attention devoted to heterogeneous catalysts based on Ru [5, 15-20], Co [4, 21-24], Pt [25-27], Ni [28-31], Pd [32, 33]. Heterogeneous catalyst is, in fact, considered more suitable for hydrogen supply on demand applications because the rate of hydrogen generation can be easily controlled by regulating the flow rate of the solution over the catalysts, in order to match the hydrogen request of the application [12]. Other controlling way of the hydrogen flow, suggested by Xia et al. [34], is inserting and removing catalyst into/from the NaBH4 solution. Even though Ni and Co have attracted much attention for the NaBH4 hydrolysis due to the lower cost than noble metals, Ru is considered the most appropriate system for HOD applications due to the much higher activity of this metal.
It is well known that the support can strongly affect the catalytic performance of a supported metal catalyst [35]. The metal interaction with the support may affect the formation, stabilization and state of the metal in clusters, which has a significant effect on the catalytic effect. Moreover the support can directly take part to the reaction, favoring the adsorption of the reactants/products or being involved through acid/basic sites. Numerous supports have been investigated for NaBH4 hydrolysis reaction such as γ-Al2O3 [36, 37], Co3O4 [38], LiCoO2 [39]. Nowadays, activated carbons have been reported to be particularly appropriate as supports for hydrolysis of NaBH4 as metal catalysts, providing optimum properties and stability [40-42]. In fact, activated carbons exhibit high surface area and chemical stability in aggressive environments (e.g. concentrated solutions of acids or bases).
Also the precursor used for the addition of the active species on the support can influence the catalytic performance of supported metal catalysts, affecting the dispersion and cluster size of the active metal on the support [20, 43, 44].
Moreover, considering that the hydrolysis of NaBH4 is a strong exothermal reaction and the knowledge of the kinetic behavior is fundamental for the design of a reactor on board, kinetic experiments on the Ru/activated carbons catalysts were carried out in order to obtain more insight the kinetic field [20]. Indeed some reports have appeared on the kinetics of metal catalysis [12, 18, 45, 46]. Zhang et al. [12] reported that the hydrolysis was zero order at low temperatures and first order at high temperatures with respect to NaBH4 when Ru catalyst was used, whereas Guella et al. [45] reported that the hydrolysis was first order with respect to NaBH4 when Pd catalyst was used. Finally Shang et al. [46] found that the hydrolysis of NaBH4 over ruthenium catalyst is zero order to NaBH4 concentration when water is sufficient.
1.2 References
[1] R.A. Lemons, Fuel cells for transportation. J. Power Sources 29 (1990) 251-64.
[2] L. Schlapbach et al., Hydrogen storage materials for mobile applications. Nature 414 (2001) 353-358.
[3] D.K. Ross, Hydrogen storage: the major technological barrier to the development of hydrogen fuel cells cars. Vacuum 80 (2006) 1084-9.
[4] J. Lee et al., A structured Co-B catalyst for hydrogen extraction from NaBH4 solution. Catal. Today 120 (2007) 305-310.
[5] S.C. Amendola et al., An ultrasafe hydrogen generator: aqueous, alkaline borohydride solutions and Ru catalyst. J. Power Sources (2000) 186–9.
[6] Y. Kojima et al., Recycling process of sodium mataborate to sodium borohydride. Int. J. Hydrogen Energy 28 (2003) 989–93.
[7] J.H. Wee et al., Sodium borohydride as the hydrogen supplier for proton exchange membrane fuel cell systems. Fuel Process Technol. 87(9) (2006) 811-9.
[8] Y. Kojima et al., Hydrogen generation by hydrolysis reaction of lithium borohydride. Int. J. Hydrogen Energy 29 (2004) 1213–7.
[9] Y. Kojima et al., Compressed hydrogen generation using chemical hydride. J. Power Sources 135 (2004) 36–41.
[10] Y. Kojima et al., Development of 10 kW-scale hydrogen generator using chemical hydride. J. Power Sources 125 (2004) 22–6.
[11] B.H. Liu et al., A review: hydrogen generation from borohydride hydrolysis reaction. J. Power Sources 187 (2009) 527–534.
[12] J. Zhang et al., Kinetics of Ru catalyzed sodium borohydride hydrolysis. J. Power Sources 164 (2007) 772–81.
[13] C.W. Chen et al., Method of preparing Ru-immobilized polymer-supported catalyst for hydrogen generation from NaBH4 solution. J. Hydrogen Energy 34 (2009) 2164-73.
[14] H.I. Schlesinger et al., Sodium borohydride, its hydrolysis and its use as a reducing agent and in the generation of hydrogen. J. Am. Chem. Soc. 75 (1953) 215-9.
[15] S.C. Amendola et al., A safe, portable, hydrogen gas generator using aqueous borohydride solution and Ru catalyst. J. Hydrogen Energy 25 (2000) 969-75.
[16] U.B. Demirci et al., Kinetics of Ru-promoted sulphated zirconia catalyzed hydrogen generation by hydrolysis of sodium tetrahydroborate. J. Mol. Catal. A 279 (2008) 57-62. [17] D. Gervasio et al., Room temperature micro hydrogen-generator. J. Power Sources 149 (2005) 15-21.
[18] Q. Zhang et al., Catalytic hydrolysis of sodium borohydride in an integrated reactor for hydrogen generation. J. Hydrogen Energy 32 (2007) 4731–5.
[19] Q. Zhang et al., Kinetics of catalytic hydrolysis of stabilized sodium borohydride solutions. Ind. Eng. Chem. Res. 46 (2007) 1120–4.
[20] C. Crisafulli et al., Hydrogen production through NaBH4 hydrolysis over supported Ru catalysts: An insight on the effect of the support and the ruthenium precursor. J. Hydrogen Energy 36 (2011) 3817–26.
[21] S.U. Jeong et al., A study on hydrogen generation from NaBH4 solution using the high-performance Co-B catalyst. J. Power Sources 144 (2005) 129-34.
[22] S.U. Jeong et al., Effect of preparation method on Co-B catalytic activity for hydrogen generation from alkali NaBH4 solution. J. Hydrogen Energy 32 (2007) 1749–54.
[23] W. Ye et al., Hydrogen generation utilizing alkaline sodium borohydride solution and supported cobalt catalyst. J. Power Sources 164 (2007) 544-8.
[24] Y. Huang et al., Accurately measuring the hydrogen generation rate for hydrolysis of sodium borohydride on multiwalled carbon nanotubes/Co-B catalysts. J. Hydrogen Energy 33 (2008) 7110 – 5.
[25] C. Wu et al., Cobalt boride catalysts for hydrogen generation from alkaline NaBH4 solution. Mater. Lett. 59 (2005) 1748-51.
[26] Y. Kojima et al., Hydrogen generation using sodium borohydride solution and metal catalyst coated on metal oxide. J. Hydrogen Energy 27 (2002) 1029-34.
[27] C. Wu et al., Hydrogen generation from catalytic hydrolysis of sodium borohydride for proton exchange membrane fuel cells. Catal. Today 93–95 (2004) 477–83.
[28] D. Hua et al., Hydrogen production from catalytic hydrolysis of sodium borohydride solution using nickel boride catalyst. J. Hydrogen Energy 28 (2003) 1095-100.
[29] B. H. Liu et al., Nickel- and cobalt-based catalysts for hydrogen generation by hydrolysis of borohydride. J. of Alloys and Compounds 415 (2006) 288-93.
[30] A. Pinto et al., Hydrogen generation and storage from hydrolysis of sodium borohydride in batch reactors. J. Hydrogen Energy 31 (2006) 1341–7.
[31] O. Metin et al., Hydrogen generation from the hydrolysis of sodium borohydride by using water dispersible, hydrogenphosphate-stabilized nickel (0) nanoclusters as catalyst. J. Hydrogen Energy 32 (2007) 1707–15.
[32] N. Patel et al., Thin films of Co-B prepared by pulsed laser deposition as efficient catalysts in hydrogen producing reactions. Appl. Catal. A 323 (2007) 18-24.
[33] N. Patel et al., Pd-C powder and thin film catalysts for hydrogen production by hydrolysis of sodium borohydride. J. Hydrogen Energy 33 (2008) 287–92.
[34] Z.T. Xia et al., Feasibility study of hydrogen generation from sodium borohydride solution for micro fuel cell applications. J. Power Sources 152 (2005) 46–9.
[35] M. Che et al., Impregnation and ion Exchange. In: G. Ertl, H. Knozinger, J. Weitkamp, editors. Preparation of solid catalysts. Weinheim: Wiley-VCH (1999) 315-40
[36] O. Akdim et al., Highly efficient acid-treated cobalt catalyst for hydrogen generation from NaBH4 hydrolysis. J. Hydrogen Energy 34 (2009) 4780-7.
[37] S. Basu et al., Chemical kinetics of Ru-catalyzed ammonia borane hydrolysis. J. Power Sources 188 (2009) 238-43.
[38] P. Krishnan et al., Cobalt oxides as Co2B catalyst precursors for the hydrolysis of sodium borohydride solutions to generate hydrogen for PEM fuel cells. J. Hydrogen Energy 33 (2008) 7095-102.
[39] P. Krishnan et al., Catalysts for the hydrolysis of aqueous borohydride solutions to produce hydrogen for PEM fuel cells. Appl. Catalysis B: Environmental 77 (2007) 206-14. [40] D. Xu et al., Hydrogen generation from hydrolysis of alkaline sodium borohydride solution using Pt/C catalyst. Cat. Comm. 8 (2007) 1767-71.
[41] D. Xu et al., Improved hydrogen generation from alkaline NaBH4 solution using cobalt catalysts supported on modified activated carbon. J. Hydrogen Energy 33 (2008) 7371-77. [42] Z.Z. Fang et al., Improved hydrogen storage properties of LiBH4 by mechanical milling with various carbon additives. J. Hydrogen Energy 35 (2010) 8247-52.
[43] C.Crisafulli et al., Effect of precursor on the catalytic behavior of Ru-Cu/MgO. J. Mol. Catal. 63 (1990) 55-63.
[44] C.Crisafulli et al., CO2 reforming of methane over Ni-Ru and Ni-Pd bimetallic catalysts. Catal. Lett. 59 (1999) 21-6.
[45] G Guella et al., New insights on the mechanism of palladium-catalyzed hydrolysis of sodium borohydride from 11B NMR measurements. J. Phys. Chem. B 110 (2006) 17024–33. [46] Y. Shang et al., Kinetic study of NaBH4 hydrolysis over carbon-supported ruthenium. J. Hydrogen Energy 33 (2008) 6719–26.
2. Aim of work
In modern society, hydrogen is an important chemical material which is considered an energy vector. Hydrogen is produced from various energy sources, stored, transported and used in industries. Hence fuel cells using hydrogen as fuel are under continuous development. In a fuel cell, the chemical energy released upon reaction of hydrogen and oxygen is directly converted into electric energy. Nowadays chemical hydrides (NaBH4, KBH4, LiH, NaH etc.) represent an ideal source of pure hydrogen for fuel cells applications. In particular generating hydrogen gas catalytically from NaBH4 hydrolysis (NaBH4 + 2H2O → NaBO2 + 4H2, ΔH= 300 kJ) has many advantages: NaBH4 solutions are non-flammable, the rate of hydrogen generation is easily controlled, the reaction by-product NaBO2 can be recycled, hydrolysis reaction can occur also at room temperature. To inhibit the self-hydrolysis reaction, NaBH4 solution must be maintained at pH > 13. At this pH in fact, the solution is very stable and the hydrogen production occurs only if the solution is in contact with specific catalysts. In this context, the aim of this study was to investigate the NaBH4 hydrolysis over mono and bi-metallic catalysts exploring the role of different supports and precursors. Catalysts of ruthenium metal on different supports as γ-Al2O3, CeO2, TiO2, activated carbon of mineral origin with high surface area were prepared and tested in the reaction of NaBH4 hydrolysis. Observing that activated carbon (surface area of 1059 m2g-1) resulted the more suitable support for the reaction under study, Ru catalysts supported on activated carbons with different origin and morphological characteristics (surface area and elemental composition) were also investigated in order to better clarify the role of support characteristics.
Moreover, considering that the hydrolysis of NaBH4 is a strong exothermal reaction and the knowledge of the kinetic behavior is fundamental for the design of a reactor on board, kinetic experiments on the Ru/activated carbons catalysts were carried out in order to obtain more insight the kinetic field.
3. Methods and analysis techniques
3.1 Characteristics and preparation methods of catalysts
For a good functionality of a catalyst, it’s necessary it has a simple and uniform structure with large superficial area and a good mechanical and chemical resistance. It has to produce hydrogen gas in the better conditions of temperature, pressure, short reaction times and high reaction yields.
The parameters useful in order to evaluate the characteristics of a catalyst are the activity, the selectivity, the superficial area, capacity to be regenerable, thermal, chemical and mechanical stability.
The activity represents the quickness in which the catalyst consents the reaction to reach the chemical balance and it is specific for each catalyst and for each process. Moreover for a catalyst, the activity respect to a specific reaction is based on the conditions of reaction as pressure, temperature, concentration of reagent and products etc. The catalytic activity of heterogeneous catalysts depends on the contact surface between catalyst and reagents. In fact on the surface of a heterogeneous catalyst there are “active cores” that are superficial atoms with un-sutured valences. For this reason, these “active cores” combine themselves with molecules of reagents for chemical adsorption.
The selectivity represents the capacity of a catalyst to promote a specific reaction between all possible reactions from the same reagents. This parameter is linked to the reaction conditions (pressure, temperature), the composition of reagents and the chemical-physic characteristics of the catalyst used.
The superficial area influences strongly the activity. A higher area means a great number of “active centers”; therefore many catalysts have a porous structure. The pores mustn’t be too much small in order to have an easy adsorption of reagents on the catalytic surface and desorption of products.
A good catalyst has to be regenerable. When the catalytic process is finished, the catalyst has to maintain the same characteristics in terms of catalytic functionality.
Definitely in order to have a good catalyst, useful for industrial applications, it needs to have high selectivity, activity, superficial area.
A catalyst can be prepared using different methods as impregnation, co-precipitation, deposition-precipitation, ionic exchange starting from different precursors. The methods mostly used are precipitation and impregnation.
In the precipitation method, more solutions or suspensions are mixed in order to start the precipitation. After the mixing process, there are phases of filtration, washing, drying, extrusion and heating. If it’s necessary a support for the catalyst, the precipitation steps occur in presence of the support material that is finely divided. Alternatively the support can be in form of a compound or a suspension and afterwards it is converted easily in the support required. Finally the system catalyst-support is activated by a heating step.
The precipitation method consents to have a good homogeneity of the catalyst and a uniform distribution of the active species on the final catalyst.
The impregnation method is the most common used and it’s based on two different modalities of contact between support and impregnated solution. In the first modality, the support is immersed in the solution in excess. The disadvantage is that the composition of solution changes for each support addition. A second method that consents a more adequate control is the incipient wetness impregnation. The solution of metal precursor, with suitable concentration, is distributed on support in order to fill the pores of support. For each addition of solution, there is a heating phase in order to evaporate solvent. In this experimental work, supported catalysts were prepared by incipient wet impregnation of the support with aqueous solutions of the precursors having an appropriate concentration of metal. This preparation was chosen because it consents a control of the active species adsorbed in the support and a good reproducibility. Moreover this method permits to have a uniform metal distribution in a support finely divided.
In this experimental work, the supports used were γ-Al2O3 (Alfa Aesar, named Al), TiO2 (Degussa P25, named Ti), CeO2 (prepared by coprecipitation, named Ce), three activated carbons (named AC): a) mineral carbon, named D (Nymco DX40) , 1059 m2g-1; b) vegetable carbon, produced from exhausted olive husks, named H (Sicarb, CA-SANSA), 1200 m2g-1; c) mineral carbon, named E (Carbonitalia Srl, E55), 650 m2g-1.
As metals, ruthenium and cobalt were used, starting with different aqueous solutions of the precursors as RuCl3 from Sigma Aldrich named C, Ru(NO)(NO3)3 from Alfa Aesar named N, Co(NO3)2 from Sigma Aldrich named CoN. All the catalyst prepared, were dried and reduced with a flux of hydrogen/argon in order to have the catalyst in the metallic form that is the catalytically active form. They were coded as MeXY/Z where Me is the metal, X the metal charge (wt %), Y the precursor and Z the support used.
3.2 Methods of catalysts characterization
The techniques used to characterize the catalysts, consent to correlate the morphological and chemical-physics properties with the catalysts performances. The techniques used to characterize the catalysts in this experimental work are the following.
Temperature programmed reduction (TPR) is a technique used most of all, in order to investigate the metallic oxides. The catalyst is put in a tubular reactor and a reducing flux of H2(5%)/Ar goes across the catalyst in continuous mode. In this conditions, the temperature increases linearly trough a temperature programmer. Increasing the temperature, the difference in the H2 concentration in the entrance and exit from the reactor, is revealed using a thermal conductibility detector (TCD).
In figure 5, it is represented the apparatus for the TPR measurements used in this experimental work.
Fig.5 Schematic diagram of the TPR apparatus: 1)needle valve, 2)regulation flow valve,
3)control unit of gas flow, 4)deoxo, 5)catarometer, 6)three neck valve, 7)molecular sieves trap, 8)reactor, 9)furnace, 10)computer, 11)integrator/recorder 12)thermocouple.
The apparatus for the TPR measurements is constituted by a reactor (8) with the catalyst, put in a furnace. The temperature of the furnace is controlled by a computer (10) that gives the experimental data. A gas flow of a reducing mixture composed by H2(5%)/Ar, goes across a deoxo apparatus (4) in order to avoid the impurities in the reducing mixture (tracks of oxygen for example) to arrive toward the reactor. The deoxo system assures a residual oxygen content to be inferior to 0.1ppm. The mixture of reducing gas goes across the deoxo system and after
it goes toward a flux controller (2) in order to regulate the flux magnitude. So it passes across a molecular sieves trap (7) put in a tank containing a bi-phase cooling mixture (acetone solid-liquid, at -80°C), in order to capture water molecules eventually present in the carrier (the water at this temperature is absorbed by the molecular sieves). The water will be desorbed when the trap is removed. At this point, the purified flux goes into the reference path of the catarometer (5) and passing by the three neck valve (6), arrives to the reactor (8) where the reaction of catalyst reduction occurs with the temperature increasing. The water formed in the reduction reaction of catalyst is captured by a second trap contained in a tank with the bi-phase system (acetone liquid-solid, at -80ºC). The signal variations revealed by the catarometer, are recorded by the calculator (10).
The reduction reaction is carried on the sample itself or the sample re-oxidized. In order to execute the re-oxidation process, a controlled flux of air is sent to the sample by the three neck valve (6). So it is possible to execute on the sample cycles of reduction-oxidation or redox cycles.
The computer (10) controls the linear increments in temperature of the electric furnace (9) from an initial to a final prefixed value. It is in fact linked to a thermocouple (12) contained in the furnace in proximity of the catalyst. The computer has other two functions: it reveals the catarometer output showing it on the monitor (hydrogen quantity variation in the reduction mixing versus temperature) and stores data.
The catarometer (5) or TCD (thermal conductibility detector) uses the variation in thermal conductibility of the gas flow depending on the hydrogen consumption process.
The TPR measurements consent to have a quantitative information (the hydrogen quantity used is directly correlated to the quantity of oxidized species to be reduced) and a qualitative information (the sample is reduced at a fixed temperature depending to the type of catalyst, oxidation state, precursor used, pre-treatment). Moreover this technique consents to study and optimize the pre-treatment of catalyst before it is used in its application.
In this experimental work, temperature programmed reduction (H2-TPR) tests were carried out in a conventional flow apparatus with a TCD detector, at heating rate of 10°C/min using 5 vol.% H2 in Ar. Before tests samples were dried in an oven at 120°C for 2h.
The chemisorption is a technique used to investigate the catalyst surface that gives information about the catalytically active species. A gas is put in contact with the catalyst and part of it is adsorbed on the catalyst surface. A volume of gas is selectively chemisorbed on the catalyst surface because the gaseous molecules link themselves with the metallic atoms forming a molecular monolayer. Figure 6 represents the apparatus used for chemisorption.
Fig.6 Schematic diagram of the chemisorption apparatus: 1).TCD, 2) regulation flow valve, 3)
three neck valve, 4) sampler valve of gas to be chemisorbed, 5) reactor, 6) furnace, 7) temperature programmer, 8) integrator, 9) molecular sieves trap, 10) control unit of gas flow,
D) deoxo.
The gas carrier is purified by the deoxo system (D), in order to eliminate the oxygen molecules and it is dehydrated passing through the molecular sieved trap (9) that is at the temperature of liquid nitrogen. After, it passes through the reference cell of the TCD detector, the sampler valve (4) for the introduction of gaseous sample, the reactor (5) containing the catalyst and the TCD measurement cell. Before the measurement of chemisorption, the catalyst is reduced at the temperature desired; in fact the reactor containing the catalyst is put in a furnace regulated by the temperature programmer. The catalyst is reduced using hydrogen gas that is introduced in the system by a regulation flow valve (2). After the reduction step, the gas to be chemisorbed (CO in this experimental work), is introduced by pulses of known volume through the sampler valve (4) and the volume at the exit of the reactor is revealed and recorded as shown in figure 7.
Fig.7 Typical graphics of pulse chemisorption.
Figure 7 represents a typical graphics of pulse chemisorption. From this graph it’s possible to extrapolate the chemisorbed gas quantity. In fact Vi is the volume of injected gas for each pulse, A1 and A2 are the areas of first signals, A0 is the middle area of the following signals (they correspond to the slug of gas passed through the sample but not chemisorbed). So the volume of chemisorbed gas is linked to other quantities by the following proportion:
V : Vi = (A0-Ai) : A0 The volume V is represented by the following relation:
V = [(A0 - Ai)/A0 ] / Vi
The sum of volumes, corresponding to signals of absorption, represents the volume of gas chemisorbed (Vm). Analyzing the quantity of chemisorbed gas for a gram of metal, it’s possible to have the dispersion value, the metallic superficial area, the middle dimension of metal particles present in the surface of support. In this experimental work, CO chemisorption was measured in a conventional pulse system operating at room temperature. Before the measurements, the samples have been pre-treated by reduction in flowing hydrogen at 300°C for 1h.
Surface area measurements are based on the experimental determination of a gas or vapor adsorption isotherm, at its boiling temperature, on the solid sample. From the adsorption isotherm, it’s possible to determinate the volume of adsorbed molecules in order to form a monolayer on the surface of 1 gram of sample (Vm). From Vm value and the area of one molecule of gas adsorbed, it’s possible to derivate the surface area in m2/g. Surface area measurements were carried out using the BET nitrogen adsorption method with a Sorptomatic series 1990 (Thermo Quest). Before the tests all samples were outgassed (10-3Torr) at 120°C.
The measurement procedure is based on the introduction in the burette containing the sample, fixed nitrogen volumes. Part of gas is adsorbed by the porous structure and the remaining part makes a pressure at equilibrium. In this experimental work, different supports were used and their surface area was calculated using this method. The supports used with relative superficial area values were γ-Al2O3 (Alfa Aesar, 221m2g-1), TiO2 (Degussa P25, 51m2g-1), CeO2 (prepared by coprecipitation, 180 m2g-1), a commercial activated carbon of mineral origin with high surface area (Nymco DX40, 1059m2g-1), a commercial activated carbon of vegetable origin with high surface area (Sicarb, CA-SANSA, 1200m2g-1), a commercial activated carbon of mineral origin with low surface area (Carbonitalia Srl, E55, 650m2g-1). So the activated carbons have a superficial area much greater than other materials that is promising for the quantity of catalyst that can be impregnated on the support.
The scanning electron microscope (SEM) permits to image a comparatively large area of the specimen, bulk materials (not just thin films or foils); it is also available for measuring the composition and properties of the specimen.
In a typical SEM apparatus (represented in figure 8), an electron beam is, for thermo ionic effect, emitted from an electron gun. Tungsten is normally used in thermionic electron guns because it has the highest melting point and lowest vapor pressure of all metals, thereby allowing it to be heated for electron emission, and because of its low cost. The electron beam, which typically has an energy ranging from 0.5kegs to 40kegs, is focused by one or two condenser lenses to a spot about 0.4nm to 5nm in diameter. The beam passes through pairs of scanning coils or pairs of deflector plates in the electron column, typically in the final lens, which deflect the beam in the x and y axes so that it scans over a rectangular area of the sample surface.
When the primary electron beam interacts with the sample, the electrons lose energy by repeated random scattering and absorption within a teardrop-shaped volume of the specimen known as the interaction volume, which extends from less than 100nm to around 5µm into the surface. The size of the interaction volume depends on the electron's landing energy, the atomic number of the specimen and the specimen's density. The energy exchange between the electron beam and the sample results in the reflection of high-energy electrons by elastic scattering, emission of secondary electrons by inelastic scattering and the emission of electromagnetic radiation, each of which can be detected by specialized detectors. Electronic amplifiers of various types are used to amplify the signals.
The most common SEM imaging mode collects low-energy (<50eV) secondary electrons that are ejected from the k-orbitals of the specimen atoms by inelastic scattering interactions with
beam electrons. Due to their low energy, these electrons originate within a few nanometers from the sample surface, which results in images with a well-defined, three-dimensional appearance. In this study, a layer of Platinum (200Ǻ) was sputtered on the supports investigated through SEM analysis to prevent specimen charging.
X-rays, which are also produced by the interaction of electrons with the sample, may also be detected in a SEM equipped for energy dispersive ray spectroscopy. Energy dispersive X-ray spectroscopy (EDS or EDX) is an analytical technique used for the elemental analysis or chemical characterization of a sample. Its characterization capabilities are due in large part to the fundamental principle that each element has a unique atomic structure allowing X-rays that are characteristic of an element's atomic structure to be identified uniquely from one another.
Depending on the SEM instrument, the resolution can fall somewhere between less than 1nm and 20nm. It depends directly from the spot size and the interaction volume but these two parameters are both large compared to the distances between atoms. So the resolution of the SEM is not high enough to image individual atoms, as it is possible in the shorter wavelength (i.e. higher energy) transmission electron microscope (TEM). The SEM microscope used in this experimental work was ZEIS model LEO 1550 equipped with EDX OXFORD instruments MOD 7426.
Fig.8 Scanning electron microscopy (SEM).
The transmission electron microscope (TEM) permits microscopic reviews at high resolution. In particular, this technique consents a crystallographic analysis through images in high resolution of the atomic planes in a crystalline structure, images of the defects of this structure, diffraction images. Figure 9 represents a transmission electron microscope, constituted by an electronic gun, electromagnetic lens for the deflection of the electronic beam, a fluorescent display where the images are formed. The electronic gun is made by a tungsten filament that emits electrons for thermo ionic effect and electric field applied. These two effects consent coherent and intense electronic beams. A difference of potential accelerates the electrons and they are introduced in the column of the microscope where there is a pressure of about 10-7Torr. When the electron beam passes across the sample to analyze, it splits itself into electron beams of diffraction with the same energy of the incident ray. These beams are collected through a goal lens put under the sample and focalized in order to compose the magnified image of the part of sample illuminated.
Fig.9 Transmission electron microscopy.
The microscope used in this experimental work was the JEOL, model JEM 2010 that uses an accelerating voltage of 200 KV and has a resolution point of 0.24nm. The powdered samples were ultrasonically dispersed in ethanol and a few droplets of the suspension were deposited on a Cu grid coated by a holey carbon film. After the solvent evaporated, the specimens were introduced into the microscope column. The average ruthenium size diameter estimated by TEM (dTEM) was calculated using the following formula: dTEM = di /in, where di is the diameter of the particle i and the index i is included from 1 and n (number of ruthenium particles).
3.3 Catalytic activity
The study of a catalytic activity permits to link the operative conditions to the process rate. The goal is to establish the better experimental conditions in order to have the maximum conversion. Two types of trials were carried out: trials without temperature controlling and trials in isothermal conditions.
All the trials for catalytic activity (with and without temperature controlling) were made in static mode also named trials in batch system. These trials use a constant quantity of sodium borohydride with note concentration that is put in contact with a fixed quantity of catalyst. A flowmeter is used to measure the hydrogen flow over time. The reaction of sodium borydride is strongly exothermic (ΔH reaction= 55Kcal mol-1 of hydrogen produced) and for this reason a thermocouple is inserted in the flask for the temperature monitoring. It is used a stirrer in order to have the solution in agitation and a homogeneous diffusion of the produced gas.
For the first type of experiments, without temperature controlling, a diagram of the apparatus used is showed in figure 10, in which it is represented the flask (containing the solution and the catalyst) that is linked to the flowmeter and the thermocouple. The catalytic activity tests were carried out at atmospheric pressure in a flask batch reactor equipped with a magnetic stirrer (300rpm).
In a typical experiment, it is revealed the hydrogen production and an increasing of temperature versus time on stream.
In the second type of experiments, conduced in isothermal conditions, the temperature was maintained at a constant value (± 0.5ºC) in a batch experiment, by circulating of ethylene glycol in an external jacket connected with the thermostat. In figure 11, it is showed the corresponding apparatus. The reaction of NaBH4 hydrolysis occurs in a three-necked flask used as reactor. The left-neck port is equipped with a thermometer immersed in the solution in order to monitor temperature. The central-neck port is linked to the flowmeter in order to measure the cumulative volume of the generated hydrogen over time. The right-neck port is used to put catalyst powder into the reactor. A stirrer is used in order to maintain the solution in agitation.
Fig.11 Apparatus for the batch trials with temperature controller.
Sodium borohydride solutions (10wt.%) were prepared by dissolving sodium borohydride (Fluka, purity >96%) into a 4wt.% NaOH solution.
Catalytic activity was valuatedin terms both of H2 yield, (considered as the ratio between the volume of hydrogen experimentally evolved and the theoretical one obtainable on the basis of the stoichiometric reaction), and the hydrogen generation rate (ml/min) as a function of time on stream. Before the catalytic activity tests, catalysts were reduced in flowing hydrogen at
300°C for 1h, cooled in hydrogen gas and after fluxed for 30 minutes at room temperature with helium gas.
4. Hydrogen production through NaBH
4hydrolysis
over supported Ru catalysts
4.1 Role of the support
In order to explain the key role of support, experiments were carried out using catalyst that differ themselves only for the support used. They were synthesized using the incipient wetness method with the same content of ruthenium catalyst, the same grain but on different supports. In all the experiments carried out without reaction temperature control (using the apparatus illustrated in figure 10), the NaBH4 solution (20ml) was poured into the flask, waiting until the temperature reached a constant value, finally the catalyst (0.15g, 14-20mesh grain size) was added to the solution.
The supports used were γ-Al2O3 named Al, TiO2 named Ti, CeO2 named Ce and oneactivated carbon (type DX40) of mineral origin with high surface area named D. They were investigated in terms of superficial areas that are reported in tab.1. The superficial area is a morphological parameter directly linked to the activity of a catalyst. In fact major superficial area means more metallic sites that can be distributed on the surface and hence more catalyst activity respect to the reaction under study. The order of superficial area is the following: D > Al > Ce > Ti. The values of superficial area for bare supports correspond to the values obtained for supported catalysts.
Tab.1 Superficial area.
Figure 12 shows the H2 yield as a function of time on stream observed over 2wt.% Ru catalysts on different supports (γ-Al2O3, TiO2, CeO2, D) prepared using Ru(NO)(NO3)3 as Ru precursor. These experiments were carried out starting the reaction at room temperature (T=25°C) without temperature control, which was, in fact, found to increase during the exothermic reaction. From the figure 12, it can be observed that the support used has a key role in addressing the performance of the investigated Ru catalysts, the activity being in the following order: Ru2N/AC > Ru2N/Ce > Ru2N/Ti > Ru2N/Al.
γ-Al2O3 TiO2 CeO2 DX40
221 51 180 1059
Fig.12 H2 yield versus time on 2wt.% Ru catalysts from Ru(NO)(NO3)3 on different supports (γ-Al2O3, TiO2, CeO2 and DX40).
The carbon activated support (type DX40) is considered the better support because the hydrolysis reaction finishes in the minor time. In fact using Ru on AC, the reaction reaches completion after 70min. With Ru on CeO2 the reaction occurs in 150min, whereas on titania and alumina supported samples the maximum yields after 150min are only 30%. The order in catalytic activity can be explained considering the order in superficial area for supports being the active carbon the support with greater superficial area and better catalytic activity, catalysts on ceria and titania follow the active carbon in terms of superficial area and catalytic activity. Ruthenium on alumina support is the last catalyst in terms of catalytic activity but it has a superficial area that is better than ceria and titania.
In order to explain the catalytic activity order that was in contrast with superficial area for ruthenium on alumina support, it was interesting to investigate the way of acting of bare support in the reaction ambience based on the aggressive alkaline component NaOH (the NaBH4 hydrolysis occurs in drastic conditions at pH 13 in order to inhibit the reaction without catalyst). The supports were investigated through SEM analysis first and after the contact with the alkaline solution (NaOH 1M). The sample after etching was dried in muffle. Figure 13 represents SEM images of alumina support before and after the NaOH etching for 15 hours at a magnitude of 100X. Figure 14 represents SEM images of alumina support before and after
0 20 40 60 80 100 0 30 60 90 120 150 Time (min) H2 y ie ld ( % ) Ru2N/Al Ru2N/Ti Ru2N/Ce Ru2N/AC
the NaOH etching for 15 hours at a magnitude of 4KX and a tilt angle of 35°. It’s evident that alumina is strongly corroded from the alkaline ambience therefore it’s not good for support catalyst in the NaBH4 hydrolysis reaction.
Fig.13 SEM images at magnitude 100X of alumina before and after NaOH etching for 15
hours.
Fig.14 SEM images at magnitude 4KX of alumina before and after NaOH etching for 15
hours.
Figures 15, 16, 17 represent SEM images of carbon support (DX40) before and after the NaOH etching for 15 hours at different magnitudes. It’s evident that carbon is not corroded by basic solution.
Fig.15 SEM images at magnitude 350X of carbon DX40 before and after NaOH etching for
15 hours.
Fig.16 SEM images at magnitude 2KX of carbon DX40 before and after NaOH etching for 15
hours.
Fig.17 SEM images at magnitude 5KX of carbon DX40 before and after NaOH etching for 15
Figures 18, 19, 20 represent SEM images of CeO2 support before and after the NaOH etching for 15 hours at different magnitudes. The support is not corroded by the alkaline ambience.
Fig.18 SEM images at magnitude 100X of CeO2 before and after NaOH etching for 15 hours.
Fig.19 SEM images at magnitude 2.5KX of CeO2 before and after NaOH etching for 15 hours.
Fig.20 SEM images at magnitude 7KX of CeO2 before and after NaOH etching for 15 hours.
Figures 21, 22, 23 represent SEM images of TiO2 support before and after the NaOH etching for 15 hours at different magnitudes. After etching step, the support is not visibly corroded by the alkaline ambience.
Fig.22 SEM images at magnitude 1KX of TiO2 before and after NaOH etching for 15 hours.
Fig.23 SEM images at magnitude 10KX of TiO2 before and after NaOH etching for 15 hours. Data of superficial area and SEM analysis rationalize the activity order of the catalysts prepared using the same metal content but different supports. In fact the active carbon (DX40) is the better support in terms of superficial area and it is not corroded by the alkaline ambience. The higher superficial area and the resistance to the alkaline ambience explain its better catalytic activity respect to other catalysts. The supports ceria and titania follow active carbon in terms of superficial area and they are not corroded by the alkaline ambience. So the order of catalysts in terms of superficial area corresponds to the catalytic activity order (as represented in figure 12). Alumina support has a great superficial area, higher than ceria and titania and lower than active carbon but the performances in terms of catalytic activity are not so good because of the support corrosion by the alkaline ambience. So the very low activity of alumina supported catalyst can be related, as confirmed by literature [1], to the fact that the strong alkalinity of the water solution used to stabilize NaBH4, exerts a disaggregating action toward alumina, leading to a great crumbling of the alumina grains during the reaction.
On the basis of SEM analysis, superficial area and activity order (as illustrated in fig .12) the carbon support DX40 could be considered better than other supports. So further investigations on this support were carried out.
4.2 Role of the ruthenium precursor
The characteristics of catalysts can be influenced from the support type used but also from the metal precursor. So using the better support in terms of superficial area and catalytic activity (active carbon, DX40), different catalysts prepared using the same support but two different precursors (RuCl3, Ru(NO)(NO3)3) were prepared and tested.
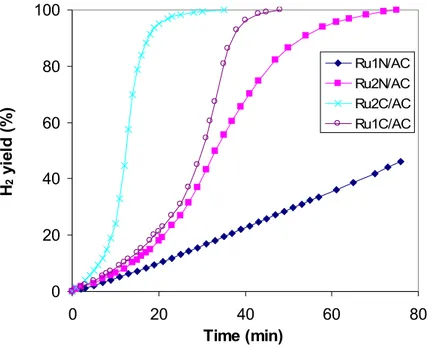
Figure 24 illustrates H2 yield as a function of time on stream, without temperature control, at an initial temperature of 25°C, over activated carbon (DX40) supported Ru catalysts, prepared from different precursors (RuCl3 and Ru(NO)(NO3)3)and with different Ru loadings (1 and 2wt%). For each precursor the activity increases on increasing the ruthenium content. Moreover there is a strong effect of the precursor used, in fact samples prepared by RuCl3 are sensibly more active than the corresponding ones prepared using Ru (NO)(NO3)3 as precursor. It can be observed that the sample with 1% of Ru prepared by RuCl3 (Ru1C/AC) is more active than that prepared by Ru(NO)NO3 at double Ru content (Ru2N/AC).
Fig.24 H2 yield as a function of time on stream (Tin=25ºC) over activated carbon (DX40) supported Ru catalysts prepared from different precursors and with different Ru loadings.
0 20 40 60 80 100 0 20 40 60 80 Time (min) H2 y ie ld ( % ) Ru1N/AC Ru2N/AC Ru2C/AC Ru1C/AC
It was interesting compare the supported catalysts Ru2N/AC and Ru2C/AC in terms of H2 generation rate profiles and corresponding temperatures measured. Figure 25 illustrates the H2 generation rate profiles and the corresponding measured reaction temperatures over Ru2N/AC and Ru2C/AC catalysts at an initial temperature of 25°C. The generation rate is very low for the sample prepared using Ru(NO)(NO3)3 as ruthenium precursor, on which a maximum of 100ml/min was reached after about 35min. A more efficient H2 production was obtained with the sample prepared using RuCl3 as ruthenium precursor, on which, the H2 production rate measured is quite high, with a maximum rate of 700ml/min ca. after 15min. This high value is really interesting from a practical point of view for hydrogen on demand (HOD) applications because so high initial hydrogen flow actives the fuel cell functionality. The corresponding measured temperature increases rapidly because the hydrolysis reaction is strongly exothermic. The temperature increasing for the Ru2C/AC catalyst is higher respect to Ru2N/AC catalyst because the temperature is directly correlated to the hydrogen flow produced. These trials demonstrated that in possible practical applications, it’s important considering the need to eliminate/exchange the heat produced from the reaction.
Fig.25 H2 generation profiles and corresponding reaction temperatures over Ru2N/D and Ru2C/D catalysts at Tin=25ºC. 0 100 200 300 400 500 600 700 0 20 40 60 80 Time (min) H2 g en er at io n r at e (m l/ m in ) 0 10 20 30 40 50 60 70 80 T em p er at u re ( °C ) Ru2N/AC Ru2C/AC Ru2N/AC Ru2C/AC
4.3 Catalytic activity at fixed controlled temperature and kinetic
parameters
The experiments, from which the considerations about the trend of catalytic activity were based, were carried out without temperature control (as explained in 4.2 paragraph). The trend of catalytic activity, illustrated in figure 24 and deduced from experiments without temperature control, is the following: Ru2C/D > R1C/D > Ru2N/D > Ru1N/D.
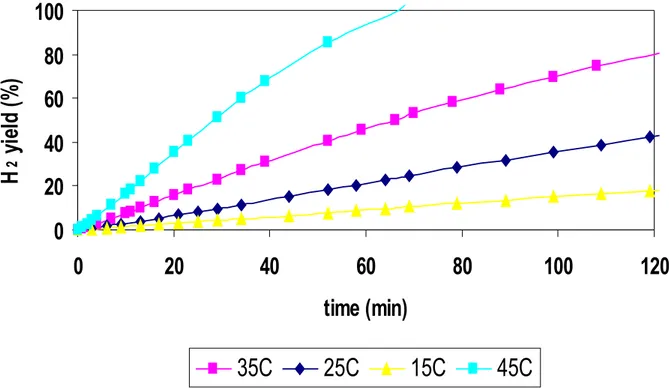
It’s important to underline that the hydrolysis reaction of sodium borohydride is strongly exothermic and this factor is intrinsic to the reaction. So, in order to define the catalytic trend without the temperature influence (the temperature increasing enhances the hydrogen production over time), experiments at fixed controlled temperature, using the apparatus illustrated in figure 11, were carried out. These experiments at fixed controlled temperature allowed evaluating the real ability of each catalyst to promote the hydrolysis reaction excluding the temperature increasing. In the experiments carried out at constant temperature, in order to promote the temperature control, the NaBH4 solution (13.4ml) was mixed with 26.6ml of NaOH 1M water solution, then poured into the flask, waiting until the temperature reached a constant value. So the catalyst (0.1g, 14-20mesh grain size) was added to the solution. The trials were carried out at four different imposed temperatures: 15, 25, 35, 45°C. Figure 26 illustrates a comparison among supported catalysts on active carbon DX40 at different ruthenium loadings and using as precursors RuCl3 and Ru(NO)(NO3)3. These experiments were carried out at a fixed temperature of 15°C. The trend of activity confirms data illustrated in figure 24 (obtained without a temperature controlling), the activity being in the order: Ru2C/D > R1C/D > Ru2N/D > Ru1N/D.
Figure 27, 28, 29 illustrate a comparison among the same catalysts at a fixed temperature respectively of 25°C, 35 and 45°C. The trend of activity confirms data illustrated in figure 24 (obtained without a temperature controlling).
So, it can be concluded that the trend of catalytic activity is the following: Ru2C/D > R1C/D > Ru2N/D > Ru1N/D and it is not linked to the temperature increasing enveloped in the reaction ambience during the experiment. Moreover it is not linked to the fixed temperature before the experiment using the apparatus showed in figure 11.
Fig.26 H2 yield as a function of time on stream (at temperature 15°C) over activated carbon (DX40) supported Ru catalysts prepared from different precursors.
0
50
100
0
20
40
60
80
100
time (min)
H
2yi
eld
(%
)
Ru1N/D at 15C
Ru2N/D at 15C
Ru1C/D at 15C
Ru2C/D at 15C
Fig.27 H2 yield as a function of time on stream (at temperature 25°C) over activated carbon (DX40) supported Ru catalysts prepared from different precursors.
Fig.27 H2 yield as a function of time on stream (at temperature 25°C) over activated carbon (DX40) supported Ru catalysts prepared from different precursors.
0
50
100
0
20
40
60
80
100
time (min)
H
2
yi
eld
(%
)
Ru1C/D at 25C
Ru2C/D at 25C
Ru1N/D at 25C
Ru2N/D at 25C
Fig.28 H2 yield as a function of time on stream (at temperature 35°C) over activated carbon (DX40) supported Ru catalysts prepared from different precursors.
Fig.28 H2 yield as a function of time on stream (at temperature 35°C) over activated carbon (DX40) supported Ru catalysts prepared from different precursors.
0
50
100
0
20
40
60
80
100
time (min)
H
2
yi
eld
(%
)
Ru1N/D at 35C
Ru2N/D at 35C
Ru1C/D at 35C
Ru2C/D at 35C
0
50
100
0
10
20
30
40
50
60
time (min)
H
2
y
ie
ld
(%
)
Ru1N/D at 45C
Ru2N/D at 45C
Ru1C/D at 45C
Ru2C/D at 45C
Fig.29 H2 yield as a function of time on stream (at temperature 45°C) over activated carbon (DX40) supported Ru catalysts prepared from different precursors.
It was important to study NaBH4 hydrolysis reaction for each catalyst (Ru2C/D, Ru1C/D, Ru1N/D, Ru2N/D) in terms of kinetic parameters in order to calculate the kinetic constants and the apparent activation energy for each catalyst. The activation energy parameter consents to better rationalize the catalytic activity because lower activation energy means that the reaction is quicker and so a greater catalyst activity.
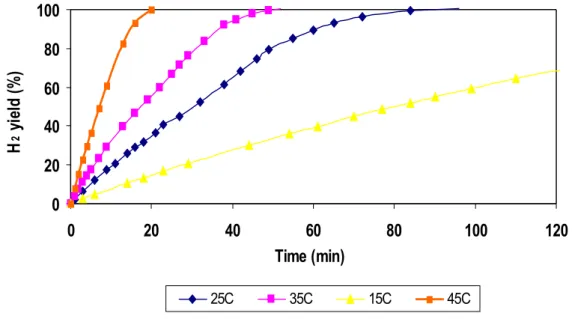
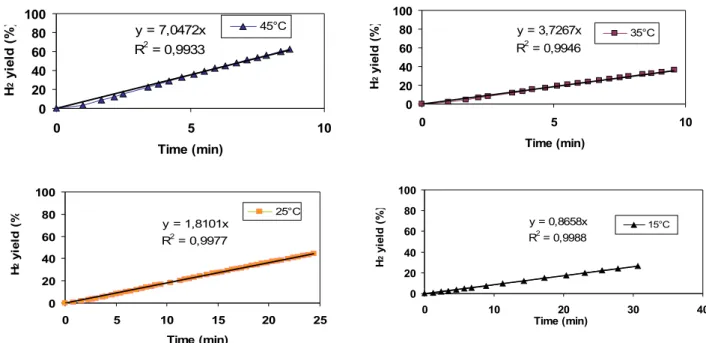
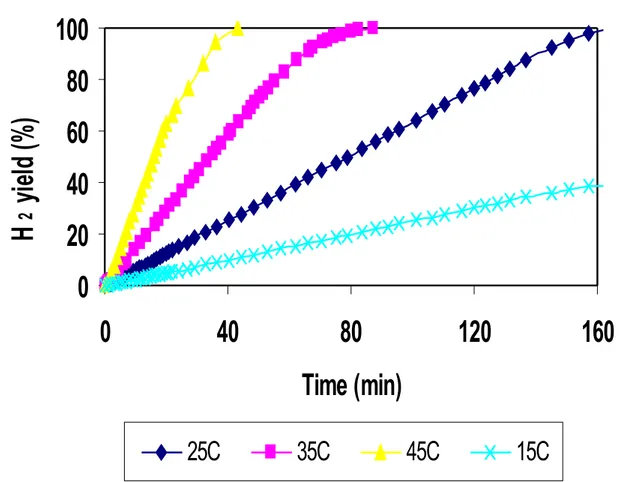
The experiments carried out at fixed temperature consent to extract the kinetic parameters depending from the type of catalyst used in the reaction of NaBH4 hydrolysis. In figure 30, it’s reported a series of experiments of NaBH4 hydrolysis, in terms of hydrogen yield as a function of time on stream, in isothermal conditions (at 15, 25, 35, 45°C) using Ru2C/D as catalyst. It’s possible to note that H2 yield versus time on stream show a good linearity in the first portion of data. So it’s possible consider that the NaBH4 hydrolysis using ruthenium supported catalysts on active carbon (DX40) is a zero order reaction respect to NaBH4
reagent. This consideration is in agreement with literature data [1,2], obtained using ruthenium catalysts supported on activated carbons, at the same conditions of temperature and NaBH4 concentration. 0 20 40 60 80 100 0 20 40 60 80 100 120 Time (min) H 2 y ie ld (% ) 25C 35C 15C 45C
Fig.30 H2 yield as a function of time on stream at four temperatures (15, 25, 35, 45°C) using Ru2C/D as catalysts.
Figure 31 represents the first portion of data reported in figure 30 for each temperature. Interpolating these data, it’s possible to obtain the kinetic constant. In fact considering that the NaBH4 hydrolysis using ruthenium supported catalysts on active carbon (DX40) is a zero order reaction respect to NaBH4 reagent, the relation of the reaction velocity is the following:
v = K
where v = the reaction velocity, K = kinetic constant. So, interpolating data with a linear interpolation for each temperature, the kinetic constant corresponds to the slope of the line.
Fig.31 First portion of data related to fig. 30. H2 yield as a function of time on stream at four temperatures (15, 25, 35, 45°C) using Ru2C/D as catalyst.
In tab.2, it’s reported for each temperature, the corresponding reaction kinetic constant for Ru2C/D catalyst.
The velocity of a chemical reaction is linked to the temperature by the Arrhenius equation: K = A e -E/RT
where K= coefficient of velocity, T= absolute temperature (in Kelvin degrees), R= gas constant (8.29J), A= frequency factor, E= activation energy.
Putting the Arrhenius equation in logarithmic form: ln K = ln A – (E/RT)
Interpolating lnK versus 1/T with a linear interpolation as reported in figure 32, it’s possible to obtain the activation energy of hydrolysis reaction, using Ru2C/D as catalyst, because the
y = 6,3345x R2 = 0,9804 0 20 40 60 80 100 0 5 10 15 20 time (min) H 2 y ie ld ( % ) 45C Ry = 2,8943x2 = 0,9853 0 20 40 60 80 100 0 5 10 15 20 25 time (min) H 2 y ie ld ( % ) 35C y = 1,7225x R2 = 0,9918 0 20 40 60 80 100 0 10 20 30 40 time (min) H 2 y ie ld (% ) 25C y = 0,6379x R2 = 0,9935 0 20 40 60 80 100 0 20 40 60 80 100 time (min) H 2 y ie ld ( % ) 15C
factor E/R corresponds to the slope of the line. So, the apparent activation energy for the hydrolysis reaction of sodium borohydride using Ru2C/D as catalyst is 54.5KJoules per mole.
y = -6556,2x + 25,836
R
2= 0,9867
0
1
2
3
4
5
6
0,0031
0,0032
0,0033
0,0034
0,0035
1/T
ln
K
Fig.32 Interpolation of ln K versus 1/T for Ru2C/D as catalyst.
The same calculations were carried out for Ru1N/D, Ru2N/D, Ru1C/D catalysts at 15, 25, 35, 45ºC and the results are resumed in the same tab. 2.
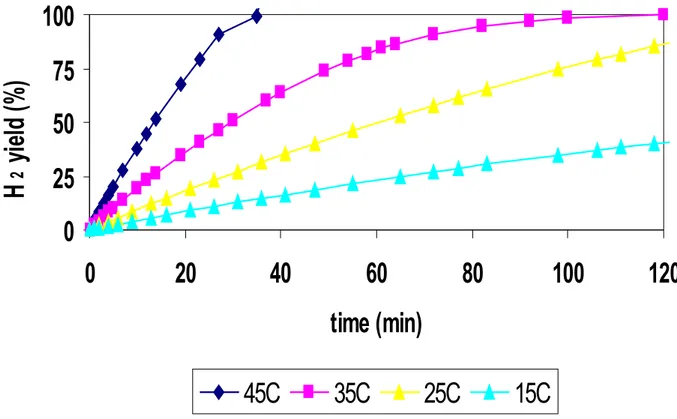
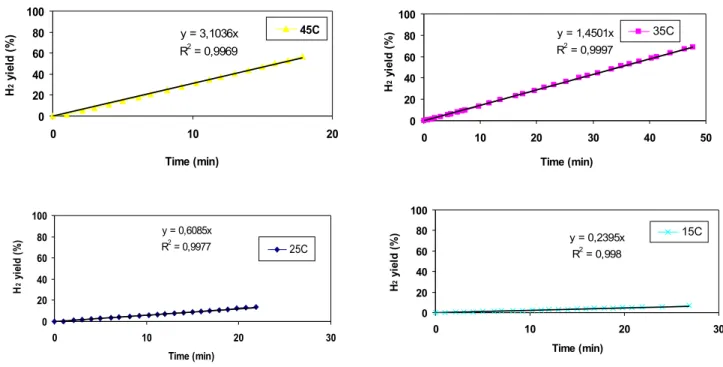
In figure 33, it’s reported a series of experiments of NaBH4 hydrolysis, using Ru1C/D as catalyst.
0
25
50
75
100
0
20
40
60
80
100
120
time (min)
H
2y
ie
ld
(%
)
45C
35C
25C
15C
Fig.33 H2 yield as a function of time on stream at four temperatures (15, 25, 35, 45°C) using Ru1C/D as catalyst.