1
UNIVERSITÀ DEGLI STUDI DI CATANIA
FACOLTÀ DI SCIENZE MATEMATICHE, FISICHE E NATURALI
Dipartimento di Scienze Chimiche
International Doctorate in Chemical Sciences
XXV CYCLE
Dr. Alessandro Rapisarda
Novel self-assembled monolayer (SAM) based on calix[n]arenes for
application as chemical sensors and optical devices: synthesis, studies
and applications.
Tutor: Prof. D.Sciotto
2
3
Index
Page
1. Introduction
11.1. The role of supramolecular chemistry in the nanosciences and nanomaterials 1
1.2. Chemical sensors 5
1.3. Calix[n]arenes 6
1.4. Calixarenes as sensors 8
1.5. SAMs as Components of Nanoscience and Nanotechnology 9 1.6. Time-of-Flight Secondary Ion Mass Spectrometry (ToF-SIMS) 15
1.7. AFM ( Atomic Force Microscopy) 21
1.8. Quartz Crystal Microbalance 24
2. Results and discussion
312.1. State of the art 31
2.2. Aim of the work 32
2.3. Synthetic strategy 33
2.4. SAM‟s formation and ToF-SIMS Characterization 39
2.5.Morphological analysis: AFM 43
2.6. Evidence of complexation in solution 47
2.7 QCM-D analysis: amino acids adsorption on BTCC-SAM 49
3. Conclusion
614. Experimental section
624.1. Instrument and chemicals 62
4.2. Synthesis and characterization 63
4.3. 1H-NMR and mass spectra 70
4.4 TOF SIMS Spectra 81
4.5 Complexation study in solution 92
4.6 QCM-D analysis 94
5. Acknowledgement
951
1. Introduction
1.1. The role of supramolecular chemistry in the nanosciences and nanomaterials
Nature has provided many examples of exquisitely specific binding interactions like enzyme-substrate, antigen-antibody and complementary DNA annealing. To achieve this specificity, biological systems exploit molecular recognition between two species that complement one another in size, shape and functionality.
In the last three decades these interactions have been widely exploited by supramolecular chemists for the design and synthesis of molecular receptors which are useful to understand and mimic nature‟s specific interactions. As for biological systems, the concepts of shape recognition and binding-site complementarity are central for effective molecular recognition in artificial host-guest systems. This selectivity mechanism is particularly useful in the development of chemical sensors, whereas the recognition process can be translated into an analytical signali.
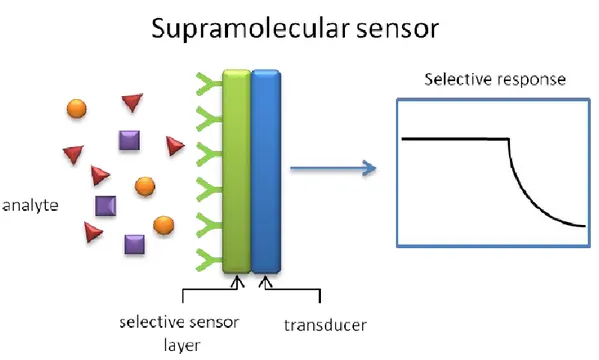
The vast majority of chemical sensors contain a chemically sensitive layer for analytes detection coupled with a transducer which transforms this interaction in a readable signal. (Figure 1.1.1).
Figure 1.1.1 Selective response from a supramolecolar sensor.
The miniaturization of components for the construction of useful devices and machines is currently pursued by the “top-down approach”. This approach, which leads physicists and engineers to manipulate progressively smaller pieces of matter by photolithography and related
2
techniques, has operated in an outstanding way up until this time. It is becoming increasingly apparent, however, that the top-down approach is subject to drastic limitations for dimensions smaller than 100 nm.ii This size is very small by the standards of everyday experience (about one thousandth of the width of a human hair), but it is very large on the scale of atoms and molecules. An alternative and most promising strategy to exploit science and technology at the nanometer scale is offered by the “bottom-up approach”, which starts from nano- or subnanoscale objects (namely, atoms or molecules) to build up nanostructures. On these basis
Nanomaterials are materials having a characteristic length scale less than about a hundred
nanometres.
The bottom-up approach is largely the real of nanoscience and nanotechnology. This is the reason why chemists, being able to manipulate atoms and molecules, are in an ideal position to contribute to the development of nanoscience and nanotechnology.3
In the bottom-up approach to miniaturization one can distinguish two different limiting cases: 1. Nanoscale “objects” characterized by a very simple chemical form (atoms, clusters of atoms,
small molecules) not exhibiting any specific intrinsic function. Nevertheless, functions arise from ensembles of such objects. An examples of this kind of construction is when atoms or very simple molecules can be used to write a word of nanoscale dimension on a surface. Figure
1.1.2 shows how the new millennium was celebrated by writing the figure “2000” on a Cu
(211) surface using 47 individually placed CO molecules.4
Figure 1.1.2. The number 2000, celebrating the new millennium, has been written by using 47 CO
single molecules. Each protrusion represents an individual CO molecule and the background vertical lines are the intrinsic Cu surface step edges.
2. Nanoscale “objects” have complex chemical composition such as the multicomponent systems. These objects show peculiar properties and perform specific functions. The so called “artificial molecular devices and machines” belong to this category.5 An example of such nanoscale
3
“objects” is the prototype of a molecular muscle6 ( Figure 1.1.3). In the late „70s the research on molecular electronic devices began to flourish7 and the idea arose8 that molecules are much more convenient building blocks than atoms to construct nanoscale devices and machines.
4
The main reasons that provide the basis of this idea are as follows: 1. molecules are stable species, whereas atoms are difficult to handle;
2. nature starts from molecules, not from atoms, to construct the great number and variety of nano-devices and nano-machines that sustain life;
3. most laboratory chemical processes deal with molecules rather than with atoms;
4. molecules are objects that already exhibit distinct shapes and exhibit device-related properties (e.g., properties that can be manipulated by photochemical and electrochemical inputs);
5. molecules can be covalently connected or can self-assemble to make larger structures. In the last context, a new branch of chemistry called supramolecular chemistry emerged and expanded very rapidly. In particular, the formation of supramolecules results from the spontaneous association of a well-defined and limited number of molecular components, under the intermolecular control of the non-covalent interactions that held them together. In the following years it became clear that supramolecular chemistry, through the application of the “bottom-up approach” opens virtually unlimited possibilities regarding the design of nanomaterials.
Supramolecular Chemistry is defined as “the chemistry beyond the molecule, bearing on the organized entities of higher complexity, that result from the association of two or more chemical species held together by intermolecular forces”.9 As an example, it allows the construction of artificial molecular devices and machines capable of performing specific functions upon stimulation with external energy inputs.10 The “bottom-up approach” can also provide contributions to give a better understanding of the molecular-level aspects of the extremely complicated devices and machines that are responsible for biological processes.11
5
1.2. Chemical sensors
Chemical sensors have become an ideal tool for performing real-time monitoring of both chemical and biochemical species. A chemical sensor incorporates the usage of various technologies from synthetic chemistry to surface analysis technologies.
Research in the area of sensor development for metal ion detection in chemical and biological applications has received considerable attention in recent year.12 Chemical sensor arrays have found a widespread use for biological and chemical recognition in a growing number of applications. They include: drug discovery and life sciences research; food analysis; fragrance and flavour analysis; chemical industry; medical diagnostics (e.g. detection of diseases in breath analysis); agriculture; environmental monitoring; security devices; detection of hazardous and explosive substances; study of chemical reactions or host-guest interactions on surfaces; criminalistics; etc. Typical advantages of chemical sensors in comparison with conventional spectroscopy methods are: faster responses, portability, much lower prices.
6
1.3. Calix[n]arenes
Among the several classes of synthetic macrocyclic compounds currently used as receptors (hosts) in supramolecular chemistry, calix[n]arenes have assumed a key role due to their synthetic accessibility and versatility.13
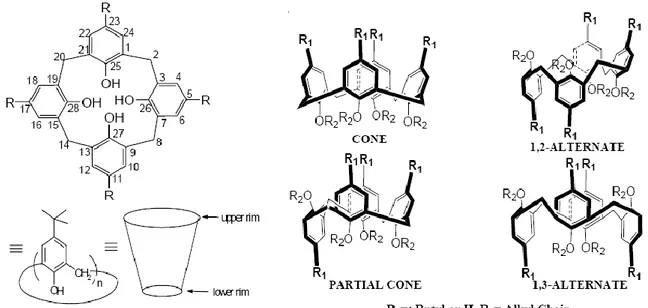
Calix[n]arenes14 (n=4-20) are phenolic [1]n-metacyclophanes which can be conveniently obtained through acid or base-catalysed condensation of p-substituted phenols and formaldehyde. They possess a distinct hydrophobic upper (or “wide”) rim and a hydrophilic lower (or “narrow”) rim to encompass a hollow cavity with dimensions that can be varied by varying the number (n) of the phenolic units present.
The observed diversity of calix[n]arenes essentially lies in their conformational isomerism due to restricted rotation of the Ar-CH2-Ar bonds, or complete molecular rotation through the
annulus. The molecular rotation through the annulus in case of a calix[4]arene is suppressed if the narrow-rim alkoxy groups are large enough to restrict this flipping motion. Though initial efforts were unsuccessful, increasingly refined synthetic methodologies have enabled the development of procedures for obtaining cone, partial-cone, 1,3-alternate and 1,2-alternate conformations of calix[4]arene derivatives (Fig 1.3.1), which can provide differential capabilities for ionic and molecular recognition.
7
Moreover, the chemistry of these macrocycles is nowadays well known and efficient procedures are available to easily functionalise both the lower (phenolic OH groups) and the upper (aromatic ring) rim (Fig. 5) with most of the functional groups (–CHO, –COOH, –NH2, –
NCS, –C≡CH…etc.) usually employed for the conjugation of legating units.15
The insertion of new functional groups onto both the “rims” of the macrocycles can be easily accomplished using common reactions typical of the organic chemistry. Such functionalization reactions allow, as an example, either the insertions of binding sites or the extension of the hosts aromatic cavity. For these reasons, calix[n]arenes can be considered as useful building block for the synthesis of new advanced receptors and will be used in this project as sensor agent bound to a gold surface.
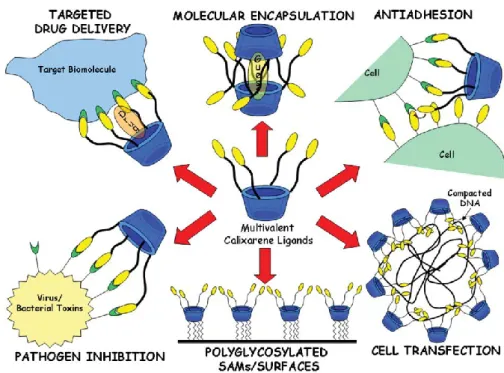
This circumstance has also given a biological perspective to the research in the field of calixarenes and illustrate the potential of this approach in the rapidly growing field of Bionanotechnology (Fig. 1.3.2), whose aim is to develop new tools for biology, new biomaterials, selective sensors and supramolecular devices for clinical analysis, new therapeutics and smart drug delivery systems.
8
1.4 Calixarenes as sensors
It has been recently shown that alkylthiolated calix[4]arene derivatives can be successfully bound to gold surfaces and employed as multivalent hosts for the recognition of organic salts and amino acids both in organic and aqueous media.16
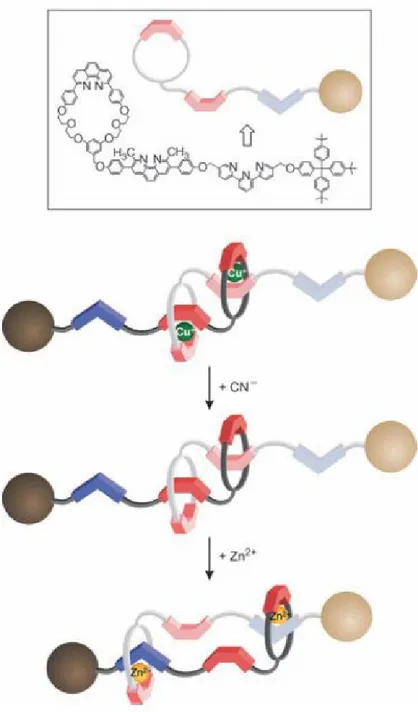
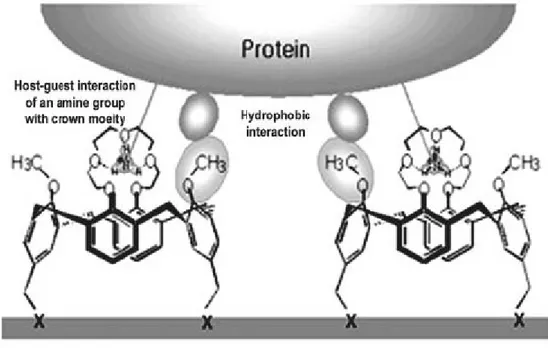
ProLinkerTM is a well-known calixarene derivative protein linker that has been utilized for guanidinium, antibody, enzyme and membrane receptor‟s immobilization.17
Figure 1.4.1. A proposed mechanism of protein binding to Calixcrown molecular linkers.
ProLinkerTM has a unique surface chemistry, which forms a self-assembled monolayer (SAM) on the gold surface and allows tight binding of capture proteins to the crown moiety of the linker molecules. The major binding force could be attributed to the ionized amine groups of capture proteins, which bind to the crown moiety of the linker molecule via host-guest interactions. Also, hydrophobic interactions between hydrophobic residues of a protein and methoxy groups of the calix[4]crown ether molecule may also be involved in protein immobilization. It preserves the random orientation of capture proteins, keeps the native composition of proteins and improves the accessibility for interaction proteins. The directional immobilization of proteins on a solid surface is one of the most powerful advantages of the Calixcrown molecular linker.18
9
1.5 SAMs as Components of Nanoscience and Nanotechnology
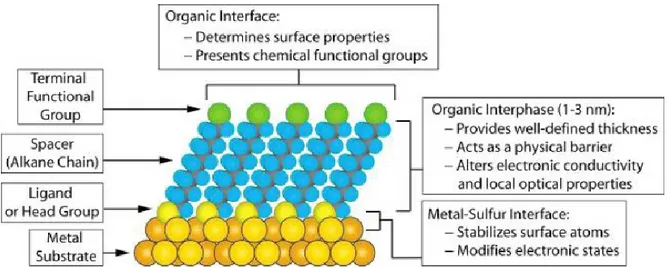
Self-Assembled Monolayer (SAM) could be considered nanostructures with a number of useful properties (Figure 1.5.1). For example, the thickness of a SAM is typically 1-3 nm; they are the most elementary form of a nanometer-scale organic thin-film material. The composition of the molecular components of the SAM determines the atomic composition of the SAM perpendicular to the surface; this characteristic makes it possible to use organic synthesis to tailor organic and organometallic structures at the surface with positional control approaching 0.1 nm.
SAMs are well-suited for studies in nanoscience and technology because (1) they are easy to prepare, that is, they do not require ultrahigh vacuum (UHV) or other specialized equipment (e.g., Langmuir- blodgett (LB) troughs) in their preparation, (2) they form on objects of all sizes and are critical components for stabilizing and adding function to preformed, nanometer-scale objectssfor example, thin films, nanowires, colloids, and other nanostructures, (3) they can couple the external environment to the electronic (current-voltage responses, electrochemistry) and optical (local refractive index, surfaceplasmon frequency) properties of metallic structures, and (4) they link molecular-level structures to macroscopic interfacial phenomena, such as wetting, adhesion, and friction.
Figure 1.5.1. Schematic diagram of an ideal, single-crystalline SAM of alkanethiolates supported on a
10
Preparation of SAMs
The early literature on SAMs (1983-1993) focused largely on the assemblies formed by the adsorption of organosulfur compounds from solution or the vapour phase onto planar metal substrates of gold and silver.19,20,21 These studies used three types of organosulfur compounds: alkanethiols , dialkyl disulfides , and dialkyl sulfides. The experiments established many of the basic structural characteristics of these systems (surface structure, chain organization, orientation), practical protocols for preparing SAMs (concentrations, length of time for immersion, solvents, temperature), and some details of the thermodynamics and kinetics governing the process of assembly. Comprehensive reviews of the early work are available.22,23,24 A major portion of the research on SAMs since the early 1990s has continued to expand the types of substrates used to support SAMs, and, to some degree, the types of molecules used to form them. The availability of new types of nanostructures with well-defined shapes and sizes on planar supports (metal structures on silicon wafers or glass slides) and in solution (nanocrystals, template structures) has stimulated wide application of SAMs for stabilizing these new structures of metallic (and other) nanoscale materials and manipulating the interfacial/surface properties of these materials. This section of the review describes some of the types of substrates most widely used for supporting SAMs and reviews what is known about the methods for preparing SAMs from different organosulfur compounds in solution and from the vapor phase.
Protocols for Preparing SAMs from Organosulfur Precursors
SAMs of organosulfur compounds (thiols, disulfides, sulfides) form on substrates by spontaneous adsorption from either the liquid or the vapor phase. Assembly from solution on the laboratory bench is convenient and sufficient for most applications of SAMs, especially for those requiring contact with other liquid phases in subsequent experiments (for example, supports for cell culture, wetting studies).
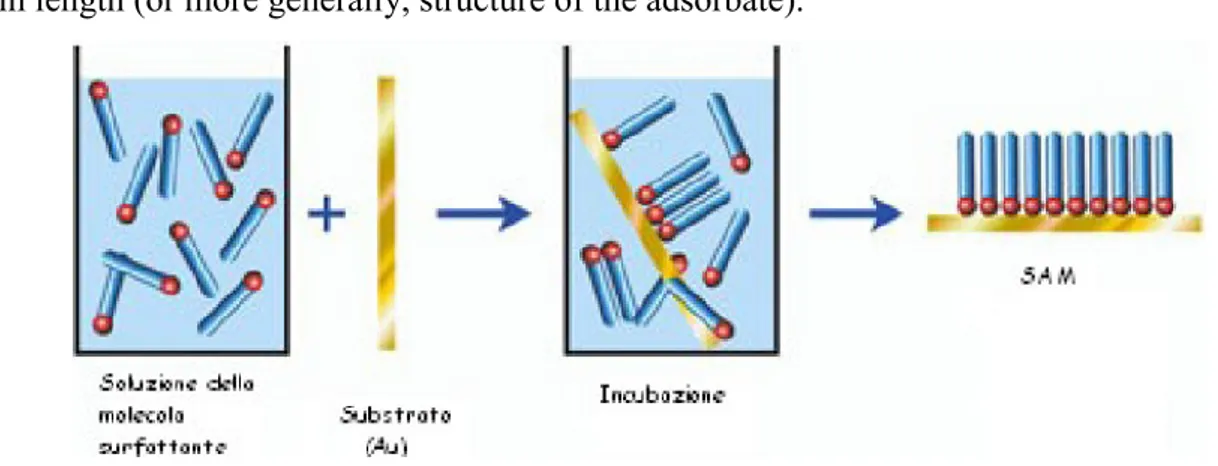
The most common protocol for preparing SAMs on gold, silver, palladium, mercury, and other materials is immersion of a freshly prepared or clean substrate into a dilute (10-1 mM) ethanolic solution of thiols for 12-18 h at room temperature (Fig.1.5.2). This procedure is widely used and originates from early studies of SAMs; the experimental details resulted from a combination of studies designed to optimize the reproducibility of the SAMs produced and convenience. Dense coverages of adsorbates are obtained quickly from millimolar solutions (milliseconds to minutes), but a slow reorganization process requires times on the order of hours to maximize the density of molecules and minimize the defects in the SAM. There are, however, a number of experimental factors that can affect the structure of the resulting SAM
11
and the rate of formation: solvent, temperature, concentration of adsorbate, immersion time, purity of the adsorbate, concentration of oxygen in solution, cleanliness of the substrate, and chain length (or more generally, structure of the adsorbate).
Fig.1.5.2 Schematic procedure for the preparation of SAM
In practice, most experimental conditions for the preparation of SAMs yield organic interfaces with reproducible and desired functional behaviors. These characteristics are acceptable for some applications of SAMs, but fundamental studies of certain materials properties such as wettability, corrosion, tribology, and charge-transfer processes (among others) require an understanding of how to minimize defects in SAMs and maximize order in these systems. The effects that some parameters, such as immersion time, concentration of adsorbate, and chain length, have on the structure and properties of SAMs are known to a small degree, but less is known about others (choice of solvent, temperature).
Fig. 1.5.3 Interaction during the SAM formation
Solvents. Ethanol is the solvent that is most widely used for preparing SAMs. The limiting
12
solvents other than ethanol (tetrahydrofuran, dimethylformamide, acetonitrile, cyclooctane, toluene) do not vary significantly from those formed from ethanolic solutions.25 At least four other factors also contributed to the widespread use of ethanol: it solvates a variety of alkanethiols with varying degrees of polar character and chain length; it is inexpensive; it is available in high purity; and it has low toxicity.
The effects of the choice of a solvent on the kinetics of formation and the mechanism of assembly are complex and poorly understood. Studies on this topic have led to some qualitative understanding of how solvent can affect the assembly process. The presence of a solvent adds additional parameters to the dynamic equilibrium governing the adsorption of thiols: solvent-substrate and solvent-adsorbate interactions complicate the thermodynamics and kinetics of assembly. Solvent-substrate interactions can hinder the rate of adsorption of thiols from solution because the solvent molecules must be displaced from the surface prior to the adsorption of thiols, which are less prevalent in solution than the solvating molecules.
Studies suggest that the rate of formation of SAMs of alkanethiolates is faster in certain nonpolar solvents (heptane, hexanes) than ethanol.26,27 The use of long hydrocarbons, such as dodecane and hexadecane, as solvents reduces the rates of formation such that they are comparable to those for forming SAMs from ethanolic solutions. Hydrocarbon solvents may improve the kinetics of formation in some cases, but the strong solvent-adsorbate interactions in these solutions impede the organization of SAMs formed from alkanethiols. Contact angle measurements and electrochemistry suggest that SAMs formed from solutions of thiols in nonpolar organic solvents are less organized than SAMs formed in ethanol.Polar liquids-poor solvents for n-alkanethiols seem to reduce the quantity of some types of defects found in SAMs and promote densely packed monolayers.28,29,30 The low solubility of thiols in such solvents and the low segmental heats of adsorption for these solvents (that is, the heat associated with each additional interaction of the solvent molecules with the surface, for example, the heat of adsorption per methylene or alcohol group) probably serve to segregate the thiols at the metal surface and thus more efficiently drive the assembly processes involving them.
Taken together, the studies of the effects of solvent on the prototypical example of SAMs of alkanethiolates on gold indicate that the choice of solvent clearly is an important parameter for determining the resulting quality of a SAM deposited from solution, but there remains significant challenges in developing a detailed understanding of the complex and dynamic interactions that occur between the solvent, surface, and adsorbates during the formation process.
13
Temperature. Forming SAMs at temperatures above 25 °C can improve the kinetics of
formation and reduce the number of defects in them.3132 Elevated temperatures increase the rate of desorption for adventitious materials and solvent molecules physisorbed on the surface of the substrate and make it possible for the system to cross activation barriers for processes such as chain reorganization and lateral rearrangements of the adsorbates more easily than at room temperature. Uosaki and co-workers suggest that the effect of temperature is particularly relevant during the first few minutes of the formation of a SAM when most of the adsorption and reorganization of the SAM is taking place.33
Concentration and Immersion Time. These two parameters are inversely related: low
concentrations of thiols in solution require long immersion times.34 For SAMs formed from alkanethiols on gold, the typical surface density of molecules (when maximum coverage is obtained) is ~ 4.5•1014 molecules/cm2; thus, the minimum concentration for forming a dense SAM is ~1 µM, or ~ 6 •1014 molecules/cm3. In practice, SAMs formed by immersion for a week in solutions with concentrations at or below 1 µM do not exhibit the same physical properties as those formed from more concentrated solutions. The amount of impurities or other sulfurcontaining compounds also can complicate the use of extremely dilute solutions to form SAMs. Most spectroscopic and experimental evidence suggests that the average properties of SAMs formed from n-alkanethiols do not change significantly when exposed to ~1 mM solutions of thiols for more than 12-18 h. These results imply that the coverage of the surface increases with extended immersion times and suggest that there are two consequences: (1) the number of pinhole defects in the SAMs decreases and (2) the conformational defects in the alkane chains decrease. The typical time allowed for formation (12-18 h) is convenient experimentally, but for some applications, formation over many days can improve the reproducibility of subsequent experiments that use the SAM, for example, studies of electron transfer through SAMs.35
Purity of Thiols. Common impurities derived from thiols are disulfides-an oxidation product.
Experiments suggest that trace amounts of these materials (<5%) do not necessarily impede the formation or alter the structure of the SAM. The disulfides usually are, however, less soluble than their thiol precursors; the reduced solubility can result in physisorption of these materials and alteration of the physical properties of the SAM. Oxidized, polar contaminants (sulfonates, etc.) can be removed by percolating the thiols over activated, neutral alumina prior to use.
Oxygen Content of Solution. There is little, if any, quantitative knowledge about the effects
that oxygen can have on the rate of formation and the structure of SAMs formed when it is present in solution. Empirical evidence suggests that degassing the solvent with an inert gas,
14
such as argon, prior to preparing the solution of thiols and maintaining an inert atmosphere over the solution during formation improve the reproducibility of the materials properties of the SAMs.36 Reducing the concentration of oxygen in the solution limits the oxidation of the thiols to sulfonates and other oxygenated species.
This precaution is more important for SAMs prepared on palladium, silver, copper, and (perhaps) platinum than on gold; the sulfur moieties in SAMs on palladium, silver, and copper undergo oxidation within 1-7 days upon exposure to the ambient atmosphere.37
Cleanliness of Substrate. The formation of SAMs on substrates that are handled in a
laboratory atmosphere is essentially an exchange process: the thiols must displace whatever adventitious materials adsorb onto the substrate prior to immersion in a solution of thiols. The assumption supporting this statement is that the thiols are, in fact, able to displace the miscellaneous adsorbates already present. Displacement with thiols first requires desorption of the contaminants and impurities; the rate of desorption of the contaminants must, therefore, affect the kinetics of formation. SAMs have reproducible materials properties when formed on substrates that are immersed into solutions of thiols within ~1 h of preparation or cleaned with strongly oxidizing chemicals (“piranha” solution-H2SO4:H2O2) or oxygen plasmas. Exposure to
ambient conditions for prolonged times seems to allow adsorption of materials that are not easily displaced in the typical time allowed for the formation of SAMs.
15
1.6 Time-of-Flight Secondary Ion Mass Spectrometry (ToF-SIMS)
Time-of-Flight Secondary Ion Mass Spectrometry (ToF-SIMS) is a surface-sensitive analytical method that uses a pulsed ion beam (Cs or microfocused Ga) to remove molecules from the very outermost surface of the sample. The particles are removed from atomic monolayers on the surface (secondary ions). These particles are then accelerated into a "flight tube" and their mass is determined by measuring the exact time at which they reach the detector (i.e. time-of-flight). Three operational modes are available using ToF-SIMS: surface spectroscopy, surface imaging and depth profiling. Analytical capabilities of ToF-SIMS include:
Mass resolution of 0.01x amu. Particles with the same nominal mass (e.g. Si and C2H4, both
with amu = 28 ) are easily distinguished from one another because as Mr. Einstein predicted there is a slight mass shift as atoms enter a bound state.
Mass range of 0-10,000 amu; ions (positive or negative), isotopes, and molecular compounds (including polymers, organic compounds, and up to ~amino acids) can be detected.
Trace element detection limits in the ppm range.
Sub-micron imaging to map any mass number of interest.
Depth profiling capabilities; sequential sputtering of surfaces allow analysis of the chemical stratigraphy on material surfaces (typical sputtering rates are ~100 A/minute).
Retrospective analysis. Every pixel of a ToF-SIMS map represents a full mass spectrum. This allows an analyst to retrospectively produce maps for any mass of interest, and to interrogate regions of interest (ROI) for their chemical composition via computer processing after the dataset has been instrumentally acquired.
16
Fundamental Principles of Time-of-Flight Secondary Ion Mass Spectrometry (ToF-SIMS)
Fig.1.6.1 Schematic representation of secondary ion generation.
ToF-SIMS uses a focused, pulsed particle beam (typically Cs or Ga) to dislodge chemical species on a materials surface. Particles produced closer to the site of impact tend to be dissociated ions (positive or negative). Secondary particles generated farther from the impact site tend to be molecular compounds, typically fragments of much larger organic macromolecules. The particles are then accelerated into a flight path on their way towards a detector. Because it is possible to measure the "time-of-flight" of the particles from the time of impact to detector on a scale of nano-seconds, it is possible to produce a mass resolution as fine as 0.01X atomic mass units (i.e. one part in a thousand of the mass of a proton). Under typical operating conditions, the results of ToF-SIMS analysis include:
1. a mass spectrum that surveys all atomic masses over a range of 0-10,000 amu, 2. the rastered beam produces maps of any mass of interest on a sub-micron scale, and 3. depth profiles are produced by removal of surface layers by sputtering under the ion beam.
ToF-SIMS is also referred to as "static" SIMS because a low primary ion current is used to "tickle" the sample surface to liberate ions, molecules and molecular clusters for analysis. In contrast, "dynamic" SIMS is the method of choice for quantitative analysis because a higher primary ion current results in a faster sputtering rate and produces a much higher ion yield (Fig.
1.6.1). Thus, dynamic SIMS creates better counting statistics for trace elements. Organic
compounds are effectively destroyed by "dynamic" SIMS, and no diagnostic information is obtained.
17
Time-of-Flight Secondary Ion Mass Spectrometry (ToF-SIMS) Instrumentation - How Does It Work?
Fig.1.6.2 Schematic diagram of the Charles Evans TRIFT ToF-SIMS instrument.
ToF-SIMS instruments typically include the following components (Fig.1.6.2):
An ultrahigh vacuum system, which is needed to increase the mean free path of ions liberated in the flight path;
A particle gun, that typically uses a Ga or Cs source;
The flight path, which is either circular in design, using electrostatic analyzers to direct the particle beam (see Charles Evans TRIFT design), or linear using a reflecting mirror (see the "reflectron" design of Cameca's IonTOF system); and
The mass detector system.
Fig.1.6.3 Schematic diagram of the ToF-SIMS instrument.
18
ToF-SIMS (Fig. 1.6.3) instruments are also equipped with a powerful computer and software for system control and analysis. One of the key features of the ToF-SIMS software is the ability to perform "retrospective" analysis, that is, every molecule from the sample detected by the system can be stored by the computer as a function of the mass and its point of origin. This allows the user to obtain chemical maps or spectra of specific regions not previously defined after the original data has been collected.
Applications
ToF-SIMS is widely used in material science disciplines in studies of materials such as polymers, pharmaceuticals, semi-conductors. The three main modes of data acquisition include: Elemental/Molecular Surveys;
Elemental/Molecular Maps; and Depth Profiles.
In principle, ToF-SIMS is applicable to any surface-mediated reaction such as: catalysis, sorption, redox, and dissolution/precipation reactions. Only recently has ToF-SIMS been applied to geologic materials. Some examples include:
Organic Films on mineral grain boundaries
Identification of organic biomarkers in the rock record Characterization of organic macromolecures in coal deposits
Analysis of metals precipitated from magmatic fluids in seafloor hydrothermal systems Analysis of interplanetary dust particles
19
Strengths and Limitations of Time-of-Flight Secondary Ion Mass Spectrometry
Strengths
Surveys of all masses on material surfaces; these may include single ions (positive or negative), individual isotopes, and molecular compounds;
Elemental and chemical mapping on a sub-micron scale;
High mass resolution, to distinguish species of similar nominal mass (mass resolution is at least 0.01x amu);
High sensitivity for trace elements or compounds, on the order of ppm to ppb for most species; Surface analysis of insulating and conducting samples;
Depth profiling (in the near surface environment, on the order of individual atomic layers to 10s of nanometers);
Non-destructive analysis;
Retrospective analysis, for post-data acquisition analysis and interpretation of stored images and spectra.
Limitations
Generally does not produce quantitative analyses (semi-quantitative at best);
Optical capabilities are typically limited, making it difficult to find grains or specific regions of interest for analysis;
Charging may be a problem in some samples, although charge compensation routines are generally sufficient to overcome these problems;
There is commonly an image shift when changing from positive to negative ion data collection mode; this makes it difficult to collect positive and negative ion data on exactly the same spot; and
Too much data; the benefit of retrospective analysis is also its curse. Every pixel of an image produced by ToF-SIMS also contains a full mass spectrum for that point. Thus, it may take hours, days or weeks to fully analyze a single data set. Consequently, it is extremely important to have a very clear purpose in collecting ToF-SIMS data, and focus on analyzing and interpreting the data that are specifically related to the question at hand.
20
Sample Collection and Preparation
ToF-SIMS is extremely sensitive to any sample preparation treatments: there is typically a residue related to any pre-treatment of the sample, and there is always "adventitious" (or environmental) contamination in the form of compounds sorbed onto material surfaces from the atmosphere.
In general, we try to analyze samples "as received." Solid materials (e.g. mineral grains) are typically pressed into an Indium foil, which is both malleable and conducting. Any mapping of the sample prior to insertion into the sample chamber will greatly increase the ability to find and identify areas of interest. As a first step in the analytical procedure, we will typically "dust off" the surface with a very light (<1 minute) sputtering interval in an attempt to clean off any sorbed surface contamination.
21
1.7 AFM (Atomic Force Microscope)
Principles
The Atomic Force Microscope (AFM) is one type of scanning probe microscopes, which is used to image surface structures on a nm or even sub-nm level and to measure surface forces.
The standard AFM contains a microscopic tip (curvature radius of ~10-50nm) attached to a cantilever spring (Fig.1.7.1).
The underlying principle of AFM is the detection of the bending of this cantilever spring as a response to external forces. In the case of adhesive interaction between the tip and a surface, this forces are of the order 0.1 - 1 nN. To measure such small forces one must use not only very sensitive force-measuring springs but also very sensitive ways for measuring their bending.
In order to detect this bending, which is as small as 0.01 nm, a laser beam is focused on the back of the cantilever. From there the laser beam is reflected towards a position-sensitive photodetector. Depending on the cantilever deflection the position of the reflected beam changes. The photodetector converts this change in an electrical signal.
22
Direct Force Measurement
A way to get information on the surface forces wich are acting in a given system and to illustrate the functioning of an AFM, is to use the Force Mode. This is done by moving the tip towards and away from the surface. Recording photodetector signal as a function of z-piezo elongation yields a curve which can be interpreted as a force-vs.-distance-curve. (Fig.1.7.2).
Fig.1.7.2 Photodetector signal as a function of z-piezo elongation yields a curve which can be
interpreted as a force-vs.-distance-curve.
Assuming that the tip-surface interaction can be described by a Lennard-Jones-Potential one can observe a cycle as follows: (0) the tip is far away from the surface, and surface forces do not act. As the tip approaches (1) to (2), it enters the range of attractive surface forces and is deflected downwards. (2) to (4): the tip is in contact with the surface and now exerts pressure while it is deflected upwards. At (4) the tip retraction started, but adhesion forces may keep the tip attached to the surface until the spring force exerted by the cantilever can overcome adhesion (5). Then the tip snaps back into its initial position and the cycle can start again (6). Force curves convey valuable information on the nature and strength of surface forces.
23
Surface Imaging
To acquire a surface image the AFM tip is brought down to the surface. A piezo element is used to scan the tip line by line across the sample.
The simplest measurement method, the Contact Mode, is to this scan while the end of the tip is in mechanical contact with the sample. An electronic feedback control keeps the resulting deflection constant by adjusting the z position, thus the force is measured.
The contact mode has a disadvantage: the tip exert forces to the sample. Altough these forces are only of the order of 0.1 - 1 nN, the pressure applied to the sample can easily reach 1000 bar because the contact area is so small. This may lead to structure damages, especially on soft surfaces.
For this kind of samples the so called Tapping Mode is used in general. In this mode the cantilever tip is stimulated to vibrations near the resonance frequency (~300kHz). On approach to the surface, the vibration amplitude of the cantilever will decrease, since the interaction force with the surface shifts the resonance frequency. Instead of scanning the sample at constant deflection, the surface is scanned at constant reduction of the oscillation amplitude. As a result the tip is not in mechanical contact with the surface during the scan. The tapping mode is less destructive then the contact mode, because the exerted forces are in the pN range.
24
1.8 Quartz Crystal Microbalance
Piezoelectricity in Quartz Crystals
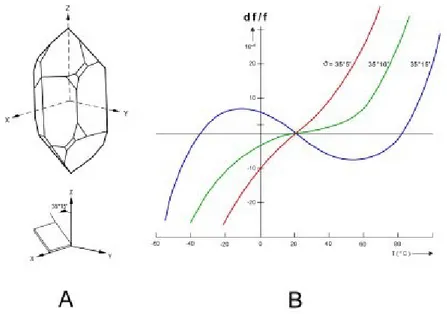
Upon application of an electric potential, certain crystals will deform physically, and vice versa; this property is known as piezoelectricity. Since mechanical stress cannot separate electrical charges, piezoelectricity is caused by the physical or electric-field induced alteration of pre-existing permanent dipole moments, arranged without a center of symmetry in a crystalline unit cell.38 Out of the 32 crystal classes, based on symmetry arguments alone 20 are potentially piezoelectric, but the magnitude of the piezoelectric response in a given crystal depends on specific details.39 The mechanical strain and applied field can be related by the matrix equation x=d*E, where d is the piezoelectric strain coefficient matrix. In quartz, five of the 18 elements of the d matrix are zero, and only two are independent.40 The main utilities of piezoelectricity are (1) the coupling of an electrical signal with the mechanical world, which has significant applications in sensing and actuation; and (2) the fabrication of high-fidelity oscillators and frequency standards. Quartz is the most commonly used crystal used in both applications, due to its strong piezoelectric response, abundance, processability, and anisotropy41. The last is important in that different cuts of quartz have different responses to temperature and stress. Elastic constants too have temperature dependence. By using this to advantage, quartz can be cut in such a way as to have very low frequency shift as a function of temperature near room temperature; these are "temperature compensated" crystals (Fig.1.8.1).
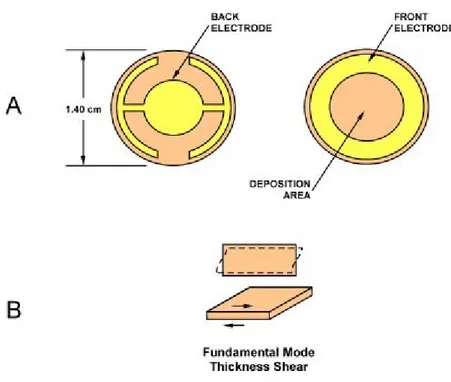
Fig. 1.8.1 : A) Illustration of AT-cut quartz crystal. B) Frequency shift as a function of temperature for
25
Due to charge leakage, application of a steady force produces only a transient voltage which can be as high as 20kV.42 Thus piezoelectricity is essentially always used subject to an AC field, with the added advantage that frequency is currently one of the most precisely measurable quantities. The oscillations induced under application of AC field can either be bulk modes or surface acoustic (Rayleigh) waves, depending on the application and on the desired frequency43.
Thickness-Shear Mode for the Quartz Crystal Microbalance
Bulk acoustic wave resonators cover the frequency range of about 1 kHz to 500 MHz depending on cut and vibration mode. The most commonly used especially in mass sensing applications is an AT-cut crystal in a rectangular or circular plate with electrodes of similar geometry, vibrating in a thickness-shear mode, which has the added benefit of limiting energy loss to a fluid medium (Fig. 1.8.2).44 This mode is, in an idealized picture, approximately equivalent to a transverse wave traveling in the thickness direction of the plate. In the case of a rectangular plate the equation of motion is therefore
where the displacement ψ is perpendicular to the direction of propagation and vq is the wave velocity which depends on the density and applicable elastic constants. Assuming that the plate is not clamped, the center of the plate is a node, and this provides the necessary boundary conditions for a solution
where n, m, and p are odd counting indices and tq, lq, and wq are the thickness, length and with of the plate. The frequencies are
.
These are just standing waves in the x, y, and z directions. If lq and wq are very large compared with the thickness
26
.
In the limit of large radius to thickness ratio this same result is obtained in the case of the circular plate, and coupling with contour modes at the plate edges can be neglected. At a typical drive current at this resonant frequency, the maximum displacement is on the order of a few atomic spacings.26
Mass Sensing Using a Quartz Crystal Microbalance
One very common use of the quartz crystal resonator described above is as a mass sensor, often in determination of thin-layer thickness or in gas sorption studies.27 It can also be used as a chemical sensor if the surface of the microbalance is pre-covered in a chemically sensitive layer.
An explicit quantitative relationship between shift of resonant frequency and added mass, is important to ease of use in a quartz crystal microbalance (QCM). This relation was first derived by Sauerbrey in 1959.45 As mentioned earlier, the fundamental resonant frequency of the quartz
Fig. 1.8.2: A) Schematic of typical quartz crystal microbalance. 33 B) Illustration of transverse shear mode of oscillation.26
27
crystal bulk thickness-shear mode is vq/2tq. Differentiating this to obtain the resonant frequency shift caused by an infinitesimally small change of crystal thickness gives
. The relative change of frequency is therefore
where Mq refers to the crystal mass and dMq the incremental change in mass of the quartz crystal. If the approximation is made that the increment of foreign mass dMf is approximately equal to dMq, then the relative change of resonant frequency upon film deposition is
.
fc is the resonant frequency of the combined quartz plus foreign layer. This can be rewritten per unit area by dividing the numerator and denominator on the right by area. Letting m refer to the mass per unit area, and assuming both the quartz and the foreign layer have uniform densities ρq and ρ f respectively, we have
.
This is the required relation between the foreign added mass and the change in resonant frequency. It is typical to define a crystal calibration constant Cf that is
.
In practicality other factors like damping in the electrical circuit, mechanical clamping, and temperature do affect the accuracy of the above approximation, and it is therefore most common to use calibration curves for routine quantitative work. Nevertheless the QCM is a very sensitive and stable sensor. In a typical example, the density is 2650 kg m-3 and the shear
28
velocity (AT-cut) is 3340 m s-1. With a resonant frequency at 5 MHz, the crystal calibration constant is 5.65 MHz cm2 kg-1 which implies that a 17.7 ng cm-2 added weight is sufficient to shift the resonant frequency by an easily-detectable 1Hz. The dynamic range of the QCM extends to about 20 μg/cm2 but the Sauerbrey equation is not accurate in the high-mass-density regime.
Fig. 1.8.3: A) Simplified oscillating driving circuit schematic for a quartz crystal. B) Circuit equivalent
29
Circuitry and Accuracy
As a damped, driven harmonic oscillator, the QCM can be modeled as an electrical circuit, as indicated in Fig. 1.8.3. Mechanical elasticity is modeled by motional capacitance C, vibrating mass by electrical inductance L, and energy loss by electrical resistance R.47 In this model an increase in system mass will be observed as an increase in the value of L, C, and mechanical load RM, and hence a decrease in the resonant frequency. However, an explicit quantitatively correct value for the frequency shift as a function of absolute added mass is not easy to obtain using a circuit equivalent and so the relation obtained in the previous section is still important. In a practical example, the value of C in a typical 5MHz AT-cut quartz crystal is on the order of 0.01 pF, L is on the order of 0.1H, and R is on the order of 10 ohms. Collectively this set of values would be very difficult to obtain using inductors and capacitors. Equivalently the Q-factor of a quartz crystal unit is on the order of 104-10, compared with typical values of several hundred for ωL/R in an equivalent electrical circuit. The maximum attainable Q*f (f in MHz) is approximately 16 million although for microbalance applications the less controlled packaging makes this somewhat lower.
The resonant frequency of the quartz crystal resonator in equivalent circuit terms is
where C* is simply C when a capacitive load is connected in series with the unit (fs), but C0C/(C0+C) when the capacitive load is connected in parallel (fp). The quartz crystal is typically driven in a oscillator circuit, in which the crystal is part of a positive feedback loop requiring a total phase shift of n2π around the loop for stable oscillation. Often parallel capacitances are compensated in such circuits and the crystal is driven as nearly as possible to its series resonant frequency.
For the QCM, typically users are concerned with measuring mass changes, and thus frequency shifts, that take place on the order of minutes to hours, as in those that result from thin film deposition or chemical reaction. Thus many of the causes of long-term frequency drift in quartz crystal resonators (surface or electrode reaction or deterioration, mechanical stress due to mount and electrodes, radiation-induced defects, etc.) which are important in the use of quartz crystals as frequency standards, are of less concern in these applications. Environmental effects such as changes in frequency with drive amplitude or with orientation relative to the Earth's gravitational field are also of limited concern, since they can be typically held constant for a
30
single QCM experiment. However, temperature fluctuations could cause thermal frequency shifts to become problematic, especially if the experiment is not being done near room temperature.
The most usual inaccuracies for microbalance applications are caused by limitations in the validity of the approximate linear relationship between mass and frequency shift. Sauerbrey's relation breaks down as mf << mq ceases to be valid. For larger mass densities more complex expressions relating the added mass to the resonant frequency have been derived using a model of a composite (two-layer) resonator, but these too make approximations48 . Also while Sauerbrey's relation is generally valid for mass measurements in fluids, the fluid represents an additional dissipative load, through coupling of the elastic shear wave to the fluid. The magnitude of this coupling depends significantly on interface chemistry; it can be greatly impacted by even monolayers of added foreign mass. The resulting frequency shift is not related to the magnitude of the added mass and often precludes QCM techniques entirely.
31
2. Results and discussion
2.1. State of the art
It is well-known that calixarenes are used for the molecular recognition of ions, amino acids, hormones, sugars, peptides, nucleic acids, and proteins, which are fundamental substrates in biological and artificial processes.49,50 A majority of the studies on calixarenes have focused on the calix[4]arenes, primarily because they can be easily derivatized in order to obtain open and rigid structures that are desirable for molecular recognition.51,52 Arena et al. examined the complexation of a number of amino acids with soluble calix[4]arenes derivatized with carboxylic acids and sulfate esters.53 At the same time, 18-crown-6 ether have been used as a specific host for the side chain of lysine and arginine also in the gas phase by way of electrospray ionization.54 Calixarenes and crown ethers can be used as host compounds, forming inclusion complexes with organic amines and metal ions. The calixarenes possess sizable inner “cavities” that crown ethers or their derivatives do not have. Investigations on the use of a combination of calixarenes and crown ethers for amino acid recognition are less common. To the best of our knowledge, there are few studies on aminoacid recognition with calix-crown on surface. 55
32
2.2. Aim of the work
We aim to develop new calix[n]arene based systems that are not only stable but are also capable of molecular recognition towards amino acids once assembled on the gold surface. The design, synthesis, and characterization of calixarene based materials, for application in chemical sensing and environmental analysis, are the main topic of this thesis.
Alkanthiols are the most common molecules used for Self-Assembled-Monolayer (SAM) on gold surface, for these reason we aim to synthesize calix[4]arenes with alkyl chains having a terminal protected thiol groups.
We plan to develop the procedure for the deprotection of the thiol groups, which might be used directly in situ during the formation of the SAM and verify the formation of the SAM on the gold surface.
Finally we have to test the ability of the calixcrown-SAM to recognize amino acids.
33
2.3. Synthetic strategy
The introduction of the receptors onto the gold surface may affect the recognition properties of the host. To anchor the host on the gold surface we have to insert thiol groups on the host molecule and obtain the gold-sulfur bond; the calix-crown should retain its complexing properties once bound to the gold surface.
For this purpose, we designed two different way to introduce thiol group on the calixarenic scaffold:
1. Direct conversion of alkyl halides to thiol groups, using thiourea followed by basic hydrolysis ( Scheme 2.3.1).
2. Transformation of terminal alkene, into thioesther group, through radical addition at the double bond, catalyzed by AIBN (2,2'-azo-bis-isobutyronitrile), followed by basic hydrolysis to deprotect the SH group ( Scheme 2.3.2).
The versatility of the reactions allowed us to insert alkylic chains of variable length, to evaluate this parameter for the realization of ordered SAM.
The synthesis of the calix[4]arenes 4a-c, with alkyl chains having a terminal thiol group, follows a three step procedure illustrated in scheme 2.3.1.
34
Scheme 2.3.1. Direct conversion of alkyl halides to thiol groups, using thiourea followed by basic
hydrolysis .
Selective O-alkylation of calix[4]arene to obtain bis-propyloxy cone-calix[4]arene (1) was carried out according to literature procedure.56
Reaction of calix[4]arene (1) with 1,6-dibromo-hexane (or 1,8-dibromo-octane and 1,10-dibromo-decane), in presence of NaH in DMF, gave the corresponding calix[4]arene (2a-c) locked in cone conformation. Alkylthiolated calix[4]arene derivatives (4a-c) were obtained by reaction of (2a-c) with thiourea and subsequent basic hydrolysis.
These compounds contains a calix[4]arene blocked in the cone conformation, alkyl chains of variable length and thiol anchoring groups. Scheme 2.3.1. leads us to obtain compound 4 with high yield, but the synthetic pathway preclude further functionalization.
35
The synthesis of the calix[4]arene (8), with alkyl chains having a terminal thiol group, follows a three step procedure illustrated in scheme 2.3.2.
Scheme 2.3.2. Radical addition at the double bond, catalyzed by AIBN (2,2'-azo-bis-isobutyronitrile),
followed by basic hydrolysis to deprotect the SH group .
Exhaustive O-alkylation of calix[4]arene to obtain cone-tetra-allyl-calix[4]arene (6) was carried out according to literature procedure.57 The anchoring group (SH) was inserted onto the alkyl chain as thioacetyl (SOCH3) group through addition of thioacetic acid, mediated by the radical
initiator AIBN, on tetra-alkylated derivative (6).
The hydrolysis of the thioacetyl groups was accomplished in acidic condition to yield the “tetradentate” thiolated calix[4]arene (8) in high yield. Scheme 2.3.2 allows us to obtain compound 8 and the synthetic strategy does not preclude further functionalization. Nevertheless the final compound shows lower stability.
36
In view of the results obtained through the radical addition at the double bond, (catalyzed by AIBN, see Scheme 2.3.2), in order to obtain the calix[4]crown[5] (12), we designed the synthetic route depicted in Scheme 2.3.3.
Scheme 2.3.3. Synthetic route to obtain the calix(4)crown-5 with two thioacetate groups on the upper
37
Starting from calix[4]arene (5) using diallyl-bromide, as alkylating agent, and K2CO3, as a
base, we obtain selective O-alkylation in 1,3 position, namely the compound 25,27-diallyloxy-26,28-dihydroxy-calix[4]arene (9).
In the second step, we synthesized 25,27-diallyloxy-26,28-crown[5]-calix[4]arene (10), by reaction of (9) with tetraethyleneglycol-di-p-toluenesolfonate, (previously synthesized starting from tetraethyleneglycol and p-toluenesolfonylcloride, according to literature procedure58) in the presence of Cs2CO3 as a base. We obtain the calix[4]crown[5] (10) in 1,3-alternate
conformation, due to the template effect of the Cesium cation.
Subsequent Claisen transposition, using N,N-dimethylaniline under reflux, allow the transfer of the allyl groups from the lower rim to the upper rim; the calixarenic scaffold come back again in the cone conformation (11).
The reaction of intermediate (11) with thioacetic acid, in the presence of AIBN as a radical initiator, lead to the addition of the thioacetate groups to the terminal alchene groups.
It is well know that acetyl-protected thiols provided an excellent method to alleviate the problems of isolating and using the oxidatively unstable thiols.59 For this reason, we initially stopped the synthesis at the compound (12); nevertheless the hydrolysis process has been tried in solution and the outcome checked by 1H-NMR spectroscopy (see following schemes). To obtain thiols for SAM applications and to minimizes undesirable oxidation, disulfide formation or polymerization, we carried out the deprotection of the thioacetate groups of compound (12) in situ, during SAM formation.
To optimize the formation of the SAM several attempts have been carried out:
1. In situ basic hydrolysis using NH4OH throughout the SAM formation (Scheme 2.3.4);
38
2. In situ hydrolysis with KOH and methanol (the latter useful as solvent and as reactant for the methanolysis process), throughout the SAM formation (Scheme 2.3.5);
Scheme 2.3.5 Deprotection of thioacete group by hydrolysis with KOH in MeOH.
3. Solution hydrolysis of thioacetate groups of compound (12) to obtain the free thiol groups of compound (13) (scheme 2.3.5) and subsequent formation of the SAM.
The SAM formation has been checked by using TOF-SIMS analysis, that allowed us to verify the chemisorption of the calix-crown on the gold surface and choose the best way to obtain the free thiol groups; at the same time the AFM technique allowed us to study the morphology and the roughness of the SAM surface.
39
2.4 SAM’s formation and ToF-SIMS Characterization
The SAM‟s formation were carried out following the simple standard procedure described in section 1.5. The choose of the solvent has an important role for the formation of the SAM, as in our case it is related to solubility problems of both the starting thioacetate compound (12) and the thiol compound (13).
The secondary ion mass spectrometry in static conditions has been used to verify the formation of self-assembled molecular films of calix[4]arene-crowns[5] on gold. The characterization of the SAM was always performed by acquiring ToF-SIMS spectra, in static mode with positive ion beam, using a primary ion beam of Bi +. In the spectra obtained it is possible to identify highly specific signals, characteristic of systems deposited on the surface. Thus, the ToF-SIMS technique provides a large amount of information with high sensitivity and specificity, typical of high-resolution mass spectrometry.
After the SAM formation following the in situ hydrolysis with NH4OH (see table 2.4.1), the
TOF-SIMS analysis gave us the following data:
The peak at m/z = 243 (view experimental section) confirm the Au-S bond formation and clearly indicates the chemisorption of compounds obtained by in situ deprotection of the thioacetate groups.
The most interesting peaks, related to the molecular ion with Au having m/z = 891 and 931, are not observed (view fig. 2.4.1 and 2.4.2), but it is possible to identify the peak for the molecular ion at m/z = 814 concerning the compound (12) without the Au atom. These observation led us to conclude that the in situ hydrolysis process with NH4OH is
ineffective for the achievement of the calix[4]arene-crowns[5] SAM; therefore we changed strategy for the in situ hydrolysis and we resorted to the methanolysis of the thioacetate groups by using KOH and methanol, as solvent and reactant.
We initially performed this reaction in solution; the thioacetate compound (12) was dissolved in a mixture Acetone/MeOH=2:1 and after addition of the methanolic solution of KOH it is possible to observe the formation of a white precipitate. This precipitate was collected and characterized by NMR spectroscopy, confirming the formation of compound 13, insoluble in acetone and methanol, but soluble in CH2Cl2 (View Table 2.4.1).
For the formation of the SAMs we tried both the direct adsorption of compound 13, having free thiol groups, and the in situ hydrolysis of compound 12, employing the methanolysis procedure. 1,2-dichloroethane was used as a co-solvent able to solubilize both compound 12 (insoluble in CH2Cl2) that compound 13 (insoluble in Acetone).
40
By analyzing the TOF-SIMS spectra (view Fig.2.4.1 and 2.4.2 and experimental section) it is possible to observe the peaks at m/z 931 and 891, that identify the bond between our compound (13) and the gold surface, supporting the formation of the calix[4]arene-crowns[5] SAMs. In the case of in situ hydrolysis, the spectra show a better resolution in peaks at m/z 891 and 931 suggesting that this process is preferable against the direct adsorption of compound 13.
Compound 12 in situ hydrolysis with
NH4OH
Compound 12 in situ hydrolysis with
KOH Compound 13 Solvent AcOH/EtOH 1:1 ClCH2CH2Cl/MeOH 1:1 CH2Cl2/EtOH 1:1 Time 24 h 24 h 24 h Base/Calix-Crown 1:1 2:1 3:1 1:1 --
41
Fig.2.4.1 TOF-SIMS spectra: Diagnostic peak m/Z 931 [M+] for the anchoring on gold surface of calixcrown (13). (a) In situ hydrolysis with NH4OH of compound (12), (b) In situ hydrolysis with KOH in MeOH of compound (12) and SAM formation, (c) SAM formation starting from compound (13).
(a ) (b ) (c )
42
Fig.2.4.2 TOF-SIMS spectra: Diagnostic peak m/Z 891[M+] for the anchoring on gold surface of calixcrown (13). (a) In situ hydrolysis with NH4OH of compound (12), (b) In situ hydrolysis with KOH in MeOH of compound (12) and SAM formation, (c) SAM formation starting from compound (13).
(a ) (b ) (c )
43
2.5 Morphological analysis: AFM
The samples obtained have been subjected to morphological analysis using an atomic force microscope (AFM). The analysis was first conducted on a gold‟s sample, properly cleaned with UV-Ozono, to allow the subsequent comparison with the calix[4]arene-crowns[5] SAMs. The topographic images of the samples were acquired in tapping mode (see figure 2.5.1).
Fig. 2.5.1 AFM image in air in tapping mode of ”height” on the left and of “phase” on the right of a
sample of Au after treatment with UV-O3 (10 min.).
The AFM technique allows also for the quantitative analysis of roughness, on the micro- and nanometer scale. The section analysis, as shown in Figure 2.5.2, allows us to see the presence of aggregates on the surface.
44
From this analysis, therefore, is possible to infer that the gold surface, before the formation of the SAM, shows already a certain roughness.
In Figures 2.5.3 and 2.5.5 are showed the images of the SAM obtained, respectively, from the adsorption free thiol compound (13), and with the in situ hydrolysis process, both acquired in tapping mode. From the phase images is not possible to observe a remarkable morphological variation, which is evident from the section analysis showed, respectively, in figure 2.5.4 and 2.5.6.
Fig. 2.5.3 AFM image in air in tapping mode of ”height” on the left and of “phase” on the right of a
sample of Au first treated with UV-O3 (10 min.) and with SAM obtained starting from compound 13.
45
This information provides further evidence about the presence of the calix[4]arene-crowns[5] on the surface; on these platforms we will run the adsorption‟s study.
Fig. 2.5.5. AFM image in air in tapping mode of”height” on the left and of “phase” on the right of a
sample of Au first treated with UV-O3 (10 min.) and with SAM obtained starting from compound 12 and subsequent in situ hydrolysis.
Fig. 2.5.6. Analysis of section of SAM on Au of compound 12 and subsequent in situ hydrolysis.
On the images obtained was performed a quantitative calculation of the value of roughness on a square of 500x500nm.The roughness values were expressed in terms of mean square roughness (Rq), arithmetic roughness (Ra) and maximum roughness (Rmax), all in nanometers.
Ra is defined as the arithmetic value of the deviations from the real profile of the surface compared to the middle line, and is given by the following relationship:
46
where Lx and Ly are the dimensions of the surface relative to the central plane, represented by the curve f (x, y).
Rq is defined as the standard deviation of the values of Z ( height) within a certain area and is given by:
where Zi is the value of Z in the i-th, ¯Z is the average of the values of Z in a certain area and N is the number of points.
In table 2.5.1 are reported the mean square roughness values obtained for the two samples.
Gold SAM of compound 13 on Gold
SAM of compound 12 (in situ hydrolysis) on
Gold
Rq (nm) 1.57±0.05 2.45±0.05 2.61±0.22
Ra (nm) 1.25±0.04 1.97±0.03 2.06±0.17
Rmax (nm) 13.36±1.25 15.82±1.37 18.15±2.09
47
2.6 Evidence of complexation in solution
In a preliminary study, we investigated the ability of the calixcrown 5 to recognize amino acids in solution through NMR spectroscopy.
It is not possible to study the complexation in water solution because of the different solubility of host and guest (due to the lipophilic nature of the host, and the hydrophilic nature of the guest), then we carried out the complexation study in CDCl3 using the commercially available
lipophilic derivative of lysine, namely the Nα-Acetyl-L-lysine methyl ester hydrochloride (fig.
2.6.1).
Standard 1H-NMR titrations provide evidences of the formation of host–guest complex. From the analysis of the complexation-induced-shift (see fig.2.6.2), it‟s possible to observe an upfield shift for the NH3+ signal (1) and for the methylene in α to the ammonium cation (2), indicating
that the driving force of complexation is the interaction between the ammonium cation of the guest and the host.
48
Fig.2.6.2 Diagramma CIS (complexaation induced shift) of H1-NMR titration using host 5 and Nα-Acetyl-carboxymethyl-L-lysine as guest.
49
2.7 QCM-D analysis: amino acids adsorption on calixcrown-SAM
Once we verified the successful formation of the SAM of compound 5 on gold, our goal is to test the ability of the calixcrown-SAM to recognize the amino acids. For this purpose we have selected four aminoacid (scheme 2.7.1), namely aspartic acid, glycine, lysine and arginine, to have an overview of all amino acids classes and reduce the number of tests.
Scheme 2.7.1
The technique used to test the recognition ability on the calixcrown-SAM, is the quartz crystal microbalance QCM (fig. 2.7.2), which, as described above, allows us to have information on mass variation, with sensitivity on the order of nanograms.
The pH value of the amino acid solution is an important factor to consider, as the speciation of each amino acid changes as the pH of the solution changes, depending also on the nature of the side chain. For these reasons, we decided to carry out our tests at different pH values. In particular for each amino acid, we performed two tests, the first one at a pH value equal to the isoelectric point (pI), (the pH at which the amino acid carries no net electrical charge) and the second in near-neutral solution.
50
Fig. 2.7.1 Schematic representation of amino acids adsorptions on calixcrown-SAM by QCM analysis.
The distribution diagrams and the speciation for the four amino acid (at the investigated pH values) are reported in Scheme 2.7.2 - Scheme 2.7.5,
51
52
53
54
55
Figures 2.7.2-2.7.5 show the frequency (Δf) and dissipation traces (ΔD) versus time for amino acids adsorption onto the calixcrown-SAM at different pH values. The scaling of frequency and dissipation curves at the measured overtones n = 3, 5 and 7 are reported.
56
57