Università degli Studi di Ferrara
DOTTORATO DI RICERCA IN SCIENZE BIOMEDICHE
CICLO XXVI
COORDINATORE Prof. Silvano Capitani
Kinanthropometry
and Sport Practice
Settori Scientifico-Disciplinari: BIO/08
Dottorando Tutore
Dott. Ing. Davide Barbieri Prof.ssa Emanuela Gualdi-Russo
________________________ ________________________
(firma) (firma)
Co-tutore
Dott.ssa Luciana Zaccagni
_________________________ (firma)
2
Università degli Studi di Ferrara
PhD in BIOMEDICAL SCIENCES
XXVI Cycle
COORDINATOR Prof. Silvano Capitani
Kinanthropometry
and Sport Practice
Scientific-Disciplinary sectors: BIO/08
PhD candidate Tutor
Dr. Davide Barbieri Prof. Emanuela Gualdi-Russo
___________________________ ________________________ (signature) (signature) Co-tutor Dr. Luciana Zaccagni ________________________ (signature) Academic years 2011 - 2013
3
Table of contents
1. Introduction ... 5
1.1 The benefits of physical activity ... 5
1.2 Kinanthropometry and physical adaptation ... 6
1.2.1 Body mass and weight ... 7
1.2.2 Body density ... 7
1.2.3 Body fat percentage ... 14
1.2.4 Fat mass and fat free mass ... 15
1.2.5 The body mass index ... 17
1.3 The somatotype ... 20
1.3.1 Anthropometric measures ... 20
1.3.2 Somatotype components ... 21
1.3.3 Somatotype categories ... 22
1.3.4 Differences between somatotypes ... 24
1.4 Kinanthropometry and sport performance ... 24
1.5 Chapters summary ... 26
1.6 References ... 27
2. Strength training and physical adaptation during growth ... 33
2.1 Introduction ... 33
2.2 Strength training: concepts and objectives ... 37
2.3 Benefits and risks of strength training ... 40
2.4 Discussion and conclusions ... 45
2.5 References ... 47
3. First study: Physical activity and body composition in young adults ... 52
3.1 Introduction ... 52
3.2 Sample and methods ... 54
3.3 Results ... 58
3.4 Discussion ... 66
3.5 Conclusion ... 67
3.6 References ... 67
4. Second study: Anthropometry of elite mountain climbers ... 71
4.1 Introduction ... 71
4.2 Materials and methods ... 72
4.3 Results and discussion ... 74
4
5. Third study: Physical adaptation during expeditions at high altitude ... 83
5.1 Introduction ... 83
5.2 Materials and methods ... 84
5.3 Results ... 87
5.4 Discussion and conclusions ... 92
5.5 References ... 94
6. Fourth study: Anthropometric and biomechanical characteristics of a sample of sprinters ... 97
6.1 Introduction ... 97
6.2 Sample and methods ... 101
6.2.1 Anthropometric assessment ... 101
6.2.2 Sprint performance and strength assessment ... 102
6.2.3 Statistical analysis... 102
6.3 Results ... 103
6.4 Discussion and conclusions ... 109
6.5 References ... 116
5
1. Introduction
As all sport practitioners have realized with their personal experience, consistent training and prolonged or intense efforts bring many different consequences on their physical appearance and general condition, which can be described as forms of adaptation. This is an on-going process, consisting in the physical, physiological and behavioral modifications which are needed to cope with the environment, its changes and the resulting stress it imposes on the body. This process never stops during our entire life time and – taken to its extreme consequences - failing to adapt means failing to survive. Adaptation implies elasticity and resilience, and gives the individuals the possibility to prolong their lives. The rigidity of a corpse is the best example of lack of adaptation and it is contrasted by the strength and flexibility of young athletes. Of course, adaptation is never perfect - and this is one of the possible causes of death - but it is definitely a necessity.
1.1 The benefits of physical activity
Physical activity consists in the voluntary activation of the muscles: from standing to walking, and from jogging to sprinting (or cycling, climbing the stairs etc.), we always have to contract our muscles in order to move. Also an isometric contraction, which does not produce an observable movement, implies the activation of some muscles in order to resist an external force or absorb some shock (falling, in a car accident etc.) and therefore the consumption of energy.
This is true even if we are pushing against a wall. The fact that no displacement occurs implies that no mechanical work is produced, since it is defined as the scalar product of force times displacement:
Still, it does not mean that there is no energy expenditure. In fact, also isometric contractions produce work, of electric nature, which requires some calories to be burnt. Once we have accepted the inevitability of physical activity, we can move on to assess its value.
Let alone the times in which hunting, running and fighting were the most popular forms of physical activity - on which individuals had to rely in order to survive - even sitting still on a couch implies a considerable load on the muscle-skeletal system. In fact, a seated subject is continuously adapting to the mechanical stresses imposed on his or her body by gravity and the peculiar posture. This stress is not necessarily mild (Pope et al. 2002), especially if extended, and the negative sides of sedentary behaviors like obesity (an excess of body fat) have been widely assessed (Aranceta Bartrina 2013, González-Gross
6
and Meléndez 2013, León-Muñoz et al. 2013, Santaliestra-Pasías et al. 2013, Zamora-Navarro and Pérez-Llamas 2013).
Quoting Sir Sherrington1, we can say that if we want to either move a mountain or bat an eyelash, in both cases we have to contract some muscles. Therefore, physical activity cannot be avoided and even if we decide to stop breathing, our heart will keep on beating. At least for some time.
On the other side, it is advisable that we do perform some kind of moderate-to- vigorous physical activity because of the evident benefits of it (Lee and Ory 2013), especially in addressing diabetes (Alibasic et al. 2013, Cox et al. 2013, Devries et al. 2013, Jalilian et al. 2013, Venkatasamy et al. 2013) and preventing cardiovascular diseases (Conti and Macchi 2013, Figueiredo et al. 2013, Figueroa et al. 2011, Kawasaki et al. 2011, Tanaka 2009, Williams and Stewart 2009), in particular in older adults. Still, intense physical activity should be promoted among young people, in order to prevent arterial stiffness and related cardiovascular problems which may occur later in life (Van de Laar et al. 2010).
We can try to make a distinction between a generic physical activity and sport. The hiatus is not necessarily so neat, unless we consider only sport performance, at professional/agonistic level, as in competition. This is definitely something more specific than physical activity - even if it certainly is a kind of – because it involves the strive for maximum efficiency and output, and lastly excellence and victory within a codified set of rules. Still, a golf tournament may be less demanding than recreational climbing or wrestling, from a muscular, cardiovascular and energetic point of view.
In the following chapters we shall take into consideration some kinds of physical exercise which are usually considered sports - like mountaineering and weightlifting - since they can involve competition, even if not necessarily. We shall therefore refer to them as sport practice.
1.2 Kinanthropometry and physical adaptation
Regardless of the kind of sport or generic physical activity practiced by a subject, it is necessary to assess the relevant adaptations occurring as a consequence of exercising, in order to evaluate the benefits, especially for general health. Different means can be used by the researchers. This dissertation mostly rely on kinanthropometry, the study of the human body in terms of size, proportion, composition (in terms of fat and fat free mass) and function, in order to understand growth, performance and nutritional status, especially in relation to sport practice.
7
In addition, some measures of strength have been taken into consideration in order to evaluate performance - in terms of biomechanical force production - and health. In particular, hand grip strength has been chosen because of the ease with which it can be measured by means of a dynamometer, and because of its relationship with overall strength and health, at least in adults and older people (Rantanen et al. 1992, 1999, Bohannon 2008, Sasaki et al. 2007). This is consistent with the observation that, in everyday life, whenever we want to lift a weight, we have to use the hands. The same happens in functional training, where no fitness machines are used but barbells, dumbbells, kettlebells and similar implements (Barbieri 2013a) which must be lifted by means of the hands.
1.2.1 Body mass and weight
Body mass and weight are not necessarily related to health, as fat and fat free mass are. In fact, an athlete - a shot putter or a football lineman - may have a very large body mass, like that of an obese subject with the same height, but his or her overall body mass has a much larger amount of lean muscles and dense bones. Still, body mass is actually needed to estimate body density and therefore body composition.
Body mass (BM) is easily assessed in kilograms by means of a scale (necessarily, a professional one). Such piece of equipment actually measures body weight (BW), the physical force with which the Earth and the body mass attract each other. According to the law of Newton, force is defined as the product of mass times acceleration:
where g is gravitational acceleration, corresponding to 9.81 m/s2 approximately and on average. Its value depends on the distance from the center of gravity of the Earth and therefore varies slightly according to the place where the body weight is being measured (Mt. Everest, the Death Valley etc.).
The standard unit of measure of force is the Newton [N], 1 N corresponding to 1 kg of mass being accelerated at 1 m/s2. One kg has therefore a weight of 9,81 N on average within the Earth gravitational field. Scales usually adopt the more common kilogram-force (kgf) as a unit of measure for body weight, and not the standard Newton. One kgf represents the force exerted by 1 kg of mass inside the Earth gravitational field. Therefore , which means that the value read on the scale can be used for both body weight (a force) and body mass as well. The dimensional relationship between force (kgf or N) and mass (kg) is the following:
1.2.2 Body density
Overall average body density (BD) is defined as
8
where BV is total body volume. It is an important anthropometric parameter, which can be measured in order to assess body composition, that is the percentage of body fatness (%F) on total body mass and therefore the relative amount of fat mass (FM) and fat free mass (FFM).
In a simplified, two-component model of the body (Figure 1), total body mass is made up of fat mass and fat free mass:
BM=FM+FFM
which implies that:
BD=DF*%F+DFFM*(1-%F)→%F=(BD-DFFM)/(DF-DFFM)
where DF is the density of fat mass and DFFM is the density of fat free mass, which are given.
Fig. 1. Model of the body with 2 components.
A more detailed description of the composition of human body would acknowledge 4 components (Figure 2). In fact, fat free mass is made of proteins, minerals – i.e. muscles and bones, roughly speaking - and water, all of which have a higher density than fat: DFFM>DF (Table 1). Therefore, from a physical point of view, a high body density implies a low percentage of fat (accordingly, the numerator of the fat equation above BD-DFFM diminishes its module as BD increases).
0% 10% 20% 30% 40% 50% 60% 70% 80% 90% 100%
fat free mass fat
9
Fig. 2. Model of the body with 4 components.
TABLE 1.DENSITY OF COMPONENTS OF FAT FREE MASS AND FAT.
Component Density (g/ml)
Water 0.9937
Protein 1.34
Mineral Fat free mass (estimated average)
3.038 1.100
Fat 0.9007
Density at 36°C. Adapted from Brožek et al. 1963.
Unfortunately, the accuracy of the estimate is negatively affected by the fact that the different components of fat free mass do not have the same density and are not present with the same percentages in different individuals and populations. Therefore, fat free mass may have different average density than in Table 1. Athletes, who usually have a higher-than-average bone mass and density (Nichols et al. 2007, Nindl et al. 1998, Tsai et al. 1996), will have a higher fat free mass average density than assumed, and therefore the fat mass estimate may be lower than it actually is.
Different means can be employed in order to measure average body density. One of the most accurate (in “gold standard” terms) is the Bod Pod (Figure 3), or Air
Displacement Plethysmograph (ADP), which uses whole-body densitometry to determine
body composition. A plethysmograph is a piece of equipment which measures changes in body volume. 0% 10% 20% 30% 40% 50% 60% 70% 80% 90% 100% water proteins minerals fat
10 Fig.3. Bod Pod.
Body mass must be measured by means of an accurate scale. Then the Bod Pod measures body volume using two separate chambers. The test or measurement chamber has a pre-established capacity V1 (the empty space filled by air). The law of Boyle, pV=k, defining the relationship between volume and pressure at constant temperature, is used to measure the volume V2 of the chamber with the subject sitting inside it (Figure 4). The reference chamber has the instrumentation which is used to measure the difference in pressure. Body volume is calculated as BV=V1-V2. Body density is then calculated by the
Bod Pod computer using the equation for body density: BD = BM/BV.
11
Another way of assessing body density is standard surface anthropometry, by means of the skinfold method. A plicometer is used to measure skinfolds (Figure 5) at different body sites (e.g. triceps, biceps etc.) and then several equations are available to calculate overall body density from skinfolds’ thickness. Those elaborated by Jackson and Pollock (1985) are among the most commonly used equations for the general population and for both sexes:
where Χ3 is the sum of the following skinfolds: triceps, chest and sub-scapular;
where Χ3 is the sum of the following skinfolds: triceps, supra-iliac and abdominal. Age is always in years.
Fig. 5. Skinfold thickness measurement (adapted from McArdle et al. 1998).
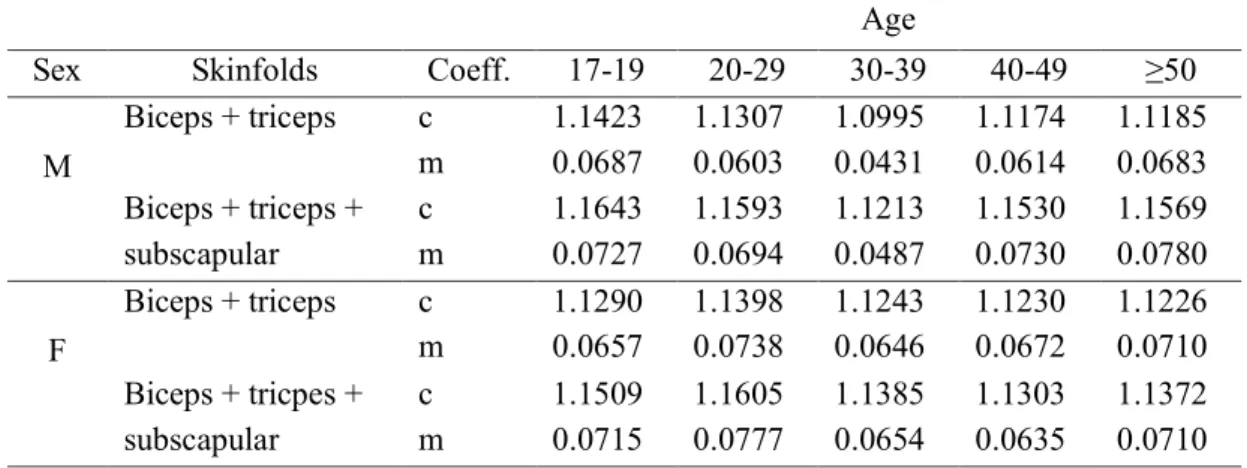
Other generalized equations can be found in the specific literature, e.g. the equations of Durnin and Womersley (1974):
where ∑ skfi is the sum of the skinfolds. Coefficients c and m vary according to sex, age
and skinfolds (from 1 to 4 among the following: biceps, triceps, sub-scapular and supra-iliac). Some parametric values for the two coefficients, in case of 2 or 3 skinfolds, can be found in Table 2.
12
TABLE 2.REGRESSION EQUATIONS’ COEFFICIENTS.
Age
Sex Skinfolds Coeff. 17-19 20-29 30-39 40-49 ≥50
M Biceps + triceps c m 1.1423 0.0687 1.1307 0.0603 1.0995 0.0431 1.1174 0.0614 1.1185 0.0683 Biceps + triceps + subscapular c m 1.1643 0.0727 1.1593 0.0694 1.1213 0.0487 1.1530 0.0730 1.1569 0.0780 F Biceps + triceps c m 1.1290 0.0657 1.1398 0.0738 1.1243 0.0646 1.1230 0.0672 1.1226 0.0710 Biceps + tricpes + subscapular c m 1.1509 0.0715 1.1605 0.0777 1.1385 0.0654 1.1303 0.0635 1.1372 0.0710
Adapted from Durnin and Womersley 1974.
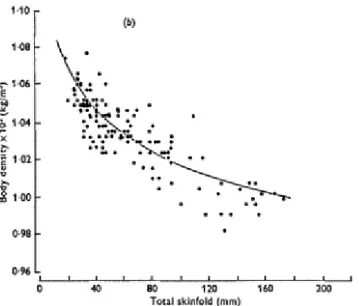
The equations above have been found by means of a statistical procedure. A gold standard method was used to assess the accurate values of body density in a large sample of individuals. Then, skinfolds at different sites were measured for each subject, according to standardized surface anthropometric procedures (Lohman et al. 1988). By means of regression (Figures 6a and 6b), it was possible to find the mathematical relationship between the sum of skinfolds and body density.
Fig. 6a. Individual values for body density and sum of four skinfolds with best-fit regression line derived from log values of skinfolds, for (a) men (adapted from Durnin and Womersley 1974).
13
Fig. 6b. Individual values for body density and sum of four skinfolds with best-fit regression line derived from log values of skinfolds, for (b) women (adapted from Durnin and Womersley 1974).
Usually, the gold standard method adopted was hydro-densitometry, which relies on the principle of Archimede. Even if accurate, this method is highly unpractical, and this is the reason why sport and exercise professionals prefer to adopt other methods, like surface anthropometry. In hydro-densitometry the subject is weighted outside and inside water. Then body density BD is calculated using the following equation:
where:
BW is the weight of the subject in the air.
WD is the density of water at immersion temperature (which can be found in a specific table and it is about 1 g/ml at 4°C).
IBW (immersed body weight) is the weight of the subject while completely immersed in water.
GI is the gastro-intestinal gas and it is estimated at 100 ml approximately (Buskirk 1961).
RV (residual volume) is the volume of air in the lungs after complete exhalation. The expiratory reserve volume (ERV), that is the air we can exhale with a maximal exhalation, can be easily measured by means of a spirometer, which records the volume of the air exhaled through a pipe. Unfortunately though, we cannot measure in this way the remaining air inside the lungs, RV. We first need to measure the functional residual capacity (FRC), that is the volume of the air in the lungs after a normal exhalation, which can be done by means of the helium dilution technique. Then we can calculate RV as FRC-ERV.
14
BW-IBW is the weight of the displaced water, therefore [(BW-IBW)/WD]-(RV+GI) is the volume of the body.
The corrections are needed in order for the equation to take into account air in the lungs and in the abdomen during measurement, although the weighted person is told to exhale maximally. Since the density of water is known and the two weights are measured, then the equation can be easily solved for body density.
1.2.3 Body fat percentage
Once body density has been determined, the percentage of fat mass %F is calculated applying the equation of Siri (1956, 1961):
where the two constants’ estimates are based on the density of FM and FFM at 37°C. Another equation which is commonly adopted in the scientific literature on the topic is the formula of Brožek et al. (1963), where the two constants’ estimates are based on the density of FM and FFM at 36°C:
Cut-points associated to different body fat percentages may vary according to the source. Table 3 lists the ones suggested by COSMED, producer of the Bod Pod, for male and female adults, including suggestions on how to cope with corresponding ratings of body fatness.
TABLE 3.BODY FAT PERCENTAGE RATINGS.
Rating Male %F Females %F Explanation
Risky (too high) >30% >40% Ask your health care professional how to
safely modify your body composition.
Excessive 20-30% 30-40% Indicates an excessive accumulation of fat.
Moderately lean 12-20% 22-30% Fat level is acceptable for good health.
Lean 8-12% 18-22% Lower body fat level than many people.
This range is generally excellent for health and longevity.
Ultra lean 5-8% 15-18% Fat levels often found in elite athletes.
Risky (too low) <5% <15% Ask your health care professional about
how to safely modify your body composition.
15
1.2.4 Fat mass and fat free mass
Once fat mass percentage has been estimated, the following equations can be used to calculate fat mass (FM) and fat free mass (FFM) from body mass (BM):
Body fat percentage must be expressed in decimals (e.g. 12% → 0.12) in the first equation above to immediately calculate fat mass. The whole process of assessing body composition is described in Figure 7.
Fig.7. Body composition evaluation process.
The evaluation of the composition of human body in terms of fat mass and fat free mass is one of the most important anthropometric tasks, because of the relationship between body composition and both sport performance and human health.
In fact, in most cases, a low body fat/fat free mass ratio improves physical performances, while the opposite ratio diminishes them (Claessens et al. 1994, Crawford et al. 2011, Haakonssen et al. 2013, Manchado et al. 2013, Nikolaidis 2013). In particular, excessive adiposity is negatively correlated to performance in sports which require to run or jump, which are instead improved by increased muscle mass (Sporis et al. 2011, Takai et al. 2013). Body fat has a negative correlation to performance also in sports where weight classes exist (Slater et al. 2005, Franchini et al. 2011, García-Pallarés et al. 2011, Ye et al. 2013) like wrestling, martial arts, weightlifting etc. In these disciplines, strength-to-body weight ratio (i.e. relative strength: Fr=F/BW) plays a major role, while added body fatness
may compel the athlete to move to a higher weight category, where stronger opponents compete, without any benefit. In fact, only lean muscle mass may provide increased strength and performance.
Excessive body fatness also negatively affects general health, especially in terms of increased cardiovascular risks (Ford and Caspersen 2012, Van de Laar et al. 2013, Chomistek et al. 2013) and metabolic risks (Matthews et al. 2012), including diabetes (Bastard et al. 2006, Antuna-Puente et al. 2008, Lee et al. 2013).
It must be highlighted that a reduction in body fatness can only be related to a negative balance between energy intake and energy expenditure: energy intake < energy
16
expenditure (McArdle et al. 1998, pp. 618-619, Figure 8), since physiology must respect
the law of physics. For the same reason, an increase in body fatness must necessarily come as a consequence of a positive energetic balance: energy intake > energy expenditure. This is true also in order to increase lean muscle mass, which necessarily require a positive energetic balance (a nihilo nihil).
Body weight instead can vary even in case of energetic balance, since water has a mass but brings no calories. A significant variation in the level of hydration of the body implies a variation in body weight. This may happen, for example, after a sauna, where no significant reduction in body fatness is experienced but fluid is lost because of intense sweating. Similarly, a measurable body weight reduction can be experienced after abundant urination.
Fig. 8. Body mass variation (at a constant hydration level).
A complete body composition report can be seen in Figure 9. The assessment was performed in May 2013 at the Faculty of Kinesiology of the University of Zagreb by means of the Bod Pod system.
17
Fig. 9. Body composition report.
1.2.5 The body mass index
As it can be inferred from the explanations above, to correctly measure the fat mass of an individual is quite cumbersome: it either requires expensive equipment, like the Bod Pod, or it is not easy to do it accurately (for example by means of hydro-densitometry). Even the less accurate skinfold method requires some equipment (a caliper) and skill.
18
For these reasons and for a wider adoption at population level, other indirect measures of body fatness have been proposed. The most popular is probably the body mass index (BMI):
where H is the height in m of the subject being measured. This a very easy index to acquire, even by family practitioners or physical education instructors at school, since all they need are a scale to measure body mass and a stadiometer to measure height.
Unfortunately though, since the definition of BMI does not take into account the varying proportions of fat and fat free mass, it cannot be considered an accurate estimate of adiposity. Even if specificity (i.e. the percentage of overweight people who are actually overfat) is usually good, BMI has low sensitivity2 (i.e. a high percentage of misses, overfat people who do not fall into the overweight category, Table 4) missing more than a half of the individuals with excessive fat in the general population (Romero-Corral et al. 2008, Oliveros et al. 2014) so that we can actually speak of normal weight obesity (De Lorenzo et al. 2006). These findings have been confirmed by a recent research on Italian university students: sensitivity was poor in both sexes, but particularly in females (Zaccagni et al. under review).
TABLE 4.CORRECT CLASSIFICATIONS AND ERRORS.
High %F Normal or low %F
High BMI Overweight and overfat
(true positives)
Overweight but not overfat (false alarms, type I errors)
Normal or low BMI Normal weight but overfat
(misses, type II errors)
Not overweight and not overfat (true negatives)
A similar situation could be found among adolescent females. Even if specificity is good, sensitivity is very low, thus missing to correctly classify as overweight (according to the World Health Organization, WHO) many individuals who were actually overfat (Neovius et al. 2004). This is consistent with the observation that in the general population (i.e. non athletes) people who are overweight are usually not very muscular, and therefore their body mass has a relatively high percentage of fat. WHO cut points are listed in Table 5 and displayed in Figure 9.
TABLE 5.BMI CATEGORIES3.
Cut point Nutritional status
BMI≥30 Obese
25≤BMI<30 Overweight
18.5≤BMI<25 Normal
BMI<18.5 Underweight
2 For an exhaustive explanation of sensitivity and specificity, see Barbieri (2013b).
19
Conversely, in physically active individuals, like young athletes, because of their dense muscle tissue, BMI can have a high sensitivity but a low specificity (Ode et al. 2007), meaning that many individuals who were classified as overweight were not fat (false alarms). A bodybuilder or a weightlifter with a large body mass may easily fall into the overweight category, even if his or her body fatness is very low. Therefore, in the domain of sport, the BMI has limited applicability. Nonetheless, it is still commonly used as an index of the nutritional status in the general population.
Fig. 10. Body Mass Index chart.
Other indices have been proposed to easily assess the level of fatness of individuals and the related health risks (Martin et al. 2013), like the waist circumference WC (Mihalache et al. 2012), the body adiposity index (BAI), the waist-to-hip ratio (WHR) or the waist-to-stature ratio (WSR, or waist-to-height ratio WHtR, Ashwell and Hsieh 2005). BAI can be calculated as follows (Bergman et al. 2011):
where HC is hip circumference in [cm] and H is height in [m]. Most of them have shown their limitations (Bennasar-Veny et al. 2013, Zaccagni et al. under review) mainly because they do not take into consideration fat and fat free mass. Therefore, they can be considered measures of body proportions rather than adiposity. There is a need for further research in order to find an indirect measure of body fatness which is at the same time accurate and easy and cheap to acquire.
20
1.3 The somatotype
According to the Heath-Carter manual4 (Carter 2002), the somatotype is a quantification of the human body shape and composition. By definition, it is expressed in terms of three components:
1. Endomorphy, the relative fatness of the subject. 2. Mesomorphy, the relative musculoskeletal robustness. 3. Ectomorphy, the relative slenderness of the body.
Each of the components above is assigned, after proper measurements, a numeric value, indicating its magnitude. In order to do so, the anthropometric method is employed, by means of some standard equipment.
1.3.1 Anthropometric measures
The following anthropometric measures, usually taken on the left side5, are needed in order to quantify the somatotype of a subject:
Stature (vertex-planta), which can be taken by means of a stadiometer with the head aligned according to the Frankfurt plane (accuracy 0.1 cm).
Body mass (or weight), measured by means of a scale to the nearest tenth of a kilogram.
Skinfolds (by means of a standard plicometer) at the following body sites:
o Triceps: on the back of the upper arm, half way between the acromion (on the shoulder) and the olecranon (on the elbow).
o Sub-scapula: on an oblique (45°) line from the inferior angle of the scapula. o Supra-spina: 5-7 cm above the anterior iliac spine.
o Medial calf: at sura (corresponding to the maximum girth). Bone breadths (by means of an anthropometric sliding caliper):
o Biepicondylar breadth of the humerus: width between medial and lateral epicondyles of the humerus, with elbow flexed.
o Biepicondylar breadth of the femur: width between the medial and lateral epicondyles of the bent knee while the subject is sitting.
Limb girths (by means of a non-stretchable tape):
o Upper arm, elbow flexed and tensed muscle, greatest girth. o Calf: at sura.
Now that the measures have been taken, the somatotype components can be calculated.
4 Downloadable from http://www.somatotype.org/Heath-CarterManual.pdf, accessed November 6th 2013. 5 According to the 1912 Geneva International Anthropometry Standardization Agreement.
21
1.3.2 Somatotype components
To calculate the three somatotype components the following equations are used:
Endomorphy = -0.7182 + 0.1451*X - 0.00068*X2 + 0.0000014*X3
where X=(triceps skinfold + sub-scapular skinfold + supra-spinal skinfold)*(170.18/H), and H is the height of the subject in cm.
Mesomorphy = 0.858*HB + 0.601*FB + 0.188*CAG + 0.161*CCG – H*0.131 + 4.5
where HB = humerus breadth, FB = femur breadth, CAG (corrected arm girth) = flexed arm girth - triceps skinfold/10, CCG (corrected calf girth ) = calf girth - calf skinfold/10. For ectomorphy three different equations are used, according to the height-weight ratio (HWR=H/BW1/3, where BW is body weight):
If HWR≥40.75 then ectomorphy = 0.732*HWR - 28.58
If HWR is less than 40.75 but greater than 38.25 then ectomorphy = 0.463*HWR -
17.63
If HWR is equal to or less than 38.25 then ectomorphy = 0.1
Now that the three somatotype components have been calculated, they can plotted in a 2-D somatocharts, determining the coordinates (x, y) as follows:
x = ectomorphy - endomorphy
y = 2 * mesomorphy - (endomorphy + ectomorphy)
For example, if the subject’s somatotype components are 414, where the first 4 represents endomorphy, 1 represents mesomorphy and the last 4 represents ectomorphy, then his or her somatotype coordinates are (0, -6). In fact, x = ectomorphy – endomorphy = 4-4 = 0, and y = 2 * mesomorphy - (endomorphy + ectomorphy) = 2*1-(4+4) = -6. The three values had been previously calculated with the given equations.
22
Figure 11. The somatochart.
The three-digit numbers which can be seen on the chart in Figure 11 correspond to the values of the three somatotype components. The closest number to the (x, y) point associated to the individual being assessed approximates his or her components’ values. Following the example above, point (0, -6) in red identifies 4-1-4 on the chart.
1.3.3 Somatotype categories
The following seven main categories can be used to classify individuals according to their somatotype:
Central: no component differs by more than 1 from the other two.
Endomorph: endomorphy is dominant, mesomorphy and ectomorphy are more than 0.5 lower.
Endomorph-mesomorph: endomorphy and mesomorphy do not differ by more than 0.5, and ectomorphy is smaller.
Mesomorph: mesomorphy is dominant, endomorphy and ectomorphy are more than 0.5 lower.
Mesomorph-ectomorph: mesomorphy and ectomorphy do not differ by more than 0.5, and endomorphy is smaller.
Ectomorph: ectomorphy is dominant, endomorphy and mesomorphy are more than 0.5 lower.
23
Ectomorph-endomorph: endomorphy and ectomorphy do not differ by more than 0.5, and mesomorphy is lower.
Six more intermediate categories can be added to the main seven above. They can be graphically identified in the somatochart in Figure 12.
Fig. 12. Somatotype categories (adapted from Carter 2002).
At the end of this process, the individual somatotype is thus determined. The subject in the previous example would be in the endomorph – ectomorph category. This assessment may determine an individual predisposition to different sports. In fact, in order to excel in a discipline, different body proportions may be needed (Marta et al. 2013). For example, in volleyball, mesomorphism prevails (Carvajal et al. 2012), but significant differences in the somatotype were observed at different levels of performance, with top players having a higher ectomorphic component compared to less qualified athletes. Moreover, in relation to roles, the mesomorphic component is maximal in setters, while the ectomorphic one is maximal in centers (Gualdi-Russo and Zaccagni 2001). A previous study showed the predominance of the mesomorphic somatotype in most sports - especially in male rowers and gymnast, and in female martial artists - and at increasing levels of performance (Gualdi-Russo and Graziani 1993).
24
1.3.4 Differences between somatotypes
To evaluate the difference between two somatotypes A and B, which can be the somatotypes of two individuals, an individual and a group or two groups, we can calculate the somatotype attitudinal distance (SAD):
In case A and/or B is a group, then the group somatotype is the mean of the components:
where endoi, mesoi and ectoi are the somatotype components of individual i.
The somatotype attitudinal mean (SAM) instead is the mean of a group of somatotypes:
where SADi is the difference between the somatotype of individual i and the group mean,
and n is the number of subjects in the group.
1.4 Kinanthropometry and sport performance
Different anthropometric characteristics can be associated to success in several sport disciplines. Unfortunately though, it is obvious by definition that the traits which describe top athletes can only be found in a small sample of individuals. Therefore, to speak of what it takes to make a champion, the mean value of the selected anthropometric traits must be far from the mean of the general population, and/or the standard deviation (SD) relatively small. But this is not necessarily the case, at least not always. In fact, in many sport disciplines, the acquired fitness and biomechanical skills can still make the difference, eventually compensating a body shape which is apparently far from optimal.
Nonetheless, looking at the appearance of top athletes in sports like basketball, throws, high jump and many others, we can spot some characteristics, at least at national or world-class level, which push us to admit they have something in common. Basketball players and high jumpers are usually very tall, and throwers have a large body mass. This problem has much in common with that of “universals” in epistemology: What top athletes have in common? What is athleticism? Does a set of general traits determine a top athlete? Is it possible to generalize or not? The answer to these questions will be, of course, statistical, in probabilistic terms, and therefore it will allow for exceptions (outliers) and values far from the mean.
25
If we compare the distribution (supposed to be normal) of the height of the general male Australian population (178.6±7.1 cm, mean±SD) with that of a sample of top level male high jumpers (194.7±2.6 cm), we can see that overlapping is minimal. In fact, high jumpers are much taller, on average, and their height is distributed very close to the mean, having a lower standard deviation than the same anthropometric trait in the general population. It is therefore rather unlikely to find a top high jumper with a height close to that of the average Australian male.
Fig. 13. Height distribution in the general male Australian population (blue) and in a sample of elite high jumpers (red). Data are taken from Norton et al. (2004).
Shorter heights than the general population can instead be found in sports like gymnastics, figure skating and diving. Short limbs reduce moments of inertia, thus facilitating the athletes to move at high angular velocities. Shorter skaters and gymnasts can therefore complete more turns. Also, in gymnastics, shorter upper limbs allow to reduce moment arms in suspended positions (e.g. the iron cross on the rings), diminishing the muscular strength required to successfully complete an exercise.
Shorter limbs and more favorable moment arms may help sprinters to accelerate more quickly, also thanks to high strength-to-body weight ratios, as it can be inferred by relatively high BMI and low fat percentage. On the contrary, marathon runners have a low body mass, because muscle mass do not add any competitive advantage, while requiring a lot of energy to carry it for the whole distance to be covered. Both sprinters and long distance runners show very low levels of body fat, which is detrimental to performance in many sports. This is particularly true in those disciplines, like running or jumping, where relative strength is critical for improvement.
Similarly, sports with weight classes, like wrestling, boxing and weight lifting, compel athletes to minimize their body fat in order to reach their optimal weight and
26
remain inside their class. In higher classes in fact, added body fat would not result in improved performances and larger, more powerful athletes would be at an advantage.
The human phenotype - shape or morphology - is the result of the interaction between the genotype (the genes of a subject) and environment, the surrounding conditions to which an individual is subjected, including sport training, nutrition, climate, lifestyle, habits etc. Bouchard and Lortie (1984) exemplified this interaction between genetics and non-genetic factors in endurance athletes by means of the following equation:
VP=VG+VE+VGxE+e
where VP is the total variation observed in the phenotype, VG the genetic component, VE
the non-genetic component (the environment), VGxE the interaction effect between the two,
and e is the random error.
1.5 Chapters summary
In this dissertation we are going to consider different kinds of physical activity, mainly strenuous and sport-related (like strength training, mountaineering and sprinting), and describe their effects on body composition and other anthropometric traits, in order to improve our understanding of how the body adapts and the relationship between body composition, somatotype and performance.
In the second chapter, we shall examine a review of the studies on strength training before and during adolescence, in order to evaluate its benefits and risks, especially for what concern growth and bones (mass and density). Also, the prolonged benefits for health after adolescence into adulthood will be evaluated - especially in women - in terms of osteoporosis prevention.
In the third chapter - the first original research - physical activity among young adults and its benefits for body composition will be described, assessing in particular the relationship between training volume and anthropometric traits. The sample is represented by a large group of Italian university students of the School of Sport Science of the University of Ferrara.
After children, adolescents and youngsters, adults will be taken into consideration in the second and third original researches. In the fourth chapter, a selected sample of elite mountain climbers will be assessed from an anthropometric point of view, in order to describe their specific characteristics. In the fifth chapter, a study will examine the effects of exposure to high altitude and trekking in a sample of recreational mountaineers by means of repeated measurements before, during and after an expedition on the Himalaya.
In the sixth chapter, an original study on sprinters’ anthropometry and muscular strength will be presented. In particular, the relationship between these characteristics and
27
performance will be discussed, including implications for general health and body mass (fat and fat free) management.
1.6 References
Alibasic E, Ramic E, Alic A. Prevention of Diabetes in Family Medicine. Mater Sociomed. 2013; 25(2):80-82.
Antuna-Puente B, Feve B, Fellahi S, Bastard JP. Adipokines: the missing link between insulin resistance and obesity. Diabetes Metab. 2008 Feb; 34(1):2-11.
Ashwell M, Hsieh SD. Six reasons why the waist-to-height ratio is a rapid and effective global indicator for health risks of obesity and how its use could simplify the international public health message on obesity. Int J Food Sci Nutr. 2005 Aug; 56(5):303-7.
Aranceta Bartrina J. Public health and the prevention of obesity: failure or success? Nutr
Hosp. 2013 Sep; 28 Suppl 5:128-37.
Barbieri D, Elementi di base per l'allenamento funzionale. Il gioco del ferro, Calzetti Mariucci, Perugia, 2013a.
Barbieri D, Bayesian Intelligence Analysis, in Proceedings of the 19th Conference on
Intelligence in the Knowledge Society, Bucharest (Romania), 18th October 2013b.
Bastard JP, Maachi M, Lagathu C, Kim MJ, Caron M, Vidal H, Capeau J, Feve B. Recent advances in the relationship between obesity, inflammation, and insulin resistance. Eur
Cytokine Netw. 2006 Mar; 17(1):4-12.
Bennasar-Veny M, Lopez-Gonzalez AA, Tauler P, Cespedes ML, Vicente-Herrero T, Yañez A, Tomas-Salva M, Aguilo A. Body adiposity index and cardiovascular health risk factors in Caucasians: a comparison with the body mass index and others. PLoS One. 2013 May 29; 8(5):e63999.
Bergman RN, Stefanovski D, Buchanan TA, Sumner AE, Reynolds JC, Sebring NG, Xiang AH, Watanabe RM. A better index of body adiposity. Obesity (Silver Spring). 2011 May; 19(5):1083-9.
Bohannon RW. Hand-grip dynamometry predicts future outcomes in aging adults. J
Geriatr Phys Ther. 2008; 31(1):3-10.
Bouchard T, Lortie G. Heredity and endurance performance. Sports Medicine, 1(1):38-64, 1984 January.
Brožek J, Grande F, Anderson JT, Keys A. Densitometric Analysis of Body Composition: Revision of Some Quantitative Assumptions, Annals of the New York Academy of
28
Buskirk ER, Underwater weighing and body density: A review of procedures, in Brožek J and Henschel A (eds), Techniques for measuring body composition, Washington DC (USA), National Academy of Sciences, National Research Council, pp. 90-105, 1961. Carter JEL, The Heath-Carter Anthropometric Somatotype - Instruction Manual. Dep. of Exercise and Nutritional Science, San Diego State University (CA, USA), 2002.
Carvajal W, Betancourt H, León S, Deturnel Y, Martínez M, Echevarría I, Castillo ME, Serviat N. Kinanthropometric profile of Cuban women Olympic volleyball champions.
MEDICC Rev. 2012 Apr; 14(2):16-22.
Chomistek AK, Manson JE, Stefanick ML, Lu B, Sands-Lincoln M, Going SB, Garcia L, Allison MA, Sims ST, LaMonte MJ, Johnson KC, Eaton CB. Relationship of sedentary behavior and physical activity to incident cardiovascular disease: results from the Women's Health Initiative. J Am Coll Cardiol. 2013 Jun 11; 61(23):2346-54.
Claessens AL, Hlatky S, Lefevre J, Holdhaus H. The role of anthropometric characteristics in modern pentathlon performance in female athletes. J Sports Sci. 1994 Aug; 12(4):391-401.
Conti AA, Macchi C. Protective effects of regular physical activity on human vascular system. Clin Ter. 2013 Jul-Aug; 164(4):293-4.
Cox DJ, Taylor AG, Dunning ES, Winston MC, Luk Van IL, McCall A, Singh H, Yancy WS Jr. Impact of Behavioral Interventions in the Management of Adults with Type 2 Diabetes Mellitus. Curr Diab Rep. 2013 Sep 27.
Crawford K, Fleishman K, Abt JP, Sell TC, Lovalekar M, Nagai T, Deluzio J, Rowe RS, McGrail MA, Lephart SM. Less body fat improves physical and physiological performance in army soldiers. Mil Med. 2011 Jan; 176(1):35-43.
De Lorenzo A, Martinoli R, Vaia F, Di Renzo L. Normal weight obese (NWO) women: an evaluation of a candidate new syndrome. Nutr Metab Cardiovasc Dis. 2006 Dec; 16(8):513-23.
Devries MC, Samjoo IA, Hamadeh MJ, McCready C, Raha S, Watt MJ, Steinberg GR, Tarnopolsky MA. Endurance Training Modulates Intramyocellular Lipid Compartmentalization and Morphology in Skeletal Muscle of Lean and Obese Women. J
Clin Endocrinol Metab. 2013 Sep 30.
Durnin, JV, Womersley J. Body fat assessed from total body density and its estimation from skinfold thickness: measurements on 481 men and women aged from 16 to 72 years.
British Journal of Nutrition, 1974, 3:77-97.
Figueiredo PA, Appell Coriolano HJ, Duarte JA. Cardiac Regeneration and Cellular Therapy: Is there a Benefit of Exercise? Int J Sports Med. 2013 Jul 30.
29
Figueroa A, Park SY, Seo DY, Sanchez-Gonzalez MA, Baek YH. Combined resistance and endurance exercise training improves arterial stiffness, blood pressure, and muscle strength in postmenopausal women. Menopause. 2011 Sep; 18(9):980-4.
Ford ES, Caspersen CJ. Sedentary behaviour and cardiovascular disease: a review of prospective studies. Int J Epidemiol. 2012 Oct; 41(5):1338-53.
Franchini E, Del Vecchio FB, Matsushigue KA, Artioli GG. Physiological profiles of elite judo athletes. Sports Med. 2011 Feb 1; 41(2):147-66.
García-Pallarés J, López-Gullón JM, Muriel X, Díaz A, Izquierdo M. Physical fitness factors to predict male Olympic wrestling performance. Eur J Appl Physiol. 2011 Aug; 111(8):1747-58.
González-Gross M, Meléndez A. Sedentarism, active lifestyle and sport: Impact on health and obesity prevention. Nutr Hosp. 2013 Sep;28 Suppl 5:89-98.
Gualdi-Russo E, Graziani I. Anthropometric somatotype of Italian sport participants. J
Sports Med Phys Fitness. 1993 Sep; 33(3):282-91.
Gualdi-Russo E, Zaccagni L. Somatotype, role and performance in elite volleyball players.
J Sports Med Phys Fitness. 2001 Jun; 41(2):256-62.
Haakonssen EC, Martin DT, Burke LM, Jenkins DG. Increased lean mass with reduced fat mass in an elite female cyclist returning to competition: case study. Int J Sports Physiol
Perform. 2013 Nov; 8(6):699-701.
Jackson AS, Pollock ML. Practical Assessment of Body Composition. The Physician and
Sports Medicine. 1985; 13:76-90.
Jalilian M, Moeini B, Hazavehei SM, Beigi AM, Sharifirad G, Nodeh FH. Physical activity stage-matched intervention: Promoting metabolic control in type 2 diabetes. J Educ Health
Promot. 2013 Apr 30; 2:18.
Kawasaki T, Sullivan CV, Ozoe N, Higaki H, Kawasaki J. A long-term, comprehensive exercise program that incorporates a variety of physical activities improved the blood pressure, lipid and glucose metabolism, arterial stiffness, and balance of middle-aged and elderly Japanese. Hypertens Res. 2011 Sep; 34(9):1059-66.
Lee H, Lee IS, Choue R. Obesity, Inflammation and Diet. Pediatr Gastroenterol Hepatol
Nutr. 2013 Sep; 16(3):143-152.
Lee WC, Ory MG. The Engagement in Physical Activity for Middle-Aged and Older Adults with Multiple Chronic Conditions: Findings from a Community Health Assessment.
J Aging Res. 2013; 2013:152868 doi: 10.1155/2013/152868. Epub 2013 Sep 5.
León-Muñoz LM, Gutiérrez-Fisac JL, Guallar-Castillón P, Regidor E, López-García E, Martínez-Gómez D, Graciani A, Banegas JR, Rodríguez-Artalejo F. Contribution of lifestyle factors to educational differences in abdominal obesity among the adult
30
population. Clin Nutr. 2013 Oct 23. pii: S0261-5614(13)00272-0. doi: 10.1016/ j.clnu.2013.10.013.
Lohman TG, Roche AF, Martorell R. Anthropometric Standardization Reference Manual, Human Kinetics, Champaign (IL, USA), 1988.
Manchado C, Tortosa-Martínez J, Vila H, Ferragut C, Platen P. Performance factors in women's team handball: physical and physiological aspects - a review. J Strength Cond
Res. 2013 Jun; 27(6):1708-19.
Marta CC, Marinho DA, Barbosa TM, Carneiro AL, Izquierdo M, Marques MC. Effects of body fat and dominant somatotype on explosive strength and aerobic capacity trainability in prepubescent children. J Strength Cond Res. 2013 Sep 25.
Martin BJ, Verma S, Charbonneau F, Title LM, Lonn EM, Anderson TJ. The relationship between anthropometric indexes of adiposity and vascular function in the FATE cohort.
Obesity (Silver Spring). 2013 Feb; 21(2):266-73.
Matthews CE, George SM, Moore SC, Bowles HR, Blair A, Park Y, Troiano RP, Hollenbeck A, Schatzkin A. Amount of time spent in sedentary behaviors and cause-specific mortality in US adults. Am J Clin Nutr. 2012 Feb; 95(2):437-45.
McArdle WD, Katch FI, Katch VL, Fisiologia Applicata allo Sport, Casa Editrice Ambrosiana, Milano (Italy), 1998.
Mihalache L, Graur LI, Popescu DS, Niţă O, Graur M. Anthropometric parameters--predictive factors for cardio-metabolic diseases. Rev Med Chir Soc Med Nat Iasi. 2012 Jul-Sep; 116(3):794-8.
Neovius MG, Linné YM, Barkeling BS, Rossner SO. Sensitivity and specificity of classification systems for fatness in adolescents. Am J Clin Nutr. 2004 Sep; 80(3):597-603. Nichols DL, Sanborn CF, Essery EV. Bone density and young athletic women. An update.
Sports Med. 2007; 37(11):1001-14. Review.
Nikolaidis PT. Body mass index and body fat percentage are associated with decreased physical fitness in adolescent and adult female volleyball players. J Res Med Sci. 2013 Jan; 18(1):22-6.
Nindl BC, Kraemer WJ, Emmert WH, Mazzetti SA, Gotshalk LA, Putukian M, Sebastianelli WJ, Patton JF. Comparison of body composition assessment among lean black and white male collegiate athletes. Med Sci Sports Exerc. 1998 May; 30(5):769-76. Norton K, Olds T, Olive S, Craig N. Anthropometry and Sports Performance. In: Norton K, Olds T (eds). Anthropometrica. University of New South Wales Press ltd, Sidney (Australia), pp. 289-365, 2004.
Ode JJ, Pivarnik JM, Reeves MJ, Knous JL. Body mass index as a predictor of percent fat in college athletes and nonathletes. Med Sci Sports Exerc. 2007 Mar; 39(3):403-9.
31
Oliveros E, Somers VK, Sochor O, Goel K, Lopez-Jimenez F. The concept of normal weight obesity. Prog Cardiovasc Dis. 2014 Jan-Feb; 56(4):426-33.
Pope MH, Goh KL, Magnusson ML. Spine ergonomics. Annu Rev Biomed Eng. 2002; 4:49-68.
Rantanen T, Guralnik JM, Foley D, Masaki K, Leveille S, Curb JD, White L. Midlife hand grip strength as a predictor of old age disability. JAMA. 1999 Feb 10; 281(6):558-60. Rantanen T, Parkatti T, Heikkinen E. Muscle strength according to level of physical exercise and educational background in middle-aged women in Finland. Eur J Appl
Physiol Occup Physiol. 1992; 65(6):507-12.
Romero-Corral A, Somers VK, Sierra-Johnson J, Thomas RJ, Collazo-Clavell ML, Korinek J, Allison TG, Batsis JA, Sert-Kuniyoshi FH, Lopez-Jimenez F. Accuracy of body mass index in diagnosing obesity in the adult general population. Int J Obes. (Lond.) 2008 Jun; 32(6):959-66.
Santaliestra-Pasías AM, Rey-López JP, Moreno Aznar LA. Obesity and sedentarism in children and adolescents: what should be done? Nutr Hosp. 2013 Sep;28 Suppl 5:99-104. Sasaki H, Kasagi F, Yamada M, Fujita S. Grip strength predicts cause-specific mortality in middle-aged and elderly persons. Am J Med. 2007 Apr; 120(4):337-42.
Siri WE. The gross composition of the body. Advances in Biological and Medical Physics, 1956, 4:239-80.
Siri WE. Body composition from fluid spaces and density: Analysis of methods. In Brozek J, Henzchel A. (eds.) Techniques for Measuring Body Composition, Washington, National Academy of Sciences, 1961, pp. 224–244.
Slater GJ, Rice AJ, Mujika I, Hahn AG, Sharpe K, Jenkins DG. Physique traits of lightweight rowers and their relationship to competitive success. Br J Sports Med. 2005 Oct; 39(10):736-41.
Sporis G, Jukić I, Bok D, Vuleta D Jr, Harasin D. Impact of body composition on performance in fitness tests among personnel of the Croatian navy. Coll Antropol. 2011 Jun; 35(2):335-9.
Takai Y, Fukunaga Y, Fujita E, Mori H, Yoshimoto T, Yamamoto M, Kanehisa H. Effects of body mass-based squat training in adolescent boys. J Sports Sci Med. 2013 Mar 1; 12(1):60-5.
Tanaka H. Swimming exercise: impact of aquatic exercise on cardiovascular health. Sports
Med. 2009; 39(5):377-87.
Tsai SC, Kao CH, Wang SJ. Comparison of bone mineral density between athletic and non-athletic Chinese male adolescents. Kaohsiung J Med Sci. 1996 Oct; 12(10):573-80.
32
Tyler AE, Hutton RS. Was Sherrington right about co-contractions? Brain Res. 1986 Apr 2; 370(1):171-5.
Van de Laar RJ, Ferreira I, van Mechelen W, Prins MH, Twisk JW, Stehouwer CD. Lifetime vigorous but not light-to-moderate habitual physical activity impacts favorably on carotid stiffness in young adults: the Amsterdam growth and health longitudinal study.
Hypertension. 2010 Jan; 55(1):33-9.
Van de Laar RJ, Stehouwer CD, Prins MH, van Mechelen W, Twisk JW, Ferreira I. Self-reported time spent watching television is associated with arterial stiffness in young adults: the Amsterdam Growth and Health Longitudinal Study. Br J Sports Med. 2013 Oct 7. Venkatasamy VV, Pericherla S, Manthuruthil S, Mishra S, Hanno R. Effect of Physical activity on Insulin Resistance, Inflammation and Oxidative Stress in Diabetes Mellitus. J
Clin Diagn Res. 2013 Aug; 7(8):1764-1766.
Williams MA, Stewart KJ. Impact of strength and resistance training on cardiovascular disease risk factors and outcomes in older adults. Clin Geriatr Med. 2009 Nov; 25(4):703-14.
Ye X, Loenneke JP, Fahs CA, Rossow LM, Thiebaud RS, Kim D, Bemben MG, Abe T. Relationship between lifting performance and skeletal muscle mass in elite powerlifters. J
Sports Med Phys Fitness. 2013 Aug; 53(4):409-14.
Zaccagni L, Barbieri D, Gualdi Russo E. Body composition and physical activity in Italian university students. In review.
Zamora Navarro S, Pérez-Llamas F. Errors and myths in feeding and nutrition: impact on the problems of obesity. Nutr Hosp. 2013 Sep;28 Suppl 5:81-8.
33
2. Strength training and physical
adaptation during growth
In the following research, the most evident body adaptations during growth and their persistence in adulthood as a consequence of strength training - like weight lifting and plyometrics - have been reviewed (Barbieri and Zaccagni 2013). In particular, the effects on the skeleton (bone mass, density etc.) of adolescent boys and girls, and the eventual benefits for health, specifically for the prevention of osteoporosis in adult women, have been evaluated.
Physical activity has proved to be an effective means of preventing several diseases and improving general health. In most cases, though, light to moderate efforts are suggested, for both youngsters and adults. Common sense advices call for late inception of intense, strength-related activities, like weight lifting and plyometrics, which are usually postponed at the end of the growth age, even among sport practitioners. However, such advices seem to have a mainly anecdotal nature. The purpose of this review is to evaluate risks and benefits of early inception of strength training, at adolescence or even earlier, and to verify whether concerns can be grounded scientifically.
Current literature does not seem to have any particular aversion against the practice of strength training by children and adolescents, provided that some safety rules are followed, like medical clearance, proper instruction from a qualified professional and progressive overload. At the same time, several studies provide consistent findings supporting the benefits of repeated and intense physical efforts in young subjects. Improved motor skills and body composition, in terms of increased fat free mass, reduced fat mass and enhanced bone health, have been extensively documented, especially if sport practice began early, when the subjects were pubescent. It can be therefore concluded that strength training is a relatively safe and healthy practice for children and adolescents.
2.1 Introduction
Modern Western societies imply increasingly sedentary life styles and reduced physical exercise. Technological progress, limited outdoor activities and economic improvement have modified dietary habits and reduced the amount of exercise performed by children and adolescents (Morano and Colella 2009). It is well known that regular moderate intensity physical activity – such as walking or cycling – has significant benefits for health. According to the 2008 guidelines of the European Commission, school-aged youth should participate in moderate to vigorous daily physical activity for 60 minutes or more.
Obesity, sedentary lifestyle and poor cardio-respiratory fitness in childhood and adolescence may increase the risk of health problems later in life. The teenage years bring
34
many physical, social and psychological changes for the individual. From infancy to adulthood, growth, maturation and development occur simultaneously and interact: growth consists in the increase of the size of the body as a whole and of its parts, maturation refers to progress towards the biologically mature state and development refers to the acquisition of behavioral competence (Malina 2006a).
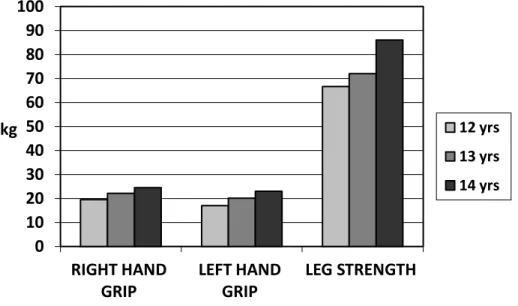
Changes in body dimensions and composition during growth and maturation are factors affecting strength and motor performance (Malina et al. 2004). Some changes in anthropometric traits and strength in a sample of Italian adolescents studied by Gualdi-Russo and Toselli (1997) are reported in Figures 1-4.
Fig. 1. Anthropometric traits in a sample of Italian adolescent males (adapted from Gualdi-Russo and Toselli 1997) by age.
Fig. 2. Anthropometric traits in a sample of Italian adolescent females (adapted from Gualdi-Russo and Toselli 1997) by age.
Strength and motor performance vary during childhood and adolescence in relation to biological and environmental factors. Among biological factors the specific contribution
0 20 40 60 80 100 120 140 160 180
WEIGHT (kg) HEIGHT (cm) BMI (kg/m2)
12 yrs 13 yrs 14 yrs 0 20 40 60 80 100 120 140 160 180
WEIGHT (kg) HEIGHT (cm) BMI (kg/m2)
12 yrs 13 yrs 14 yrs
35
of maturity status is apparent: the strength advantage of early-maturing subjects is related to their larger body size in comparison to late-maturing ones. These differences are more marked in boys than in girls. Regular physical activity is an important factor during growth and maturation, regulating body weight and, particularly, fatness.
Fig. 3. Strength values in a sample of Italian adolescent males (adapted from Gualdi-Russo and Toselli 1997) by age.
Fig. 4. Strength values in a sample of Italian adolescent females (adapted from Gualdi-Russo and Toselli 1997) by age.
Information on the characteristics of elite young athletes in a variety of sports is rather limited. The evaluation of the maturity status is essential when working with young athletes because individual differences in the timing and tempo of biological maturation, particularly during adolescence, influence body size and composition, muscular strength
0 10 20 30 40 50 60 70 80 90 100 RIGHT HAND GRIP LEFT HAND GRIP LEG STRENGTH kg 12 yrs 13 yrs 14 yrs 0 10 20 30 40 50 60 70 80 90 100 RIGHT HAND GRIP LEFT HAND GRIP LEG STRENGTH kg 12 yrs 13 yrs 14 yrs
36
and behavior. Inter-individual variability has important implications for performance, age-group competitions and talent identification, selection and development.
Albeit BMI is widely used in surveys of health and nutritional status, its interpretation in young adults, especially athletes, as an indicator of fatness should be taken with caution. Therefore, in kinanthropometry, in order to evaluate the positive effects of physical activity on body composition, the athlete’s body fat percentage, fat mass and fat free mass are assessed. Changes in body composition from early to late adolescence can be summarized as follows: males gain almost twice as much fat free mass as females, and females gain about twice as much fat mass as males.
Large fat free mass is important in performances that require force to be exerted against an object, as in shot put or weight lifting, but can be a limiting factor in tasks in which the body must be projected as in vertical jump or moved across space, as in running. Fat free mass is significantly related to strength in male adolescents (Malina 2006a).
In sport practice, strength training was usually introduced at the end of the somatic growth, that is when the athlete was 18 years old or so. In particular, to avoid weight lifting before and during adolescence was a common suggestion in many different contexts connected to physical activity, from commercial gyms to physical education courses. This conservative approach has a mainly anecdotal origin, since usually no scientific evidence is given in order to support it.
Most of the concerns are related to the possibility of injuries or diminished growth potential. Still, many of the young athletes who regularly compete in various sport disciplines begin their training very early, when they are pubescent or even pre-pubescent. Beside the fact that students begin physical education at primary school in many countries, early inception of sport practice is often suggested in order to take advantage of the ease and quickness with which children and adolescents improve their motor control and acquire new sport skills.
Furthermore, adolescents can be observed while lifting weights during their usual daily activities, outside a sport or training facility: carrying a schoolbag, a suitcase, a shopping bag or other items, lifting them from the floor. Without proper training, they may do it rounding their back or using any other improper technique, while the correct one could be learnt under supervision from a weight lifting instructor, inside a gym.
It is therefore necessary to evaluate whether the advice to postpone strength training in general and weight lifting in particular at the end of adolescence is sound and can be substantiated scientifically. The main purposes of the present review are the following: to find any evidence in current literature of benefits or dangers for the health of the adolescents related to early inception of strength training, and to compare the relative stress of this kind of physical activity to other common sport practices.
37
2.2 Strength training: concepts and objectives
Strength training is a form of physical activity, usually structured and planned, involving intense efforts against a resistance. Its main aim is to increase muscular strength, in order to improve performance, at least in case a sport is practiced. It is extensively adopted in power-oriented sports, like sprinting (Delecluse 1997) and soccer(Wisløff 2004), even if its benefits are recognized also in endurance sports, like long distance running (Yamamoto et al. 2008, Paavolainen et al. 1999) and cross-country skiing (Hoff et al. 2002, Østerås et al. 2002).
In a non-competitive environment instead, strength training is adopted for many different purposes. For example, strength training may be used to improve overall fitness, increasing muscle hypertrophy and reducing body fatness at the same time. In fact, strength training can be an effective means to improve body composition (Paoli et al. 2010). In other cases, some individuals may adopt it in order to accomplish some professional goal, like achieving the degree of physical fitness which is required in the military or to join the fire brigade.
To train strength, muscular force is applied against some kind of resistance. In most cases, especially when the individual is healthy, resistance is provided by free weights, like barbells, dumbbells or the athlete’s own body weight, or by weight machines, like the leg press, the lat machine etc. This kind of training is usually adopted in sport conditioning, because the load can be increased progressively according to the athlete’s strength, which can be considerable.
Athletes employ gravity also in other ways in order to improve their performances, like in plyometrics or high-impact training, where body mass is accelerated dropping from a pre-determined height, according to the athlete’s ability and conditioning level. This kind of strength training is usually considered the most dangerous, because the real impact forces applied to the athlete’s body (bones, muscles, tendons, ligaments etc.) are not easily measured, as in weight lifting.
Physical force, a vectorial quantity, is defined as follows:
that is mass times acceleration. Weight lifting mainly focuses on the first factor, adding mass to the barbell to be lifted (if the load is lifted at constant speed, as it usually happens in body building), while plyometrics relies on the second, that is gravitational acceleration, in order to produce force. Nonetheless, also weights can be accelerated, as in Olympic weightlifting, in order to increase force production without adding kilograms, and advanced plyometrics may imply added weight by means of weighted belts or vests.
It must be considered, though, that similar strength training effects can be found in sport practices other than weight lifting or plyometrics, like sprinting, gymnastics and other